
|
|||||
|
 | |
| |
| |
| |
| |
| |
|
Gene: ZNF195 |
Gene summary for ZNF195 |
| Gene information | Species | Human | Gene symbol | ZNF195 | Gene ID | 7748 |
| Gene name | zinc finger protein 195 | |
| Gene Alias | HRF1 | |
| Cytomap | 11p15.4 | |
| Gene Type | protein-coding | GO ID | GO:0006139 | UniProtAcc | O14628 |
Top |
Malignant transformation analysis |
| Identification of the aberrant gene expression in precancerous and cancerous lesions by comparing the gene expression of stem-like cells in diseased tissues with normal stem cells |
| Entrez ID | Symbol | Replicates | Species | Organ | Tissue | Adj P-value | Log2FC | Malignancy |
| 7748 | ZNF195 | LZE4T | Human | Esophagus | ESCC | 4.64e-03 | 8.30e-02 | 0.0811 |
| 7748 | ZNF195 | LZE7T | Human | Esophagus | ESCC | 1.77e-05 | 2.32e-01 | 0.0667 |
| 7748 | ZNF195 | LZE8T | Human | Esophagus | ESCC | 3.42e-04 | 8.68e-02 | 0.067 |
| 7748 | ZNF195 | LZE20T | Human | Esophagus | ESCC | 7.92e-03 | 6.17e-02 | 0.0662 |
| 7748 | ZNF195 | LZE24T | Human | Esophagus | ESCC | 3.03e-14 | 3.87e-01 | 0.0596 |
| 7748 | ZNF195 | LZE21T | Human | Esophagus | ESCC | 1.05e-02 | 1.85e-01 | 0.0655 |
| 7748 | ZNF195 | P1T-E | Human | Esophagus | ESCC | 4.31e-02 | 1.35e-01 | 0.0875 |
| 7748 | ZNF195 | P2T-E | Human | Esophagus | ESCC | 1.94e-26 | 5.52e-01 | 0.1177 |
| 7748 | ZNF195 | P4T-E | Human | Esophagus | ESCC | 2.74e-11 | 3.06e-01 | 0.1323 |
| 7748 | ZNF195 | P5T-E | Human | Esophagus | ESCC | 2.53e-06 | 5.12e-02 | 0.1327 |
| 7748 | ZNF195 | P8T-E | Human | Esophagus | ESCC | 2.31e-17 | 2.14e-01 | 0.0889 |
| 7748 | ZNF195 | P9T-E | Human | Esophagus | ESCC | 1.10e-06 | 1.33e-01 | 0.1131 |
| 7748 | ZNF195 | P10T-E | Human | Esophagus | ESCC | 4.66e-20 | 3.67e-01 | 0.116 |
| 7748 | ZNF195 | P11T-E | Human | Esophagus | ESCC | 1.00e-08 | 4.69e-01 | 0.1426 |
| 7748 | ZNF195 | P12T-E | Human | Esophagus | ESCC | 2.03e-22 | 3.95e-01 | 0.1122 |
| 7748 | ZNF195 | P15T-E | Human | Esophagus | ESCC | 2.04e-24 | 2.62e-01 | 0.1149 |
| 7748 | ZNF195 | P16T-E | Human | Esophagus | ESCC | 7.96e-08 | 1.70e-01 | 0.1153 |
| 7748 | ZNF195 | P17T-E | Human | Esophagus | ESCC | 6.23e-07 | 2.60e-01 | 0.1278 |
| 7748 | ZNF195 | P20T-E | Human | Esophagus | ESCC | 3.48e-17 | 2.61e-01 | 0.1124 |
| 7748 | ZNF195 | P21T-E | Human | Esophagus | ESCC | 1.96e-09 | 1.87e-01 | 0.1617 |
| Page: 1 2 3 4 |
| Tissue | Expression Dynamics | Abbreviation |
| Esophagus | 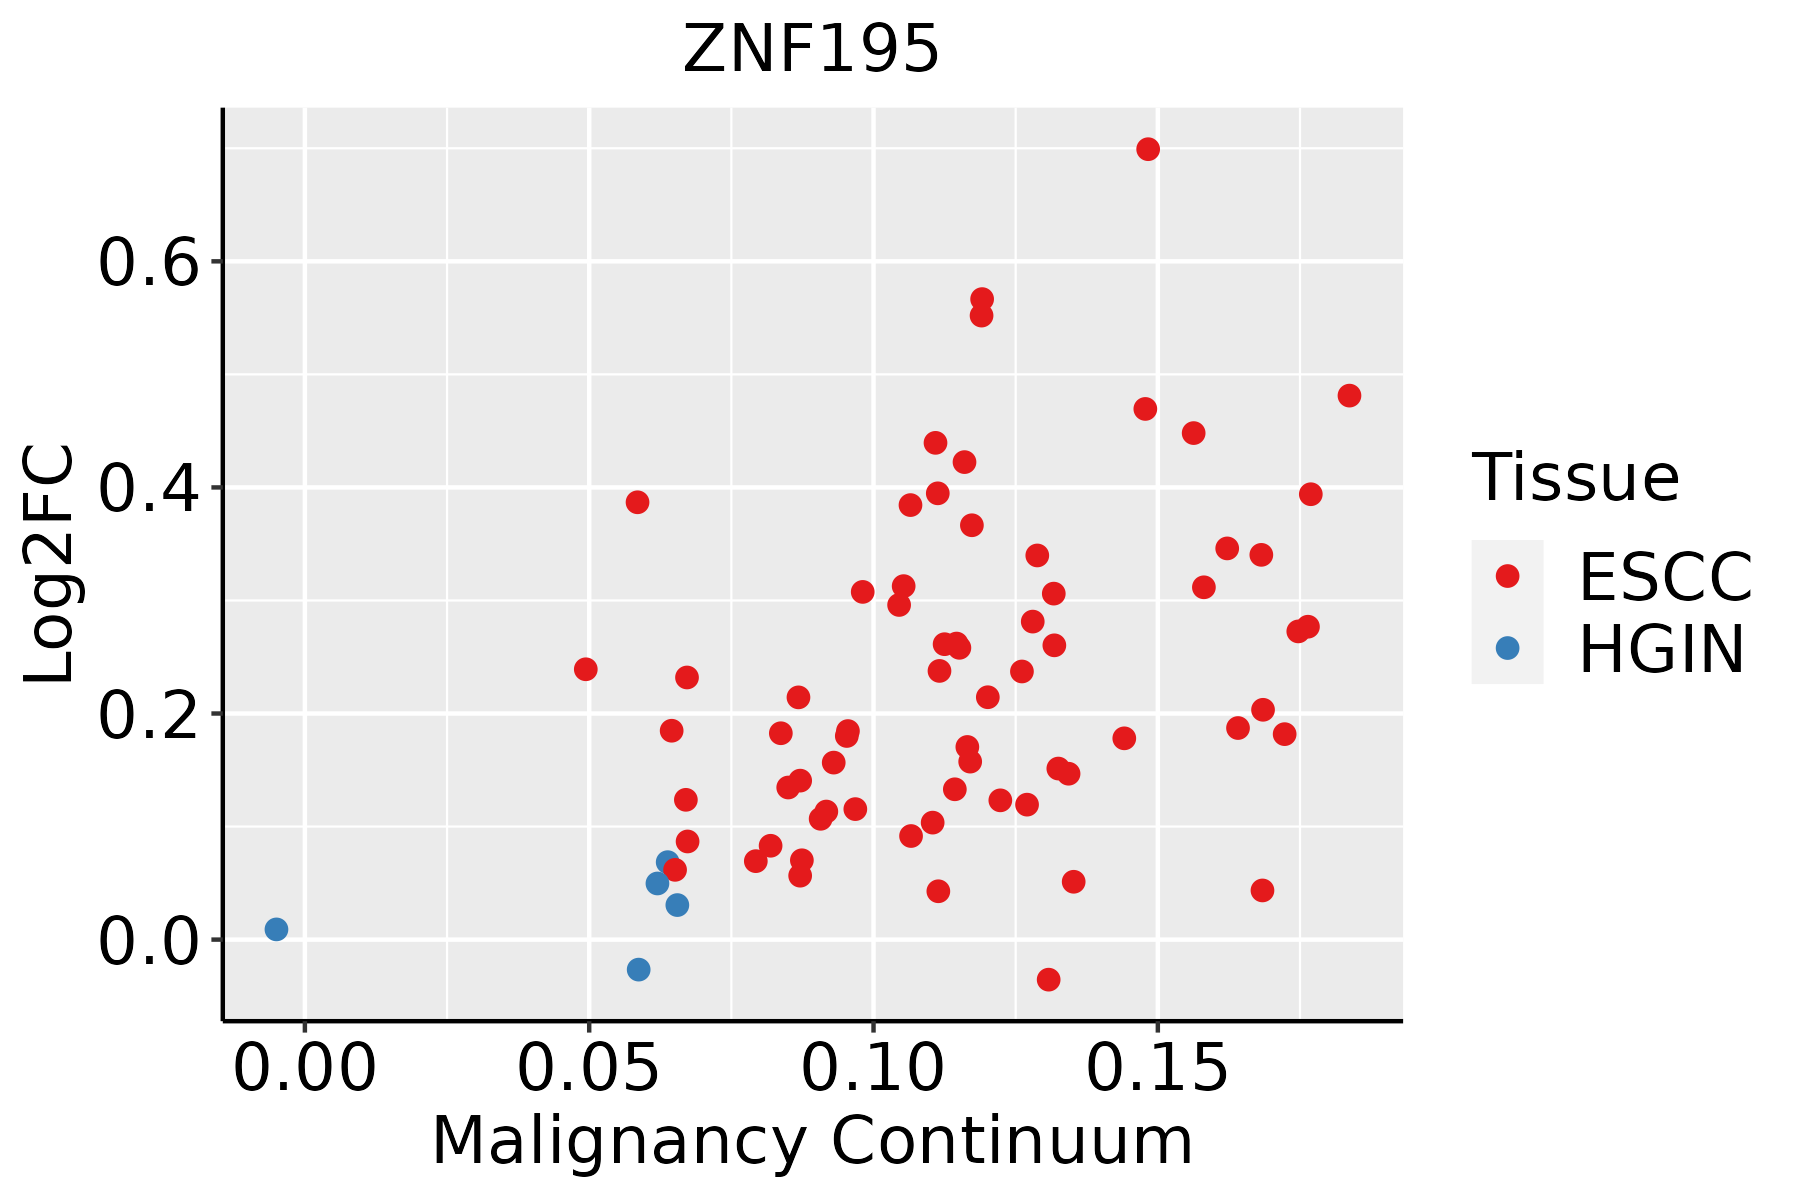 | ESCC: Esophageal squamous cell carcinoma |
| HGIN: High-grade intraepithelial neoplasias | ||
| LGIN: Low-grade intraepithelial neoplasias | ||
| Liver | 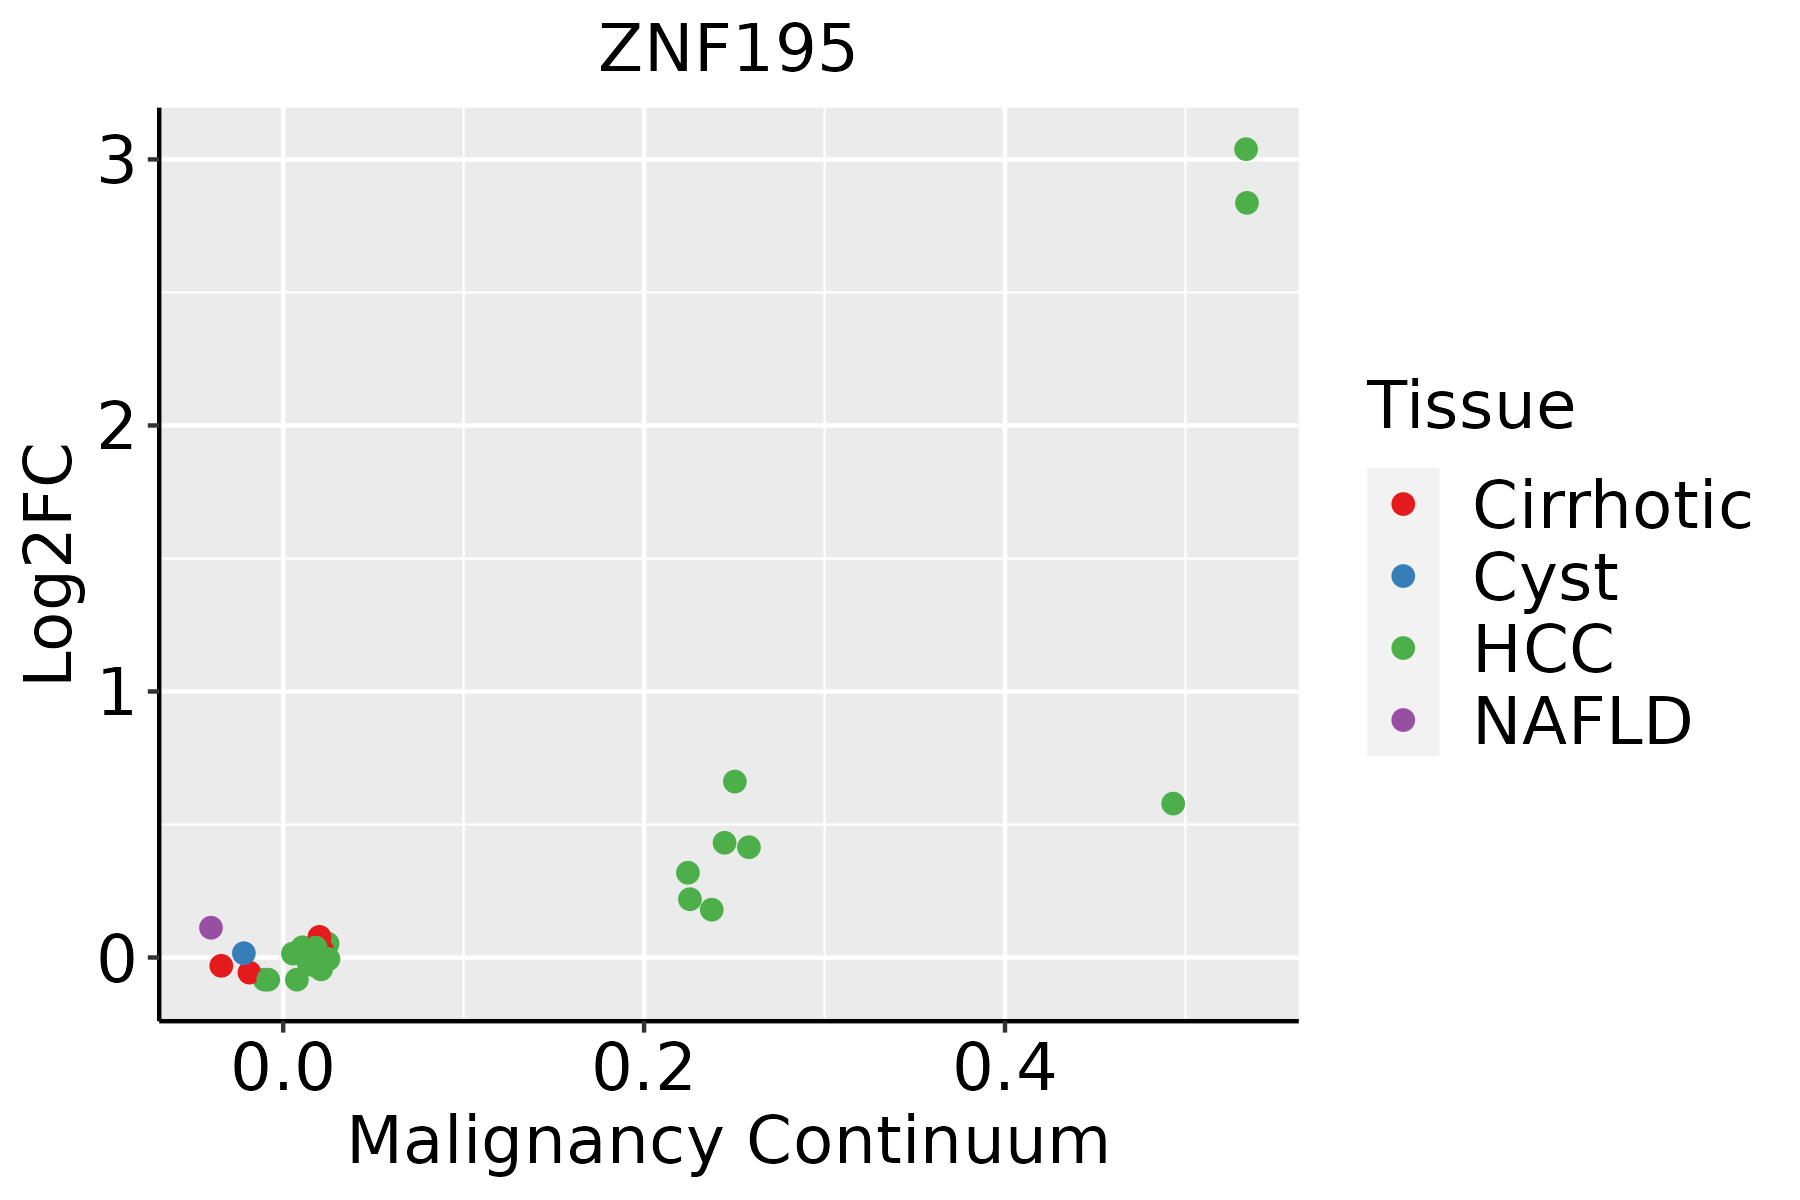 | HCC: Hepatocellular carcinoma |
| NAFLD: Non-alcoholic fatty liver disease |
| ∗log2FC in expression of this searched gene in stem-like cells from each diseased tissue sample relative to stem-like cells in normal samples in each tissue plotted against the malignancy continuum. Samples are colored based on if they are from different disease stage. |
Top |
Malignant transformation related pathway analysis |
| Find out the enriched GO biological processes and KEGG pathways involved in transition from healthy to precancer to cancer |
| Tissue | Disease Stage | Enriched GO biological Processes |
| Colorectum | AD |  |
| Colorectum | SER |  |
| Colorectum | MSS |  |
| Colorectum | MSI-H |  |
| Colorectum | FAP |  |
| ∗Top 15 enriched GO BP terms are showed in the bar plot of each disease state in each tissue. Each row represents a significant GO biological process which is colored according to the -log10(p.adjust). |
| Page: 1 2 3 4 5 6 7 8 9 |
| GO ID | Tissue | Disease Stage | Description | Gene Ratio | Bg Ratio | pvalue | p.adjust | Count |
| Page: 1 |
| Pathway ID | Tissue | Disease Stage | Description | Gene Ratio | Bg Ratio | pvalue | p.adjust | qvalue | Count |
| Page: 1 |
Top |
Cell-cell communication analysis |
| Identification of potential cell-cell interactions between two cell types and their ligand-receptor pairs for different disease states |
| Ligand | Receptor | LRpair | Pathway | Tissue | Disease Stage |
| Page: 1 |
Top |
Single-cell gene regulatory network inference analysis |
| Find out the significant the regulons (TFs) and the target genes of each regulon across cell types for different disease states |
| TF | Cell Type | Tissue | Disease Stage | Target Gene | RSS | Regulon Activity |
| ZNF195 | CD8TEX | Breast | DCIS | POLA1,PITPNA-AS1,UACA, etc. | 1.33e-02 |  |
| ZNF195 | BN | Breast | Healthy | POLA1,PITPNA-AS1,UACA, etc. | 3.09e-02 |  |
| ZNF195 | MYOFIB | Colorectum | ADJ | NIPA2,TMEM116,IL6R, etc. | 3.31e-01 |  |
| ZNF195 | GLIA | Colorectum | ADJ | NIPA2,TMEM116,IL6R, etc. | 6.45e-02 | |
| ZNF195 | MYOFIB | Colorectum | CRC | NIPA2,TMEM116,IL6R, etc. | 4.79e-02 |  |
| ZNF195 | ICAF | Colorectum | FAP | NIPA2,TMEM116,IL6R, etc. | 2.15e-02 |  |
| ZNF195 | PCV | Colorectum | Healthy | NIPA2,TMEM116,IL6R, etc. | 1.92e-03 |  |
| ZNF195 | MYOFIB | Colorectum | MSI-H | NIPA2,TMEM116,IL6R, etc. | 4.52e-01 |  |
| ZNF195 | MYOFIB | Colorectum | SER | NIPA2,TMEM116,IL6R, etc. | 2.55e-01 |  |
| ZNF195 | CD8TRM | Prostate | Healthy | GNLY,CTSW,PRF1, etc. | 3.35e-02 |  |
| ∗The dot plots of a searched regulon are shown for all cell subpopulations in each disease state of each tissue based on the regulon specific score inferred using pySCENIC and by calculating the average expression. |
| Page: 1 2 |
Top |
Somatic mutation of malignant transformation related genes |
| Annotation of somatic variants for genes involved in malignant transformation |
| Hugo Symbol | Variant Class | Variant Classification | dbSNP RS | HGVSc | HGVSp | HGVSp Short | SWISSPROT | BIOTYPE | SIFT | PolyPhen | Tumor Sample Barcode | Tissue | Histology | Sex | Age | Stage | Therapy Types | Drugs | Outcome |
| ZNF195 | SNV | Missense_Mutation | c.1237G>A | p.Glu413Lys | p.E413K | O14628 | protein_coding | tolerated(0.1) | possibly_damaging(0.663) | TCGA-AC-A23H-01 | Breast | breast invasive carcinoma | Female | >=65 | I/II | Unknown | Unknown | PD | |
| ZNF195 | deletion | Frame_Shift_Del | novel | c.1312delN | p.Tyr438ThrfsTer184 | p.Y438Tfs*184 | O14628 | protein_coding | TCGA-D8-A27V-01 | Breast | breast invasive carcinoma | Female | <65 | I/II | Hormone Therapy | tamoxiphen | SD | ||
| ZNF195 | SNV | Missense_Mutation | c.712A>C | p.Asn238His | p.N238H | O14628 | protein_coding | tolerated(1) | benign(0) | TCGA-DS-A1OB-01 | Cervix | cervical & endocervical cancer | Female | <65 | I/II | Chemotherapy | carboplatin | PD | |
| ZNF195 | SNV | Missense_Mutation | novel | c.710G>T | p.Ser237Ile | p.S237I | O14628 | protein_coding | tolerated(0.54) | benign(0.022) | TCGA-DS-A1OB-01 | Cervix | cervical & endocervical cancer | Female | <65 | I/II | Chemotherapy | carboplatin | PD |
| ZNF195 | SNV | Missense_Mutation | c.698N>C | p.Arg233Thr | p.R233T | O14628 | protein_coding | tolerated(0.2) | probably_damaging(0.966) | TCGA-IR-A3LK-01 | Cervix | cervical & endocervical cancer | Female | >=65 | I/II | Chemotherapy | cisplatin | PD | |
| ZNF195 | SNV | Missense_Mutation | novel | c.1040A>G | p.His347Arg | p.H347R | O14628 | protein_coding | tolerated(1) | benign(0) | TCGA-A6-6781-01 | Colorectum | colon adenocarcinoma | Male | <65 | III/IV | Chemotherapy | oxaliplatin | SD |
| ZNF195 | SNV | Missense_Mutation | rs775701149 | c.1204A>G | p.Arg402Gly | p.R402G | O14628 | protein_coding | tolerated(0.2) | benign(0.006) | TCGA-AA-A00N-01 | Colorectum | colon adenocarcinoma | Male | >=65 | I/II | Unknown | Unknown | PD |
| ZNF195 | SNV | Missense_Mutation | c.155N>C | p.Leu52Pro | p.L52P | O14628 | protein_coding | deleterious(0.05) | possibly_damaging(0.766) | TCGA-AD-A5EJ-01 | Colorectum | colon adenocarcinoma | Female | >=65 | I/II | Unknown | Unknown | SD | |
| ZNF195 | SNV | Missense_Mutation | rs748909798 | c.598N>T | p.Asp200Tyr | p.D200Y | O14628 | protein_coding | tolerated(0.15) | probably_damaging(0.99) | TCGA-CA-6717-01 | Colorectum | colon adenocarcinoma | Male | <65 | I/II | Chemotherapy | oxaliplatin | CR |
| ZNF195 | SNV | Missense_Mutation | rs559329436 | c.1484N>T | p.Thr495Met | p.T495M | O14628 | protein_coding | deleterious(0) | probably_damaging(0.917) | TCGA-AG-A02N-01 | Colorectum | rectum adenocarcinoma | Male | >=65 | I/II | Chemotherapy | folinic | CR |
| Page: 1 2 3 4 5 6 7 8 |
Top |
Related drugs of malignant transformation related genes |
| Identification of chemicals and drugs interact with genes involved in malignant transfromation |
| (DGIdb 4.0) |
| Entrez ID | Symbol | Category | Interaction Types | Drug Claim Name | Drug Name | PMIDs |
| Page: 1 |

Copyright 2023-Present -The University of Texas Health Science Center at Houston |