
|
|||||
|
 | |
| |
| |
| |
| |
| |
|
Gene: ZNF185 |
Gene summary for ZNF185 |
| Gene information | Species | Human | Gene symbol | ZNF185 | Gene ID | 7739 |
| Gene name | zinc finger protein 185 with LIM domain | |
| Gene Alias | SCELL | |
| Cytomap | Xq28 | |
| Gene Type | protein-coding | GO ID | GO:0005575 | UniProtAcc | B3KPM4 |
Top |
Malignant transformation analysis |
| Identification of the aberrant gene expression in precancerous and cancerous lesions by comparing the gene expression of stem-like cells in diseased tissues with normal stem cells |
| Entrez ID | Symbol | Replicates | Species | Organ | Tissue | Adj P-value | Log2FC | Malignancy |
| 7739 | ZNF185 | C04 | Human | Oral cavity | OSCC | 5.08e-07 | 3.98e-01 | 0.2633 |
| 7739 | ZNF185 | C21 | Human | Oral cavity | OSCC | 1.56e-39 | 1.22e+00 | 0.2678 |
| 7739 | ZNF185 | C30 | Human | Oral cavity | OSCC | 1.77e-16 | 7.75e-01 | 0.3055 |
| 7739 | ZNF185 | C43 | Human | Oral cavity | OSCC | 7.81e-17 | 4.10e-01 | 0.1704 |
| 7739 | ZNF185 | C46 | Human | Oral cavity | OSCC | 3.60e-12 | 2.77e-01 | 0.1673 |
| 7739 | ZNF185 | C51 | Human | Oral cavity | OSCC | 4.86e-14 | 5.45e-01 | 0.2674 |
| 7739 | ZNF185 | C57 | Human | Oral cavity | OSCC | 9.77e-28 | 9.34e-01 | 0.1679 |
| 7739 | ZNF185 | C08 | Human | Oral cavity | OSCC | 1.69e-02 | 1.52e-01 | 0.1919 |
| 7739 | ZNF185 | C09 | Human | Oral cavity | OSCC | 1.74e-04 | 1.17e-01 | 0.1431 |
| 7739 | ZNF185 | SYSMH1 | Human | Oral cavity | OSCC | 4.27e-07 | 2.51e-01 | 0.1127 |
| 7739 | ZNF185 | SYSMH3 | Human | Oral cavity | OSCC | 2.09e-11 | 2.77e-01 | 0.2442 |
| 7739 | ZNF185 | SYSMH4 | Human | Oral cavity | OSCC | 2.38e-02 | 1.38e-01 | 0.1226 |
| 7739 | ZNF185 | SYSMH5 | Human | Oral cavity | OSCC | 2.21e-07 | 1.95e-01 | 0.0647 |
| Page: 1 |
| Tissue | Expression Dynamics | Abbreviation |
| Oral Cavity | 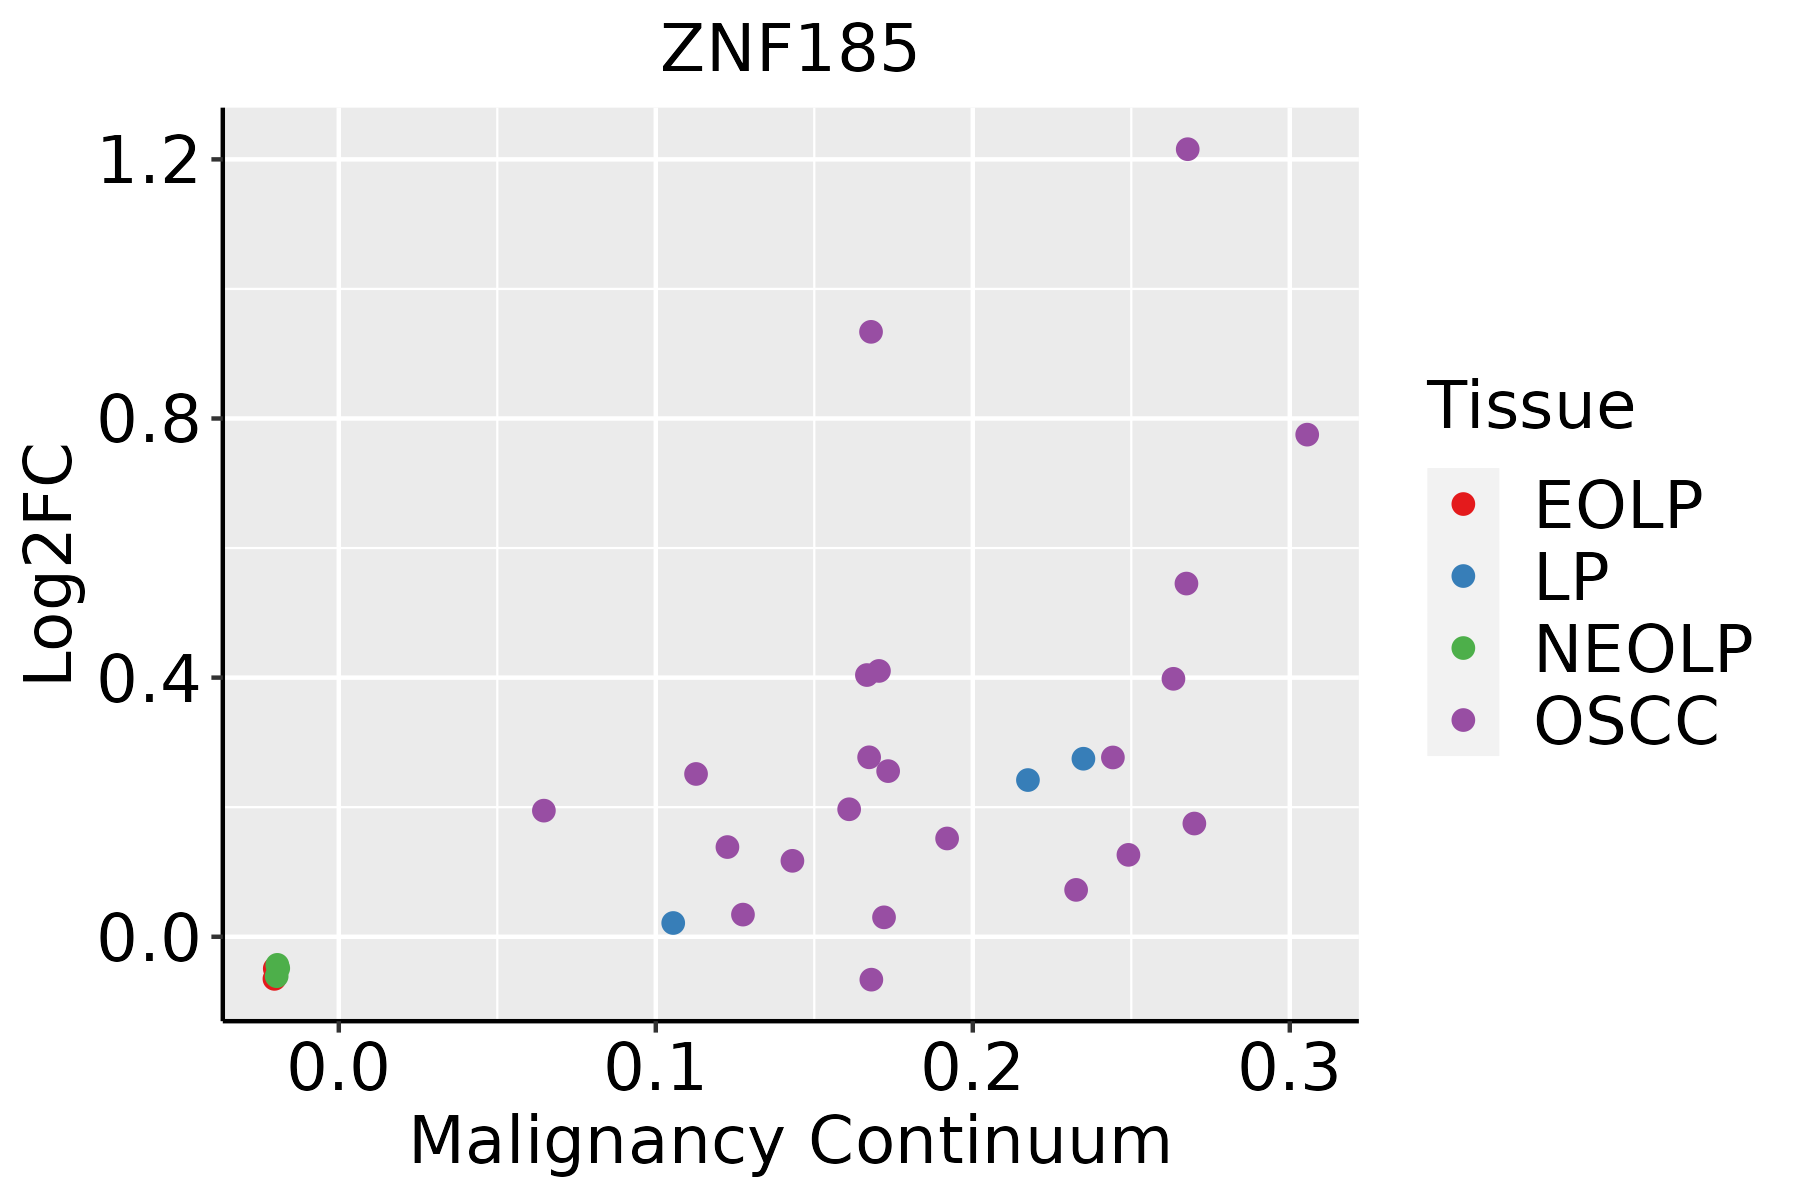 | EOLP: Erosive Oral lichen planus |
| LP: leukoplakia | ||
| NEOLP: Non-erosive oral lichen planus | ||
| OSCC: Oral squamous cell carcinoma |
| ∗log2FC in expression of this searched gene in stem-like cells from each diseased tissue sample relative to stem-like cells in normal samples in each tissue plotted against the malignancy continuum. Samples are colored based on if they are from different disease stage. |
Top |
Malignant transformation related pathway analysis |
| Find out the enriched GO biological processes and KEGG pathways involved in transition from healthy to precancer to cancer |
| Tissue | Disease Stage | Enriched GO biological Processes |
| Colorectum | AD |  |
| Colorectum | SER |  |
| Colorectum | MSS |  |
| Colorectum | MSI-H |  |
| Colorectum | FAP |  |
| ∗Top 15 enriched GO BP terms are showed in the bar plot of each disease state in each tissue. Each row represents a significant GO biological process which is colored according to the -log10(p.adjust). |
| Page: 1 2 3 4 5 6 7 8 9 |
| GO ID | Tissue | Disease Stage | Description | Gene Ratio | Bg Ratio | pvalue | p.adjust | Count |
| Page: 1 |
| Pathway ID | Tissue | Disease Stage | Description | Gene Ratio | Bg Ratio | pvalue | p.adjust | qvalue | Count |
| Page: 1 |
Top |
Cell-cell communication analysis |
| Identification of potential cell-cell interactions between two cell types and their ligand-receptor pairs for different disease states |
| Ligand | Receptor | LRpair | Pathway | Tissue | Disease Stage |
| Page: 1 |
Top |
Single-cell gene regulatory network inference analysis |
| Find out the significant the regulons (TFs) and the target genes of each regulon across cell types for different disease states |
| TF | Cell Type | Tissue | Disease Stage | Target Gene | RSS | Regulon Activity |
| ∗The dot plots of a searched regulon are shown for all cell subpopulations in each disease state of each tissue based on the regulon specific score inferred using pySCENIC and by calculating the average expression. |
| Page: 1 |
Top |
Somatic mutation of malignant transformation related genes |
| Annotation of somatic variants for genes involved in malignant transformation |
| Hugo Symbol | Variant Class | Variant Classification | dbSNP RS | HGVSc | HGVSp | HGVSp Short | SWISSPROT | BIOTYPE | SIFT | PolyPhen | Tumor Sample Barcode | Tissue | Histology | Sex | Age | Stage | Therapy Types | Drugs | Outcome |
| ZNF185 | SNV | Missense_Mutation | c.1115N>T | p.Gly372Val | p.G372V | O15231 | protein_coding | deleterious(0.01) | possibly_damaging(0.79) | TCGA-AC-A23H-01 | Breast | breast invasive carcinoma | Female | >=65 | I/II | Unknown | Unknown | PD | |
| ZNF185 | SNV | Missense_Mutation | c.1745N>T | p.Ala582Val | p.A582V | O15231 | protein_coding | tolerated(0.08) | benign(0.046) | TCGA-AN-A0AK-01 | Breast | breast invasive carcinoma | Female | >=65 | I/II | Unknown | Unknown | SD | |
| ZNF185 | SNV | Missense_Mutation | novel | c.1962N>T | p.Glu654Asp | p.E654D | O15231 | protein_coding | tolerated(0.09) | benign(0.1) | TCGA-E2-A9RU-01 | Breast | breast invasive carcinoma | Female | >=65 | III/IV | Hormone Therapy | arimidex | SD |
| ZNF185 | SNV | Missense_Mutation | c.637N>A | p.Pro213Thr | p.P213T | O15231 | protein_coding | deleterious(0.01) | probably_damaging(0.93) | TCGA-EW-A1OV-01 | Breast | breast invasive carcinoma | Female | <65 | I/II | Chemotherapy | epirubicin | SD | |
| ZNF185 | SNV | Missense_Mutation | novel | c.65G>A | p.Arg22His | p.R22H | O15231 | protein_coding | deleterious(0) | probably_damaging(0.999) | TCGA-PL-A8LV-01 | Breast | breast invasive carcinoma | Female | <65 | III/IV | Unknown | Unknown | SD |
| ZNF185 | SNV | Missense_Mutation | novel | c.1392N>C | p.Gln464His | p.Q464H | O15231 | protein_coding | tolerated(0.35) | benign(0.01) | TCGA-2W-A8YY-01 | Cervix | cervical & endocervical cancer | Female | <65 | I/II | Chemotherapy | cisplatin | CR |
| ZNF185 | SNV | Missense_Mutation | novel | c.1898N>A | p.Ser633Asn | p.S633N | O15231 | protein_coding | tolerated(0.16) | possibly_damaging(0.543) | TCGA-C5-A1BE-01 | Cervix | cervical & endocervical cancer | Female | <65 | I/II | Chemotherapy | cisplatin | PD |
| ZNF185 | SNV | Missense_Mutation | novel | c.1382N>T | p.Arg461Ile | p.R461I | O15231 | protein_coding | tolerated(0.05) | benign(0.26) | TCGA-C5-A2LT-01 | Cervix | cervical & endocervical cancer | Female | <65 | I/II | Chemotherapy | cisplatin | SD |
| ZNF185 | SNV | Missense_Mutation | c.1253G>T | p.Arg418Met | p.R418M | O15231 | protein_coding | deleterious(0.04) | possibly_damaging(0.742) | TCGA-UC-A7PF-01 | Cervix | cervical & endocervical cancer | Female | <65 | I/II | Unknown | Unknown | SD | |
| ZNF185 | SNV | Missense_Mutation | c.1064N>T | p.Thr355Met | p.T355M | O15231 | protein_coding | tolerated(0.44) | benign(0.009) | TCGA-5M-AAT6-01 | Colorectum | colon adenocarcinoma | Female | <65 | III/IV | Unknown | Unknown | PD |
| Page: 1 2 3 4 5 6 7 |
Top |
Related drugs of malignant transformation related genes |
| Identification of chemicals and drugs interact with genes involved in malignant transfromation |
| (DGIdb 4.0) |
| Entrez ID | Symbol | Category | Interaction Types | Drug Claim Name | Drug Name | PMIDs |
| Page: 1 |

Copyright 2023-Present -The University of Texas Health Science Center at Houston |