
|
|||||
|
 | |
| |
| |
| |
| |
| |
|
Gene: ZNF160 |
Gene summary for ZNF160 |
| Gene information | Species | Human | Gene symbol | ZNF160 | Gene ID | 90338 |
| Gene name | zinc finger protein 160 | |
| Gene Alias | F11 | |
| Cytomap | 19q13.41-q13.42 | |
| Gene Type | protein-coding | GO ID | GO:0002376 | UniProtAcc | A0A024R4Q2 |
Top |
Malignant transformation analysis |
| Identification of the aberrant gene expression in precancerous and cancerous lesions by comparing the gene expression of stem-like cells in diseased tissues with normal stem cells |
| Entrez ID | Symbol | Replicates | Species | Organ | Tissue | Adj P-value | Log2FC | Malignancy |
| 90338 | ZNF160 | LZE20T | Human | Esophagus | ESCC | 1.11e-02 | 1.86e-01 | 0.0662 |
| 90338 | ZNF160 | LZE22T | Human | Esophagus | ESCC | 6.04e-04 | 2.36e-01 | 0.068 |
| 90338 | ZNF160 | LZE24T | Human | Esophagus | ESCC | 2.82e-06 | 1.13e-01 | 0.0596 |
| 90338 | ZNF160 | LZE6T | Human | Esophagus | ESCC | 6.74e-03 | 1.91e-01 | 0.0845 |
| 90338 | ZNF160 | P1T-E | Human | Esophagus | ESCC | 3.10e-09 | 2.69e-01 | 0.0875 |
| 90338 | ZNF160 | P2T-E | Human | Esophagus | ESCC | 8.04e-13 | 2.40e-01 | 0.1177 |
| 90338 | ZNF160 | P4T-E | Human | Esophagus | ESCC | 8.69e-06 | 1.19e-01 | 0.1323 |
| 90338 | ZNF160 | P5T-E | Human | Esophagus | ESCC | 9.81e-12 | 2.08e-01 | 0.1327 |
| 90338 | ZNF160 | P8T-E | Human | Esophagus | ESCC | 6.25e-27 | 4.83e-01 | 0.0889 |
| 90338 | ZNF160 | P10T-E | Human | Esophagus | ESCC | 4.36e-39 | 7.24e-01 | 0.116 |
| 90338 | ZNF160 | P11T-E | Human | Esophagus | ESCC | 9.17e-11 | 3.71e-01 | 0.1426 |
| 90338 | ZNF160 | P12T-E | Human | Esophagus | ESCC | 2.38e-19 | 4.09e-01 | 0.1122 |
| 90338 | ZNF160 | P15T-E | Human | Esophagus | ESCC | 1.82e-22 | 5.52e-01 | 0.1149 |
| 90338 | ZNF160 | P16T-E | Human | Esophagus | ESCC | 3.76e-13 | 2.38e-01 | 0.1153 |
| 90338 | ZNF160 | P17T-E | Human | Esophagus | ESCC | 2.54e-02 | 1.78e-01 | 0.1278 |
| 90338 | ZNF160 | P21T-E | Human | Esophagus | ESCC | 1.42e-09 | 1.75e-01 | 0.1617 |
| 90338 | ZNF160 | P22T-E | Human | Esophagus | ESCC | 3.97e-24 | 3.06e-01 | 0.1236 |
| 90338 | ZNF160 | P24T-E | Human | Esophagus | ESCC | 5.21e-04 | 1.45e-01 | 0.1287 |
| 90338 | ZNF160 | P26T-E | Human | Esophagus | ESCC | 5.48e-31 | 4.98e-01 | 0.1276 |
| 90338 | ZNF160 | P27T-E | Human | Esophagus | ESCC | 2.84e-24 | 4.34e-01 | 0.1055 |
| Page: 1 2 3 4 |
| Tissue | Expression Dynamics | Abbreviation |
| Esophagus | 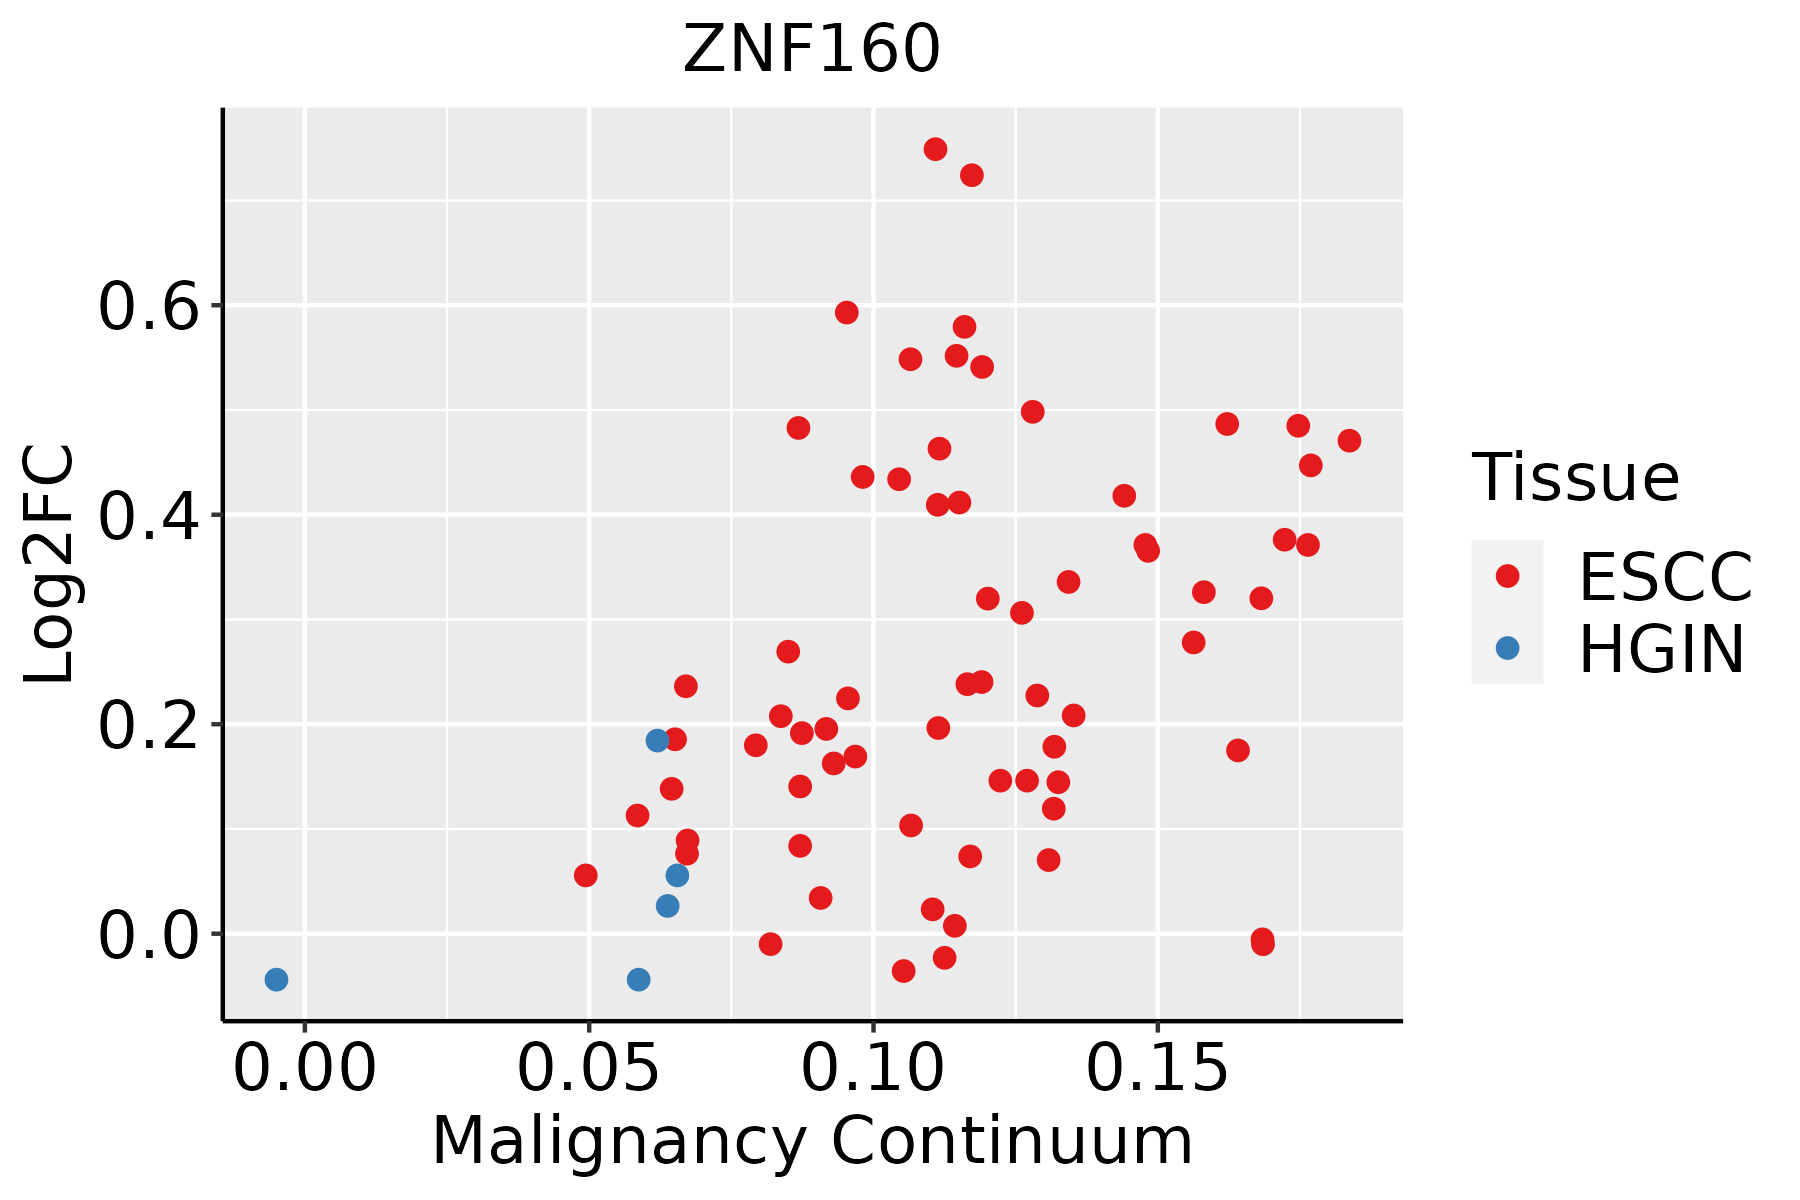 | ESCC: Esophageal squamous cell carcinoma |
| HGIN: High-grade intraepithelial neoplasias | ||
| LGIN: Low-grade intraepithelial neoplasias | ||
| Liver | 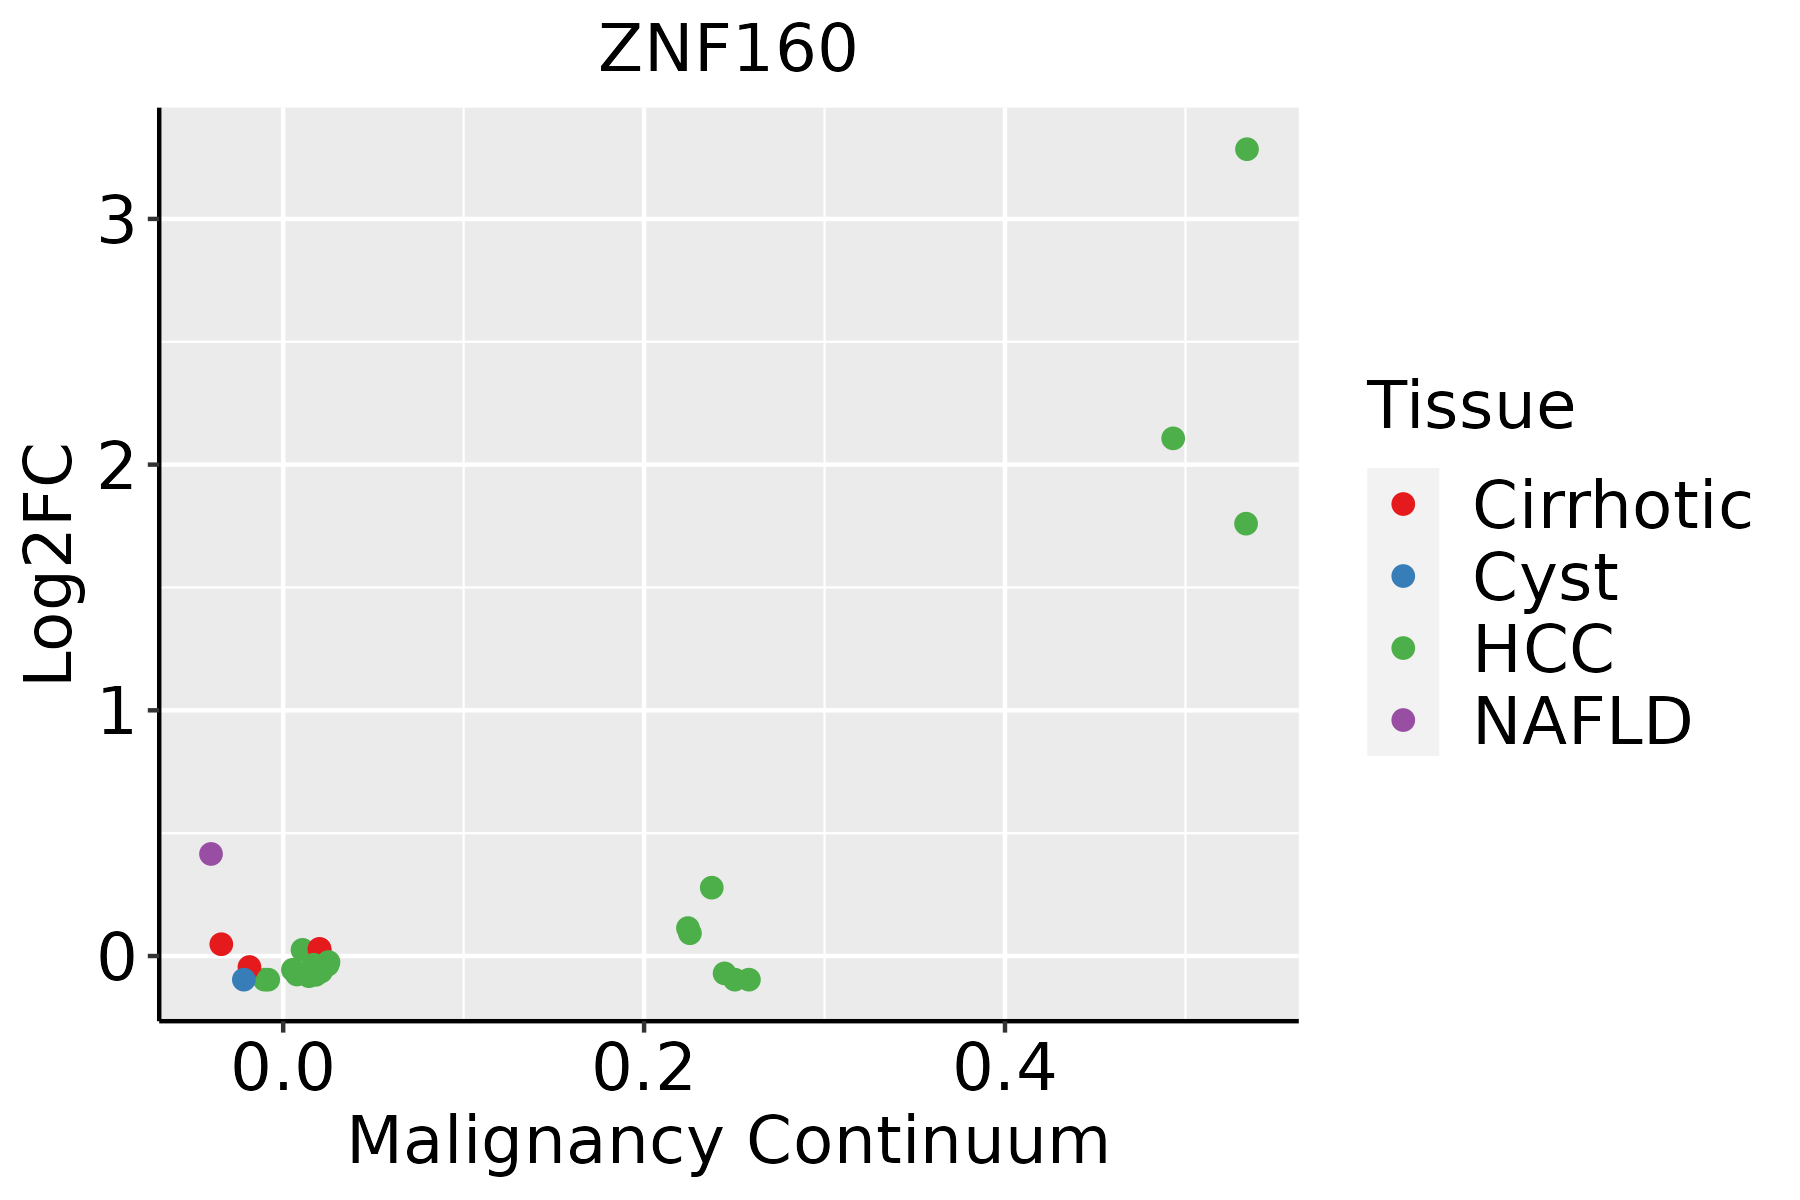 | HCC: Hepatocellular carcinoma |
| NAFLD: Non-alcoholic fatty liver disease | ||
| Lung | 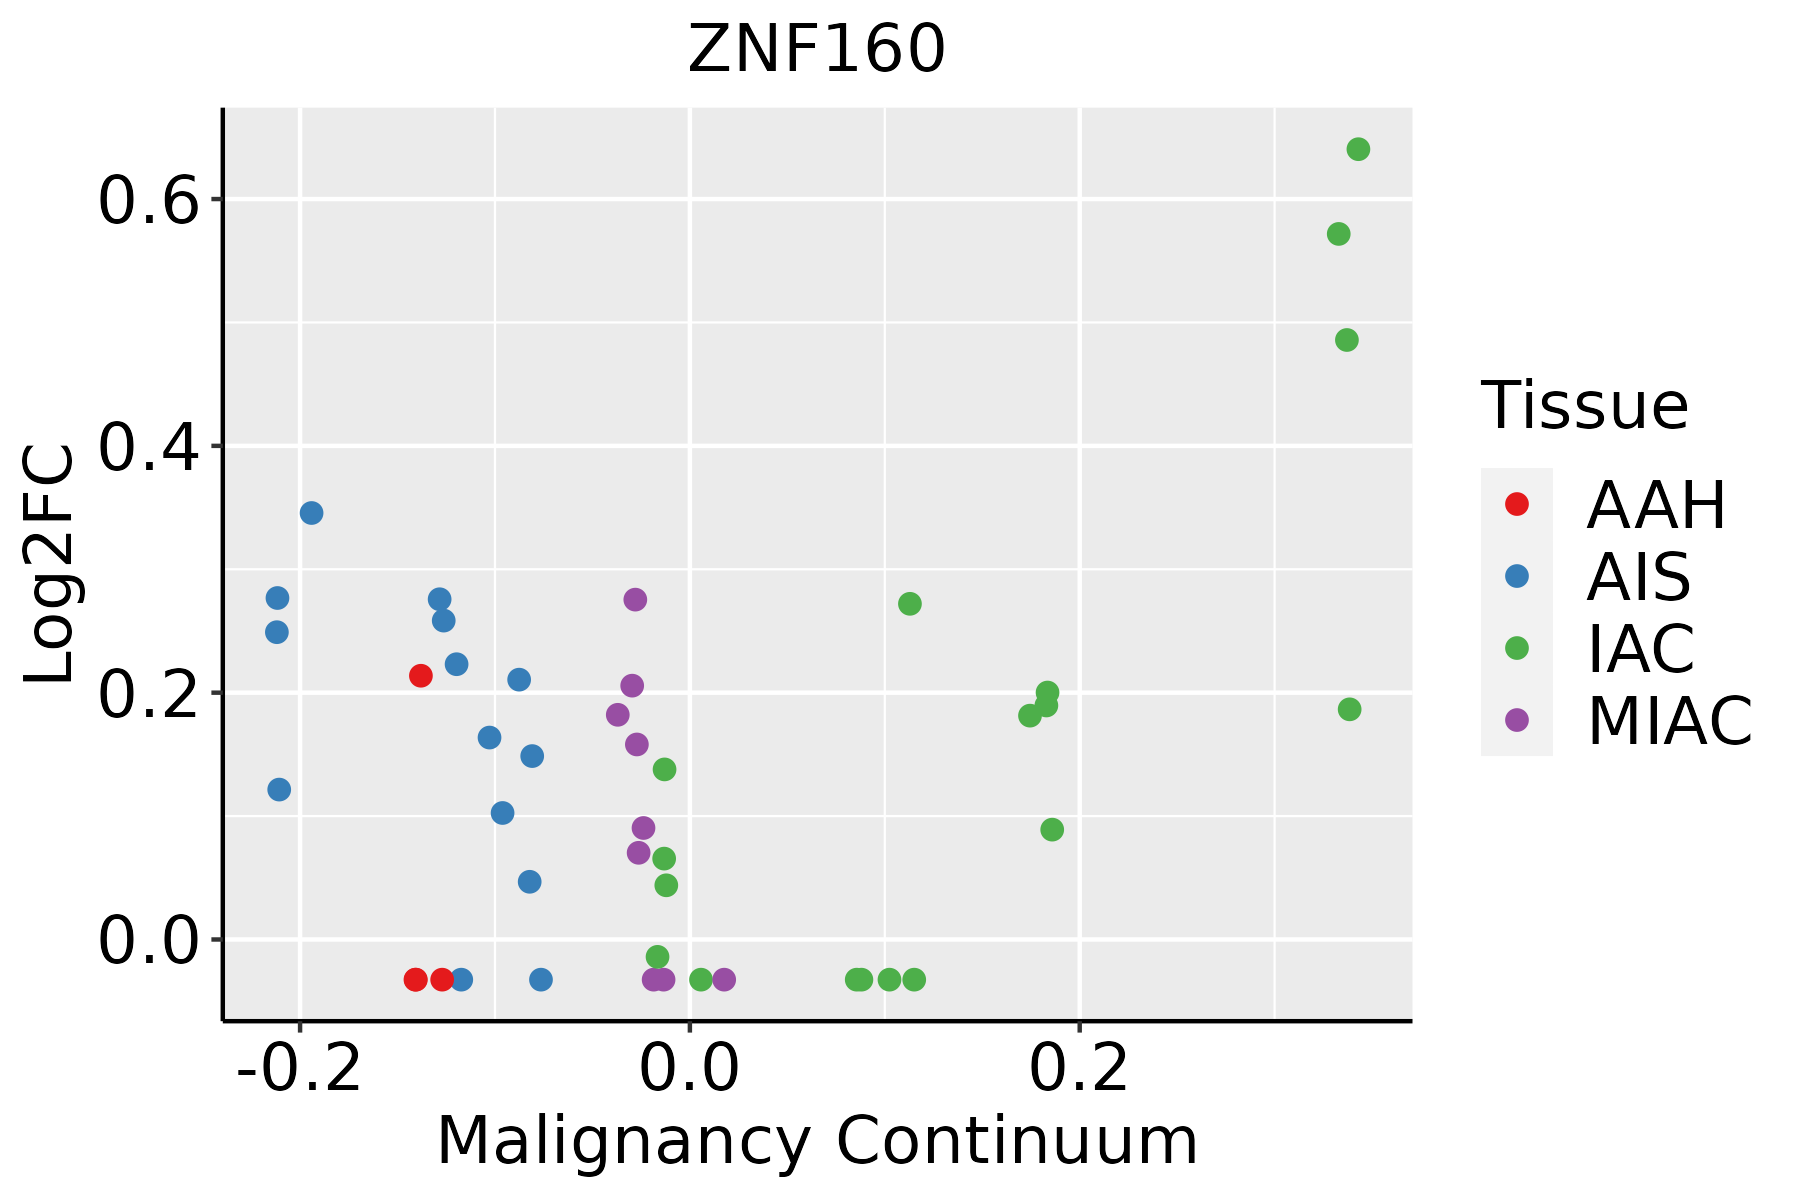 | AAH: Atypical adenomatous hyperplasia |
| AIS: Adenocarcinoma in situ | ||
| IAC: Invasive lung adenocarcinoma | ||
| MIA: Minimally invasive adenocarcinoma | ||
| Thyroid | 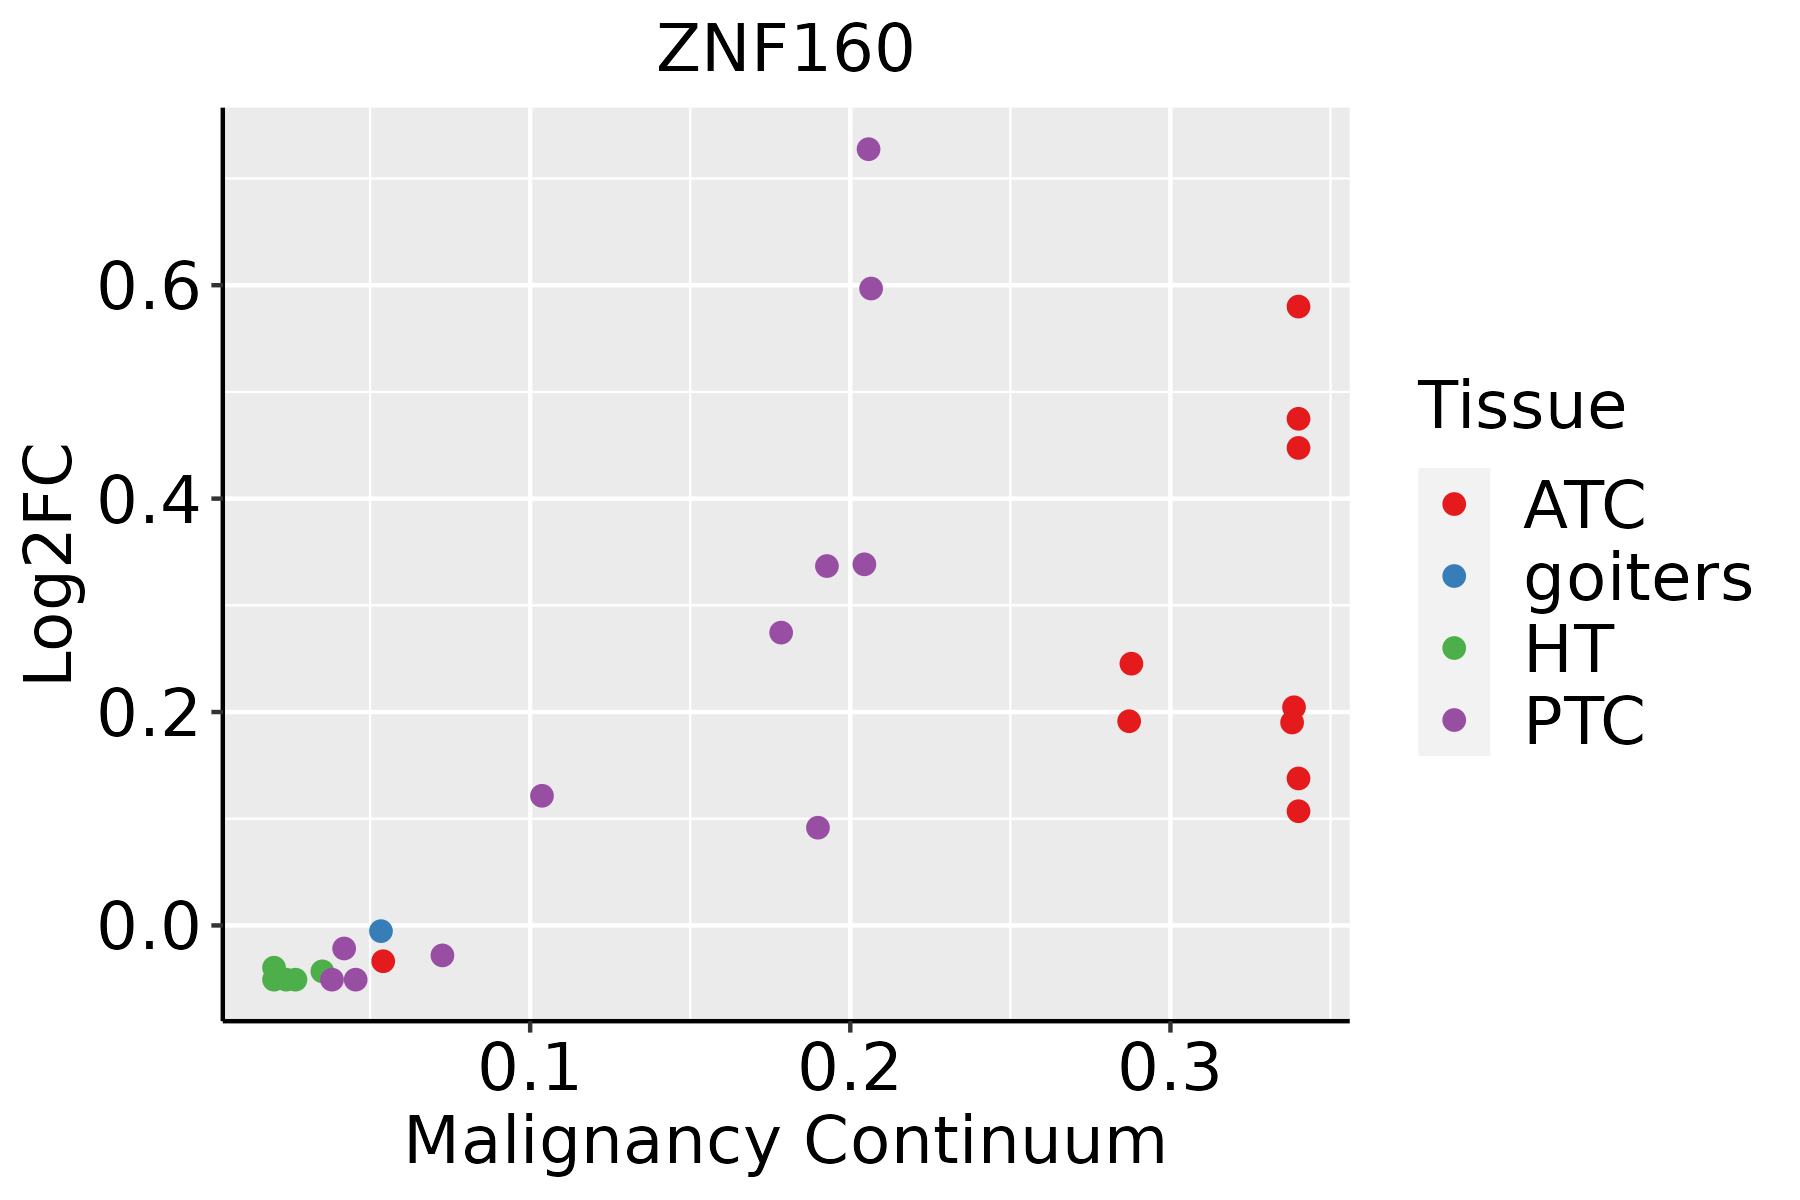 | ATC: Anaplastic thyroid cancer |
| HT: Hashimoto's thyroiditis | ||
| PTC: Papillary thyroid cancer |
| ∗log2FC in expression of this searched gene in stem-like cells from each diseased tissue sample relative to stem-like cells in normal samples in each tissue plotted against the malignancy continuum. Samples are colored based on if they are from different disease stage. |
Top |
Malignant transformation related pathway analysis |
| Find out the enriched GO biological processes and KEGG pathways involved in transition from healthy to precancer to cancer |
| Tissue | Disease Stage | Enriched GO biological Processes |
| Colorectum | AD |  |
| Colorectum | SER |  |
| Colorectum | MSS |  |
| Colorectum | MSI-H |  |
| Colorectum | FAP |  |
| ∗Top 15 enriched GO BP terms are showed in the bar plot of each disease state in each tissue. Each row represents a significant GO biological process which is colored according to the -log10(p.adjust). |
| Page: 1 2 3 4 5 6 7 8 9 |
| GO ID | Tissue | Disease Stage | Description | Gene Ratio | Bg Ratio | pvalue | p.adjust | Count |
| Page: 1 |
| Pathway ID | Tissue | Disease Stage | Description | Gene Ratio | Bg Ratio | pvalue | p.adjust | qvalue | Count |
| Page: 1 |
Top |
Cell-cell communication analysis |
| Identification of potential cell-cell interactions between two cell types and their ligand-receptor pairs for different disease states |
| Ligand | Receptor | LRpair | Pathway | Tissue | Disease Stage |
| Page: 1 |
Top |
Single-cell gene regulatory network inference analysis |
| Find out the significant the regulons (TFs) and the target genes of each regulon across cell types for different disease states |
| TF | Cell Type | Tissue | Disease Stage | Target Gene | RSS | Regulon Activity |
| ZNF160 | PERI | Cervix | ADJ | VCAM1,PHYH,DCTN1, etc. | 2.49e-01 |  |
| ZNF160 | PERI | Cervix | HSIL_HPV | VCAM1,PHYH,DCTN1, etc. | 4.17e-02 |  |
| ZNF160 | SURF | Endometrium | ADJ | AQP1,POLM,TBCEL, etc. | 0.00e+00 |  |
| ZNF160 | BAS | Endometrium | ADJ | AQP1,POLM,TBCEL, etc. | 7.59e-03 | |
| ZNF160 | BAS | Endometrium | EEC | AQP1,POLM,TBCEL, etc. | -4.44e-16 |  |
| ZNF160 | cDC | Lung | AIS | CXCR6,PHLPP1,NPM3, etc. | 2.77e-02 |  |
| ZNF160 | NK | Lung | MIAC | AC104078.2,SCLY,PLCL2, etc. | 9.00e-02 |  |
| ∗The dot plots of a searched regulon are shown for all cell subpopulations in each disease state of each tissue based on the regulon specific score inferred using pySCENIC and by calculating the average expression. |
| Page: 1 |
Top |
Somatic mutation of malignant transformation related genes |
| Annotation of somatic variants for genes involved in malignant transformation |
| Hugo Symbol | Variant Class | Variant Classification | dbSNP RS | HGVSc | HGVSp | HGVSp Short | SWISSPROT | BIOTYPE | SIFT | PolyPhen | Tumor Sample Barcode | Tissue | Histology | Sex | Age | Stage | Therapy Types | Drugs | Outcome |
| ZNF160 | SNV | Missense_Mutation | c.2209N>A | p.Glu737Lys | p.E737K | Q9HCG1 | protein_coding | tolerated(0.06) | possibly_damaging(0.554) | TCGA-A2-A0CW-01 | Breast | breast invasive carcinoma | Female | >=65 | I/II | Hormone Therapy | anastrozole | SD | |
| ZNF160 | SNV | Missense_Mutation | c.324N>G | p.Ser108Arg | p.S108R | Q9HCG1 | protein_coding | deleterious(0.02) | benign(0.026) | TCGA-A2-A0CW-01 | Breast | breast invasive carcinoma | Female | >=65 | I/II | Hormone Therapy | anastrozole | SD | |
| ZNF160 | SNV | Missense_Mutation | rs187006418 | c.2363N>A | p.Arg788His | p.R788H | Q9HCG1 | protein_coding | deleterious(0.03) | benign(0.012) | TCGA-A2-A0SW-01 | Breast | breast invasive carcinoma | Female | >=65 | III/IV | Hormone Therapy | arimidex | PD |
| ZNF160 | SNV | Missense_Mutation | c.477N>C | p.Gln159His | p.Q159H | Q9HCG1 | protein_coding | tolerated(1) | benign(0.005) | TCGA-A8-A0A7-01 | Breast | breast invasive carcinoma | Female | <65 | I/II | Unknown | Unknown | SD | |
| ZNF160 | SNV | Missense_Mutation | rs757419776 | c.994N>T | p.Arg332Trp | p.R332W | Q9HCG1 | protein_coding | tolerated(0.09) | benign(0.115) | TCGA-AR-A0TW-01 | Breast | breast invasive carcinoma | Female | <65 | III/IV | Chemotherapy | doxorubicin | PD |
| ZNF160 | SNV | Missense_Mutation | c.1019N>T | p.Pro340Leu | p.P340L | Q9HCG1 | protein_coding | tolerated(0.06) | benign(0.263) | TCGA-BH-A18G-01 | Breast | breast invasive carcinoma | Female | >=65 | I/II | Unknown | Unknown | SD | |
| ZNF160 | SNV | Missense_Mutation | novel | c.1873G>A | p.Glu625Lys | p.E625K | Q9HCG1 | protein_coding | deleterious(0.04) | benign(0.14) | TCGA-E2-A2P6-01 | Breast | breast invasive carcinoma | Female | >=65 | I/II | Hormone Therapy | anastrozole | SD |
| ZNF160 | SNV | Missense_Mutation | c.439G>C | p.Asp147His | p.D147H | Q9HCG1 | protein_coding | tolerated(0.05) | possibly_damaging(0.808) | TCGA-GM-A2DH-01 | Breast | breast invasive carcinoma | Female | <65 | I/II | Chemotherapy | taxol | CR | |
| ZNF160 | SNV | Missense_Mutation | novel | c.2194C>A | p.Pro732Thr | p.P732T | Q9HCG1 | protein_coding | deleterious(0.01) | probably_damaging(0.999) | TCGA-OL-A5RZ-01 | Breast | breast invasive carcinoma | Female | <65 | I/II | Chemotherapy | doxorubicin | CR |
| ZNF160 | insertion | In_Frame_Ins | novel | c.250_251insCTCTCCCTCTGTATTTAATTCCATATG | p.Cys84delinsSerLeuProLeuTyrLeuIleProTyrGly | p.C84delinsSLPLYLIPYG | Q9HCG1 | protein_coding | TCGA-A2-A0CP-01 | Breast | breast invasive carcinoma | Female | <65 | I/II | Chemotherapy | cytoxan | SD |
| Page: 1 2 3 4 5 6 7 8 9 10 |
Top |
Related drugs of malignant transformation related genes |
| Identification of chemicals and drugs interact with genes involved in malignant transfromation |
| (DGIdb 4.0) |
| Entrez ID | Symbol | Category | Interaction Types | Drug Claim Name | Drug Name | PMIDs |
| Page: 1 |

Copyright 2023-Present -The University of Texas Health Science Center at Houston |