
|
|||||
|
 | |
| |
| |
| |
| |
| |
|
Gene: ZNF16 |
Gene summary for ZNF16 |
| Gene information | Species | Human | Gene symbol | ZNF16 | Gene ID | 7564 |
| Gene name | zinc finger protein 16 | |
| Gene Alias | HZF1 | |
| Cytomap | 8q24.3 | |
| Gene Type | protein-coding | GO ID | GO:0002262 | UniProtAcc | P17020 |
Top |
Malignant transformation analysis |
| Identification of the aberrant gene expression in precancerous and cancerous lesions by comparing the gene expression of stem-like cells in diseased tissues with normal stem cells |
| Entrez ID | Symbol | Replicates | Species | Organ | Tissue | Adj P-value | Log2FC | Malignancy |
| 7564 | ZNF16 | LZE4T | Human | Esophagus | ESCC | 1.20e-04 | 1.43e-01 | 0.0811 |
| 7564 | ZNF16 | LZE20T | Human | Esophagus | ESCC | 1.26e-02 | 1.10e-01 | 0.0662 |
| 7564 | ZNF16 | LZE24T | Human | Esophagus | ESCC | 4.15e-02 | 8.22e-02 | 0.0596 |
| 7564 | ZNF16 | P2T-E | Human | Esophagus | ESCC | 1.01e-09 | 1.56e-01 | 0.1177 |
| 7564 | ZNF16 | P4T-E | Human | Esophagus | ESCC | 1.75e-05 | 1.33e-01 | 0.1323 |
| 7564 | ZNF16 | P5T-E | Human | Esophagus | ESCC | 1.38e-08 | 9.75e-02 | 0.1327 |
| 7564 | ZNF16 | P10T-E | Human | Esophagus | ESCC | 8.40e-04 | 1.15e-01 | 0.116 |
| 7564 | ZNF16 | P11T-E | Human | Esophagus | ESCC | 6.08e-06 | 2.13e-01 | 0.1426 |
| 7564 | ZNF16 | P12T-E | Human | Esophagus | ESCC | 1.76e-12 | 2.38e-01 | 0.1122 |
| 7564 | ZNF16 | P15T-E | Human | Esophagus | ESCC | 8.45e-06 | 1.43e-01 | 0.1149 |
| 7564 | ZNF16 | P16T-E | Human | Esophagus | ESCC | 1.89e-17 | 2.84e-01 | 0.1153 |
| 7564 | ZNF16 | P17T-E | Human | Esophagus | ESCC | 4.79e-04 | 1.81e-01 | 0.1278 |
| 7564 | ZNF16 | P20T-E | Human | Esophagus | ESCC | 1.66e-05 | 1.31e-01 | 0.1124 |
| 7564 | ZNF16 | P21T-E | Human | Esophagus | ESCC | 3.75e-03 | 1.07e-01 | 0.1617 |
| 7564 | ZNF16 | P22T-E | Human | Esophagus | ESCC | 3.75e-03 | 8.42e-02 | 0.1236 |
| 7564 | ZNF16 | P23T-E | Human | Esophagus | ESCC | 1.99e-08 | 2.05e-01 | 0.108 |
| 7564 | ZNF16 | P26T-E | Human | Esophagus | ESCC | 1.79e-35 | 6.49e-01 | 0.1276 |
| 7564 | ZNF16 | P27T-E | Human | Esophagus | ESCC | 9.35e-10 | 2.41e-01 | 0.1055 |
| 7564 | ZNF16 | P28T-E | Human | Esophagus | ESCC | 9.44e-07 | 1.69e-01 | 0.1149 |
| 7564 | ZNF16 | P30T-E | Human | Esophagus | ESCC | 1.89e-05 | 2.33e-01 | 0.137 |
| Page: 1 2 3 |
| Tissue | Expression Dynamics | Abbreviation |
| Esophagus | 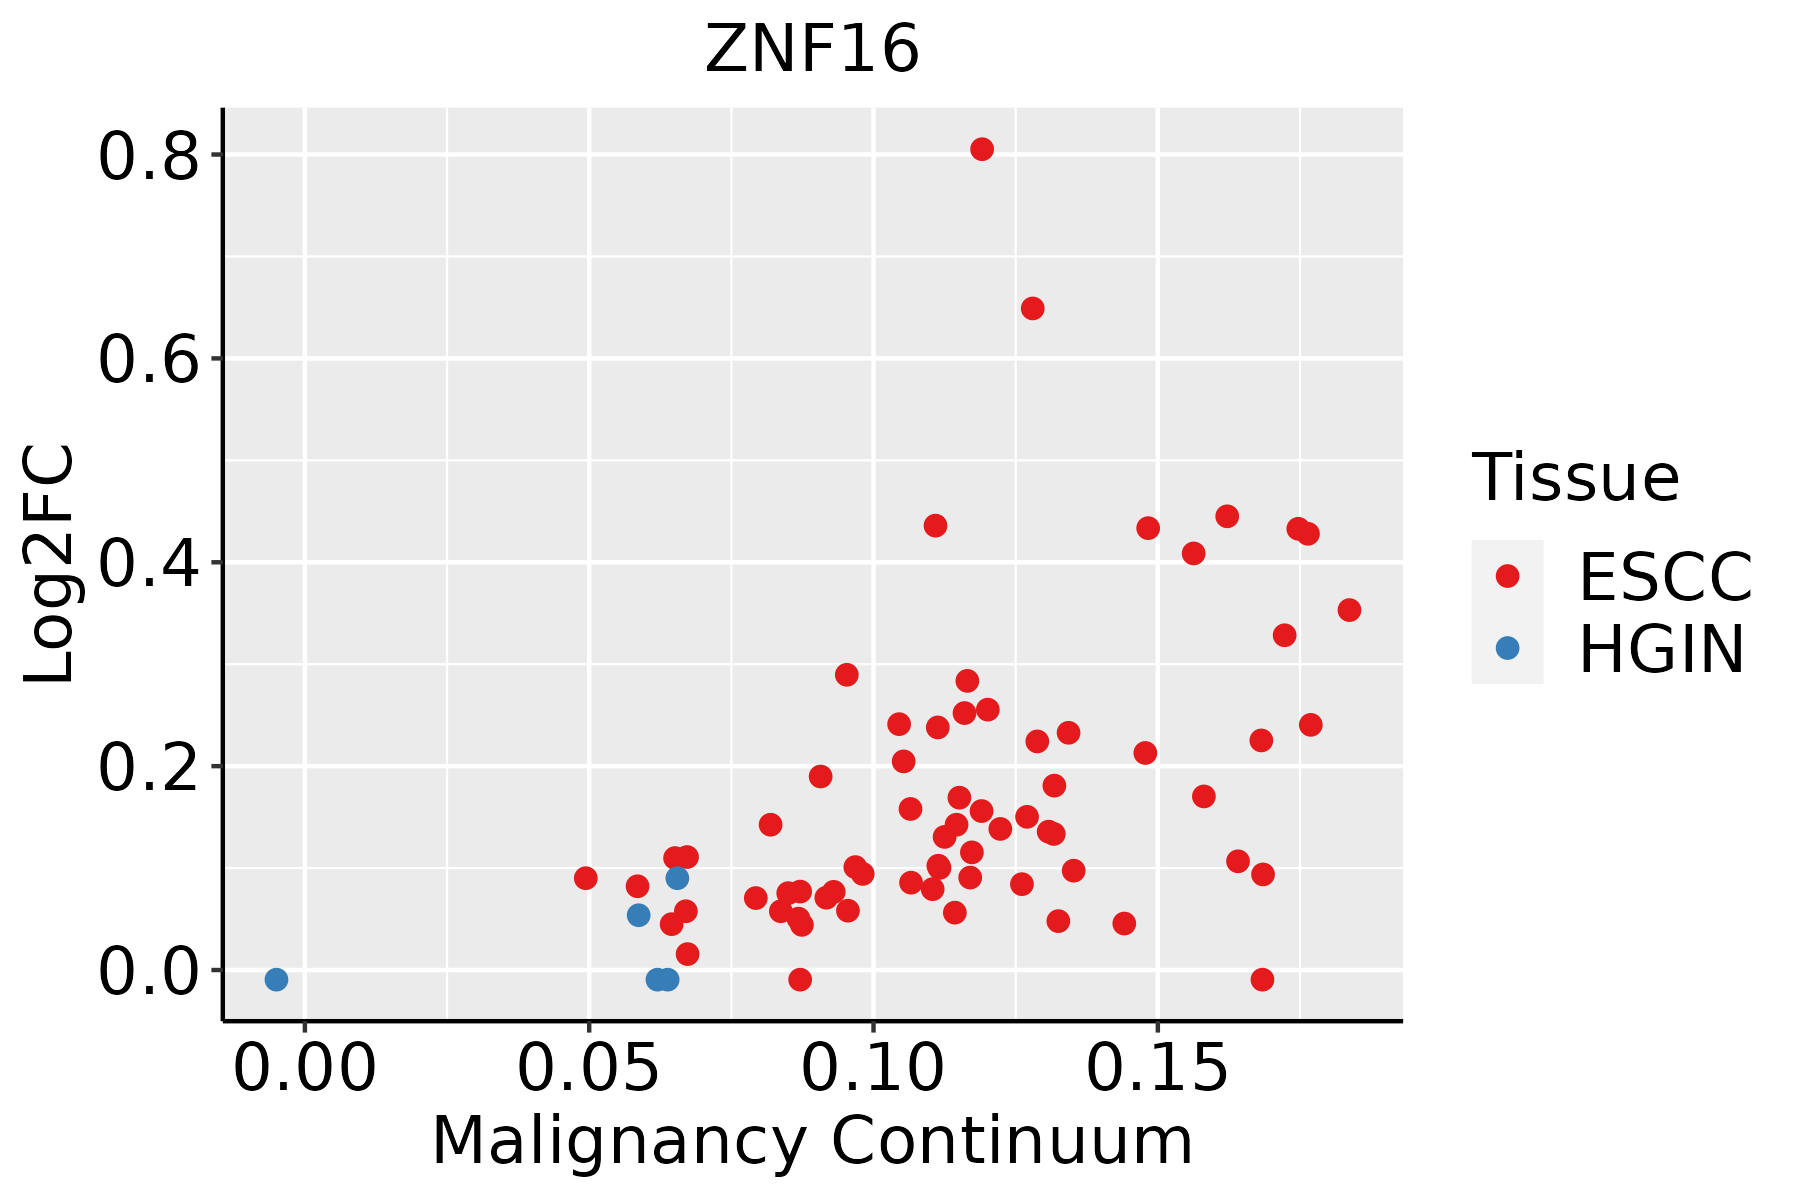 | ESCC: Esophageal squamous cell carcinoma |
| HGIN: High-grade intraepithelial neoplasias | ||
| LGIN: Low-grade intraepithelial neoplasias |
| ∗log2FC in expression of this searched gene in stem-like cells from each diseased tissue sample relative to stem-like cells in normal samples in each tissue plotted against the malignancy continuum. Samples are colored based on if they are from different disease stage. |
Top |
Malignant transformation related pathway analysis |
| Find out the enriched GO biological processes and KEGG pathways involved in transition from healthy to precancer to cancer |
| Tissue | Disease Stage | Enriched GO biological Processes |
| Colorectum | AD |  |
| Colorectum | SER |  |
| Colorectum | MSS |  |
| Colorectum | MSI-H |  |
| Colorectum | FAP |  |
| ∗Top 15 enriched GO BP terms are showed in the bar plot of each disease state in each tissue. Each row represents a significant GO biological process which is colored according to the -log10(p.adjust). |
| Page: 1 2 3 4 5 6 7 8 9 |
| GO ID | Tissue | Disease Stage | Description | Gene Ratio | Bg Ratio | pvalue | p.adjust | Count |
| GO:190198713 | Esophagus | ESCC | regulation of cell cycle phase transition | 242/8552 | 390/18723 | 3.86e-11 | 1.26e-09 | 242 |
| GO:004578710 | Esophagus | ESCC | positive regulation of cell cycle | 196/8552 | 313/18723 | 9.27e-10 | 2.24e-08 | 196 |
| GO:0030099111 | Esophagus | ESCC | myeloid cell differentiation | 232/8552 | 381/18723 | 1.22e-09 | 2.90e-08 | 232 |
| GO:0002262111 | Esophagus | ESCC | myeloid cell homeostasis | 104/8552 | 157/18723 | 1.49e-07 | 2.36e-06 | 104 |
| GO:0034101111 | Esophagus | ESCC | erythrocyte homeostasis | 88/8552 | 129/18723 | 1.81e-07 | 2.84e-06 | 88 |
| GO:0048872111 | Esophagus | ESCC | homeostasis of number of cells | 163/8552 | 272/18723 | 1.40e-06 | 1.69e-05 | 163 |
| GO:0030218111 | Esophagus | ESCC | erythrocyte differentiation | 80/8552 | 120/18723 | 2.69e-06 | 3.08e-05 | 80 |
| GO:19019896 | Esophagus | ESCC | positive regulation of cell cycle phase transition | 77/8552 | 115/18723 | 3.20e-06 | 3.58e-05 | 77 |
| GO:00900689 | Esophagus | ESCC | positive regulation of cell cycle process | 142/8552 | 236/18723 | 4.79e-06 | 5.08e-05 | 142 |
| GO:003367420 | Esophagus | ESCC | positive regulation of kinase activity | 260/8552 | 467/18723 | 7.26e-06 | 7.22e-05 | 260 |
| GO:1903706110 | Esophagus | ESCC | regulation of hemopoiesis | 201/8552 | 367/18723 | 2.60e-04 | 1.58e-03 | 201 |
| GO:004563918 | Esophagus | ESCC | positive regulation of myeloid cell differentiation | 64/8552 | 103/18723 | 5.54e-04 | 3.03e-03 | 64 |
| GO:0045637111 | Esophagus | ESCC | regulation of myeloid cell differentiation | 118/8552 | 210/18723 | 1.35e-03 | 6.43e-03 | 118 |
| GO:004564619 | Esophagus | ESCC | regulation of erythrocyte differentiation | 32/8552 | 47/18723 | 1.59e-03 | 7.43e-03 | 32 |
| GO:00513025 | Esophagus | ESCC | regulation of cell division | 97/8552 | 177/18723 | 8.93e-03 | 3.12e-02 | 97 |
| Page: 1 |
| Pathway ID | Tissue | Disease Stage | Description | Gene Ratio | Bg Ratio | pvalue | p.adjust | qvalue | Count |
| Page: 1 |
Top |
Cell-cell communication analysis |
| Identification of potential cell-cell interactions between two cell types and their ligand-receptor pairs for different disease states |
| Ligand | Receptor | LRpair | Pathway | Tissue | Disease Stage |
| Page: 1 |
Top |
Single-cell gene regulatory network inference analysis |
| Find out the significant the regulons (TFs) and the target genes of each regulon across cell types for different disease states |
| TF | Cell Type | Tissue | Disease Stage | Target Gene | RSS | Regulon Activity |
| ZNF16 | MYOEPI | Breast | IDC | TMEM47,SYT13,LRP5L, etc. | 4.27e-02 |  |
| ZNF16 | M2MAC | Breast | Healthy | CLIC2,ITGA5,RCCD1, etc. | 3.04e-03 |  |
| ZNF16 | M2MAC | Breast | IDC | CLIC2,ITGA5,RCCD1, etc. | 2.01e-02 | |
| ZNF16 | CT | Colorectum | Healthy | MTRNR2L8,ARL16,OPN3, etc. | 1.41e-01 |  |
| ZNF16 | CFIB | Colorectum | FAP | GARNL3,ZNF518A,CCDC59, etc. | 2.80e-01 |  |
| ZNF16 | CD8TEXP | Endometrium | Healthy | ARHGAP45,TCF7,DCAF17, etc. | 1.50e-01 |  |
| ZNF16 | FIB | Oral cavity | Healthy | MIGA1,GOLGA8A,ATP13A2, etc. | 1.58e-01 |  |
| ZNF16 | CAF | Oral cavity | NEOLP | MIGA1,GOLGA8A,ATP13A2, etc. | 8.70e-02 |  |
| ZNF16 | PTC | Thyroid | ADJ | CLMN,MIAT,XRCC3, etc. | 9.40e-02 |  |
| ZNF16 | TFC | Thyroid | goiters | CLMN,MIAT,XRCC3, etc. | 9.02e-02 |  |
| ∗The dot plots of a searched regulon are shown for all cell subpopulations in each disease state of each tissue based on the regulon specific score inferred using pySCENIC and by calculating the average expression. |
| Page: 1 2 |
Top |
Somatic mutation of malignant transformation related genes |
| Annotation of somatic variants for genes involved in malignant transformation |
| Hugo Symbol | Variant Class | Variant Classification | dbSNP RS | HGVSc | HGVSp | HGVSp Short | SWISSPROT | BIOTYPE | SIFT | PolyPhen | Tumor Sample Barcode | Tissue | Histology | Sex | Age | Stage | Therapy Types | Drugs | Outcome |
| ZNF16 | SNV | Missense_Mutation | c.550G>A | p.Asp184Asn | p.D184N | P17020 | protein_coding | tolerated(1) | benign(0.006) | TCGA-A2-A25E-01 | Breast | breast invasive carcinoma | Female | <65 | III/IV | Chemotherapy | cytoxan | PD | |
| ZNF16 | SNV | Missense_Mutation | novel | c.526N>G | p.Thr176Ala | p.T176A | P17020 | protein_coding | tolerated(0.11) | benign(0) | TCGA-AC-A3W7-01 | Breast | breast invasive carcinoma | Female | >=65 | I/II | Hormone Therapy | femara | SD |
| ZNF16 | SNV | Missense_Mutation | novel | c.17N>T | p.Thr6Ile | p.T6I | P17020 | protein_coding | tolerated_low_confidence(0.06) | benign(0) | TCGA-BH-A0H9-01 | Breast | breast invasive carcinoma | Female | >=65 | I/II | Hormone Therapy | arimidex | SD |
| ZNF16 | SNV | Missense_Mutation | rs753210600 | c.1451C>T | p.Thr484Met | p.T484M | P17020 | protein_coding | deleterious(0) | probably_damaging(0.999) | TCGA-BH-A18G-01 | Breast | breast invasive carcinoma | Female | >=65 | I/II | Unknown | Unknown | SD |
| ZNF16 | SNV | Missense_Mutation | rs769737434 | c.23N>A | p.Arg8His | p.R8H | P17020 | protein_coding | tolerated_low_confidence(0.06) | benign(0) | TCGA-D8-A27G-01 | Breast | breast invasive carcinoma | Female | >=65 | I/II | Unknown | Unknown | SD |
| ZNF16 | insertion | Nonsense_Mutation | novel | c.1853_1854insTGAGCTATTGTGCCTGGCCAGAAAGTGAGTGTTGGTGACATGC | p.Gln618HisfsTer10 | p.Q618Hfs*10 | P17020 | protein_coding | TCGA-A8-A06X-01 | Breast | breast invasive carcinoma | Female | >=65 | I/II | Unknown | Unknown | SD | ||
| ZNF16 | insertion | Nonsense_Mutation | novel | c.1910_1911insACTTCCTTGAATTTCTGCACCAACTATTTTATTTGGATCC | p.Phe638LeufsTer3 | p.F638Lfs*3 | P17020 | protein_coding | TCGA-A8-A08H-01 | Breast | breast invasive carcinoma | Female | >=65 | I/II | Unknown | Unknown | SD | ||
| ZNF16 | insertion | Nonsense_Mutation | novel | c.421_422insCATCCATATGACATGGGTGGCCAGAGTTTCA | p.Met141ThrfsTer4 | p.M141Tfs*4 | P17020 | protein_coding | TCGA-B6-A0IJ-01 | Breast | breast invasive carcinoma | Female | <65 | I/II | Unknown | Unknown | SD | ||
| ZNF16 | insertion | Frame_Shift_Ins | novel | c.1868_1869insAGACATCA | p.His623GlnfsTer35 | p.H623Qfs*35 | P17020 | protein_coding | TCGA-BH-A0BA-01 | Breast | breast invasive carcinoma | Female | <65 | III/IV | Chemotherapy | cytoxan | SD | ||
| ZNF16 | insertion | Nonsense_Mutation | novel | c.1803_1804insCCCCATCCTTAGTTCTCAGAGCTGTGCTCCTGT | p.Tyr601_Thr602insProHisProTerPheSerGluLeuCysSerCys | p.Y601_T602insPHP*FSELCSC | P17020 | protein_coding | TCGA-BH-A0HK-01 | Breast | breast invasive carcinoma | Female | >=65 | I/II | Hormone Therapy | arimidex | SD |
| Page: 1 2 3 4 5 6 7 8 |
Top |
Related drugs of malignant transformation related genes |
| Identification of chemicals and drugs interact with genes involved in malignant transfromation |
| (DGIdb 4.0) |
| Entrez ID | Symbol | Category | Interaction Types | Drug Claim Name | Drug Name | PMIDs |
| Page: 1 |

Copyright 2023-Present -The University of Texas Health Science Center at Houston |