
|
|||||
|
 | |
| |
| |
| |
| |
| |
|
Gene: ZNF148 |
Gene summary for ZNF148 |
| Gene information | Species | Human | Gene symbol | ZNF148 | Gene ID | 7707 |
| Gene name | zinc finger protein 148 | |
| Gene Alias | BERF-1 | |
| Cytomap | 3q21.2 | |
| Gene Type | protein-coding | GO ID | GO:0000003 | UniProtAcc | Q9UQR1 |
Top |
Malignant transformation analysis |
| Identification of the aberrant gene expression in precancerous and cancerous lesions by comparing the gene expression of stem-like cells in diseased tissues with normal stem cells |
| Entrez ID | Symbol | Replicates | Species | Organ | Tissue | Adj P-value | Log2FC | Malignancy |
| 7707 | ZNF148 | CA_HPV_1 | Human | Cervix | CC | 4.09e-02 | -1.34e-01 | 0.0264 |
| 7707 | ZNF148 | CCI_1 | Human | Cervix | CC | 1.87e-06 | 1.28e+00 | 0.528 |
| 7707 | ZNF148 | CCI_2 | Human | Cervix | CC | 5.61e-09 | 1.09e+00 | 0.5249 |
| 7707 | ZNF148 | CCI_3 | Human | Cervix | CC | 7.36e-22 | 1.54e+00 | 0.516 |
| 7707 | ZNF148 | HTA11_3410_2000001011 | Human | Colorectum | AD | 1.45e-30 | -7.95e-01 | 0.0155 |
| 7707 | ZNF148 | HTA11_2487_2000001011 | Human | Colorectum | SER | 7.96e-08 | -4.54e-01 | -0.1808 |
| 7707 | ZNF148 | HTA11_2951_2000001011 | Human | Colorectum | AD | 9.00e-04 | -8.17e-01 | 0.0216 |
| 7707 | ZNF148 | HTA11_3361_2000001011 | Human | Colorectum | AD | 3.03e-08 | -6.70e-01 | -0.1207 |
| 7707 | ZNF148 | HTA11_83_2000001011 | Human | Colorectum | SER | 2.40e-05 | -5.05e-01 | -0.1526 |
| 7707 | ZNF148 | HTA11_696_2000001011 | Human | Colorectum | AD | 8.94e-08 | -4.56e-01 | -0.1464 |
| 7707 | ZNF148 | HTA11_866_2000001011 | Human | Colorectum | AD | 4.58e-06 | -3.74e-01 | -0.1001 |
| 7707 | ZNF148 | HTA11_5212_2000001011 | Human | Colorectum | AD | 4.40e-05 | -5.73e-01 | -0.2061 |
| 7707 | ZNF148 | HTA11_546_2000001011 | Human | Colorectum | AD | 1.48e-02 | -4.90e-01 | -0.0842 |
| 7707 | ZNF148 | HTA11_9341_2000001011 | Human | Colorectum | SER | 3.56e-02 | -5.64e-01 | -0.00410000000000005 |
| 7707 | ZNF148 | HTA11_866_3004761011 | Human | Colorectum | AD | 9.95e-13 | -6.64e-01 | 0.096 |
| 7707 | ZNF148 | HTA11_9408_2000001011 | Human | Colorectum | AD | 5.26e-04 | -9.47e-01 | 0.0451 |
| 7707 | ZNF148 | HTA11_8622_2000001021 | Human | Colorectum | SER | 4.83e-03 | -7.04e-01 | 0.0528 |
| 7707 | ZNF148 | HTA11_10711_2000001011 | Human | Colorectum | AD | 1.19e-03 | -4.45e-01 | 0.0338 |
| 7707 | ZNF148 | HTA11_7696_3000711011 | Human | Colorectum | AD | 1.19e-13 | -5.66e-01 | 0.0674 |
| 7707 | ZNF148 | HTA11_6818_2000001011 | Human | Colorectum | AD | 3.10e-06 | -4.35e-01 | 0.0112 |
| Page: 1 2 3 4 5 6 7 8 9 10 11 |
| Tissue | Expression Dynamics | Abbreviation |
| Cervix |  | CC: Cervix cancer |
| HSIL_HPV: HPV-infected high-grade squamous intraepithelial lesions | ||
| N_HPV: HPV-infected normal cervix | ||
| Colorectum (GSE201348) |  | FAP: Familial adenomatous polyposis |
| CRC: Colorectal cancer | ||
| Colorectum (HTA11) |  | AD: Adenomas |
| SER: Sessile serrated lesions | ||
| MSI-H: Microsatellite-high colorectal cancer | ||
| MSS: Microsatellite stable colorectal cancer | ||
| Esophagus | 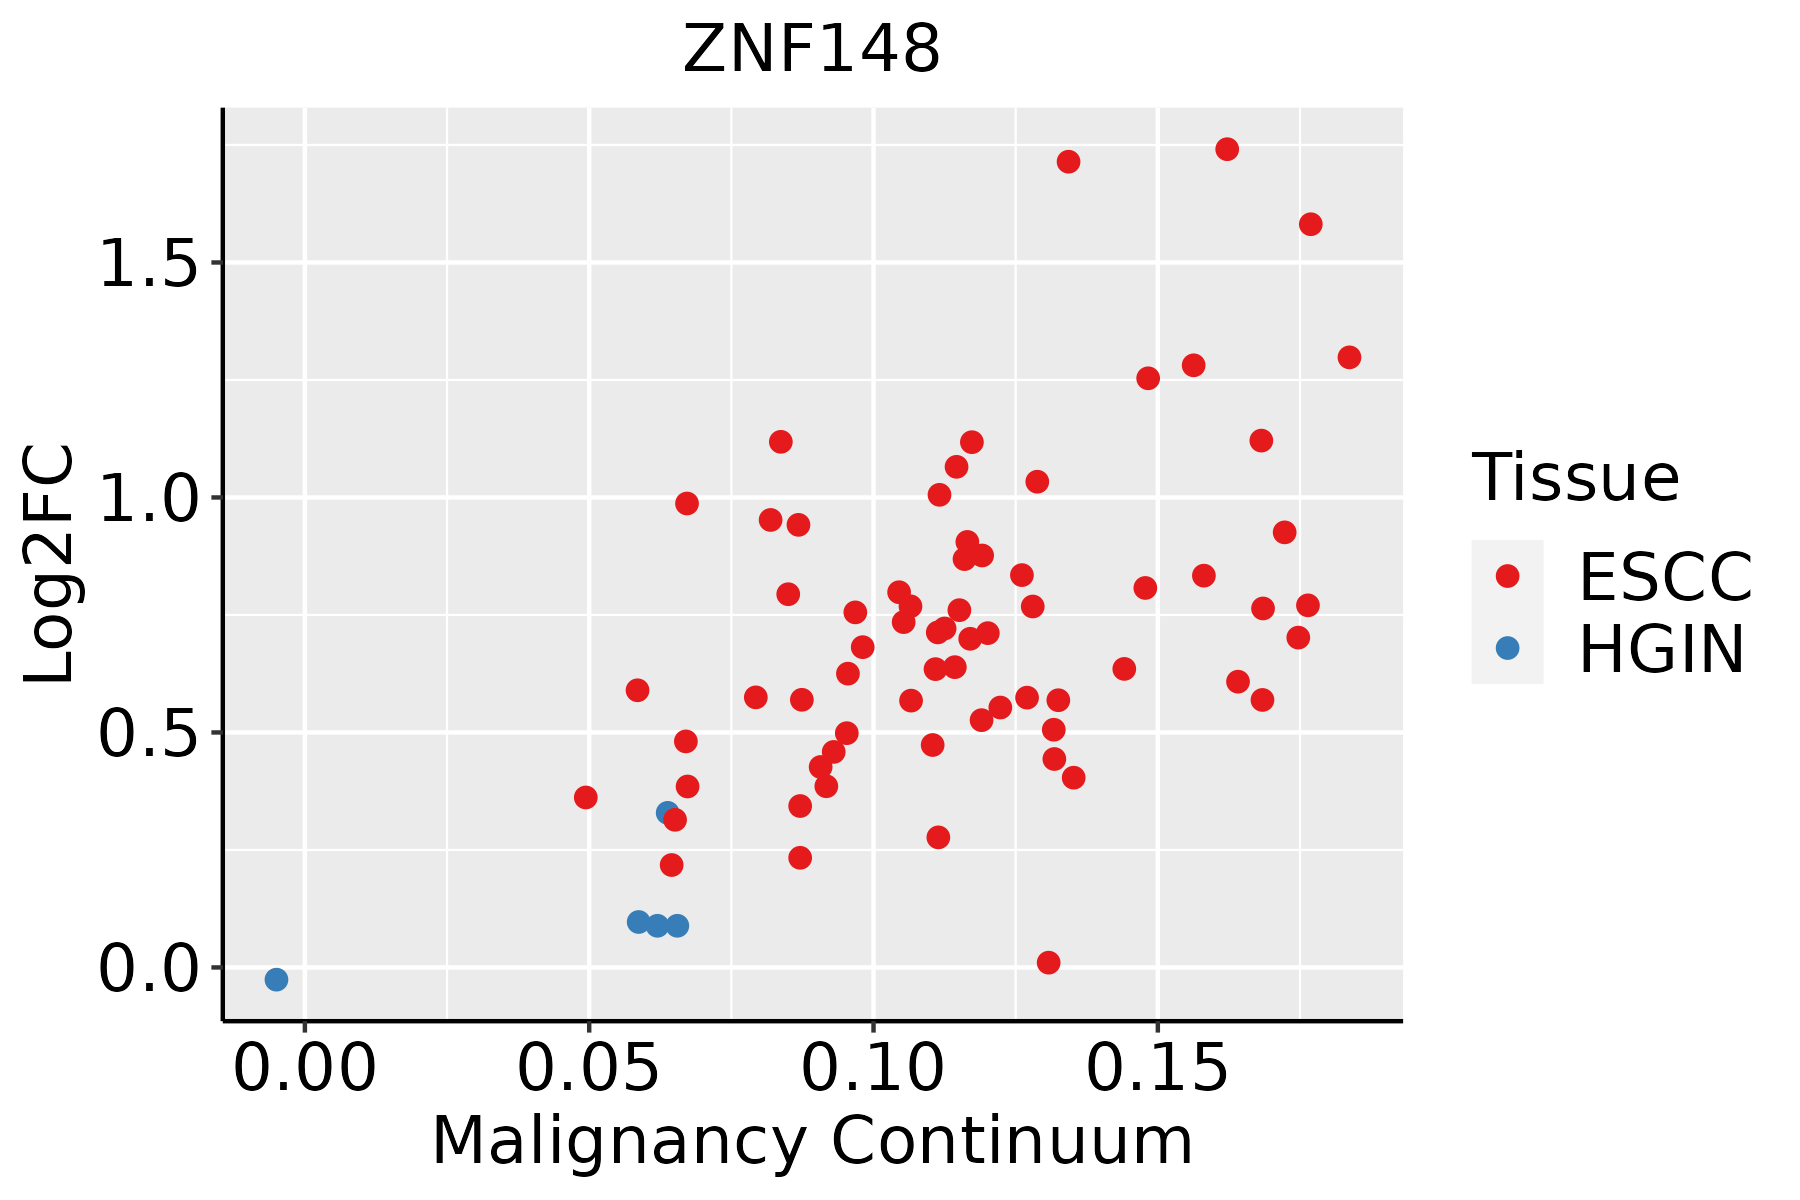 | ESCC: Esophageal squamous cell carcinoma |
| HGIN: High-grade intraepithelial neoplasias | ||
| LGIN: Low-grade intraepithelial neoplasias | ||
| Liver | 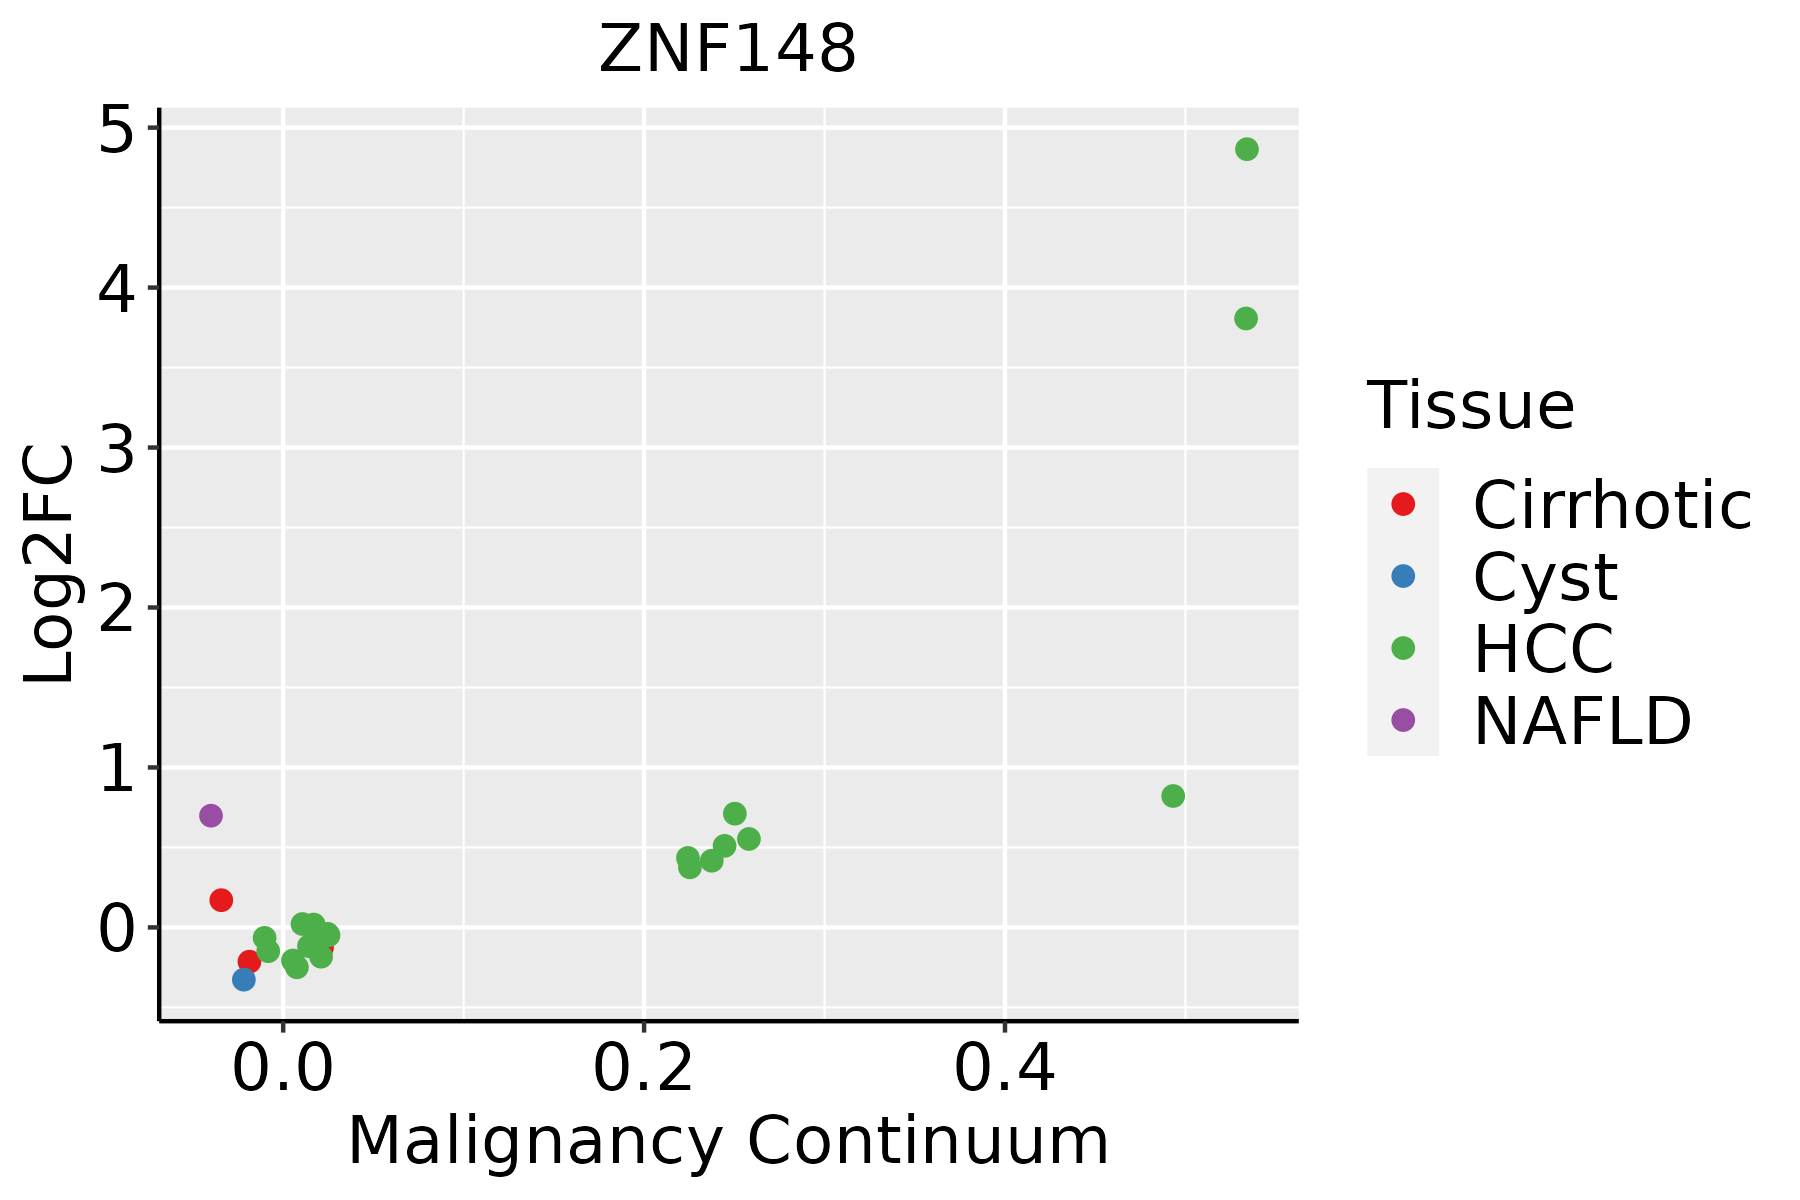 | HCC: Hepatocellular carcinoma |
| NAFLD: Non-alcoholic fatty liver disease | ||
| Lung | 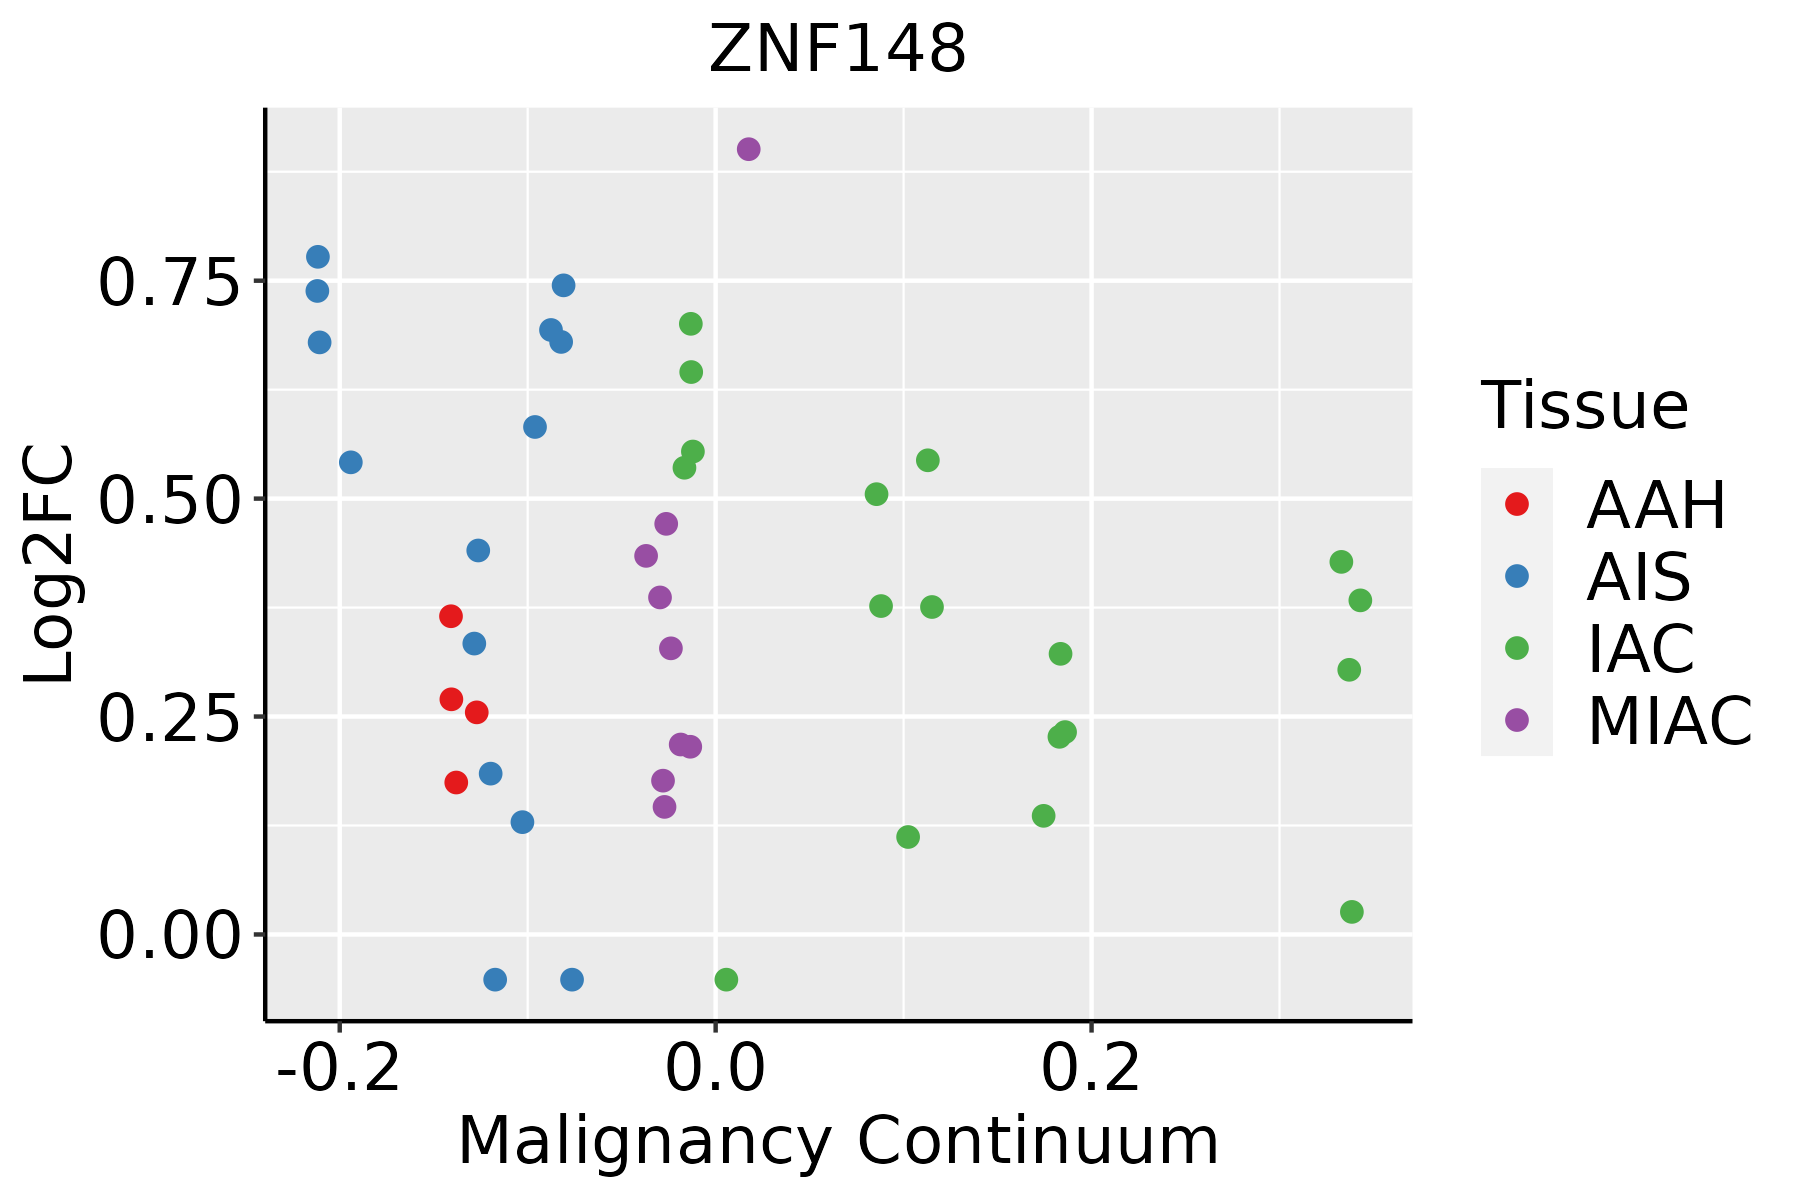 | AAH: Atypical adenomatous hyperplasia |
| AIS: Adenocarcinoma in situ | ||
| IAC: Invasive lung adenocarcinoma | ||
| MIA: Minimally invasive adenocarcinoma | ||
| Oral Cavity | 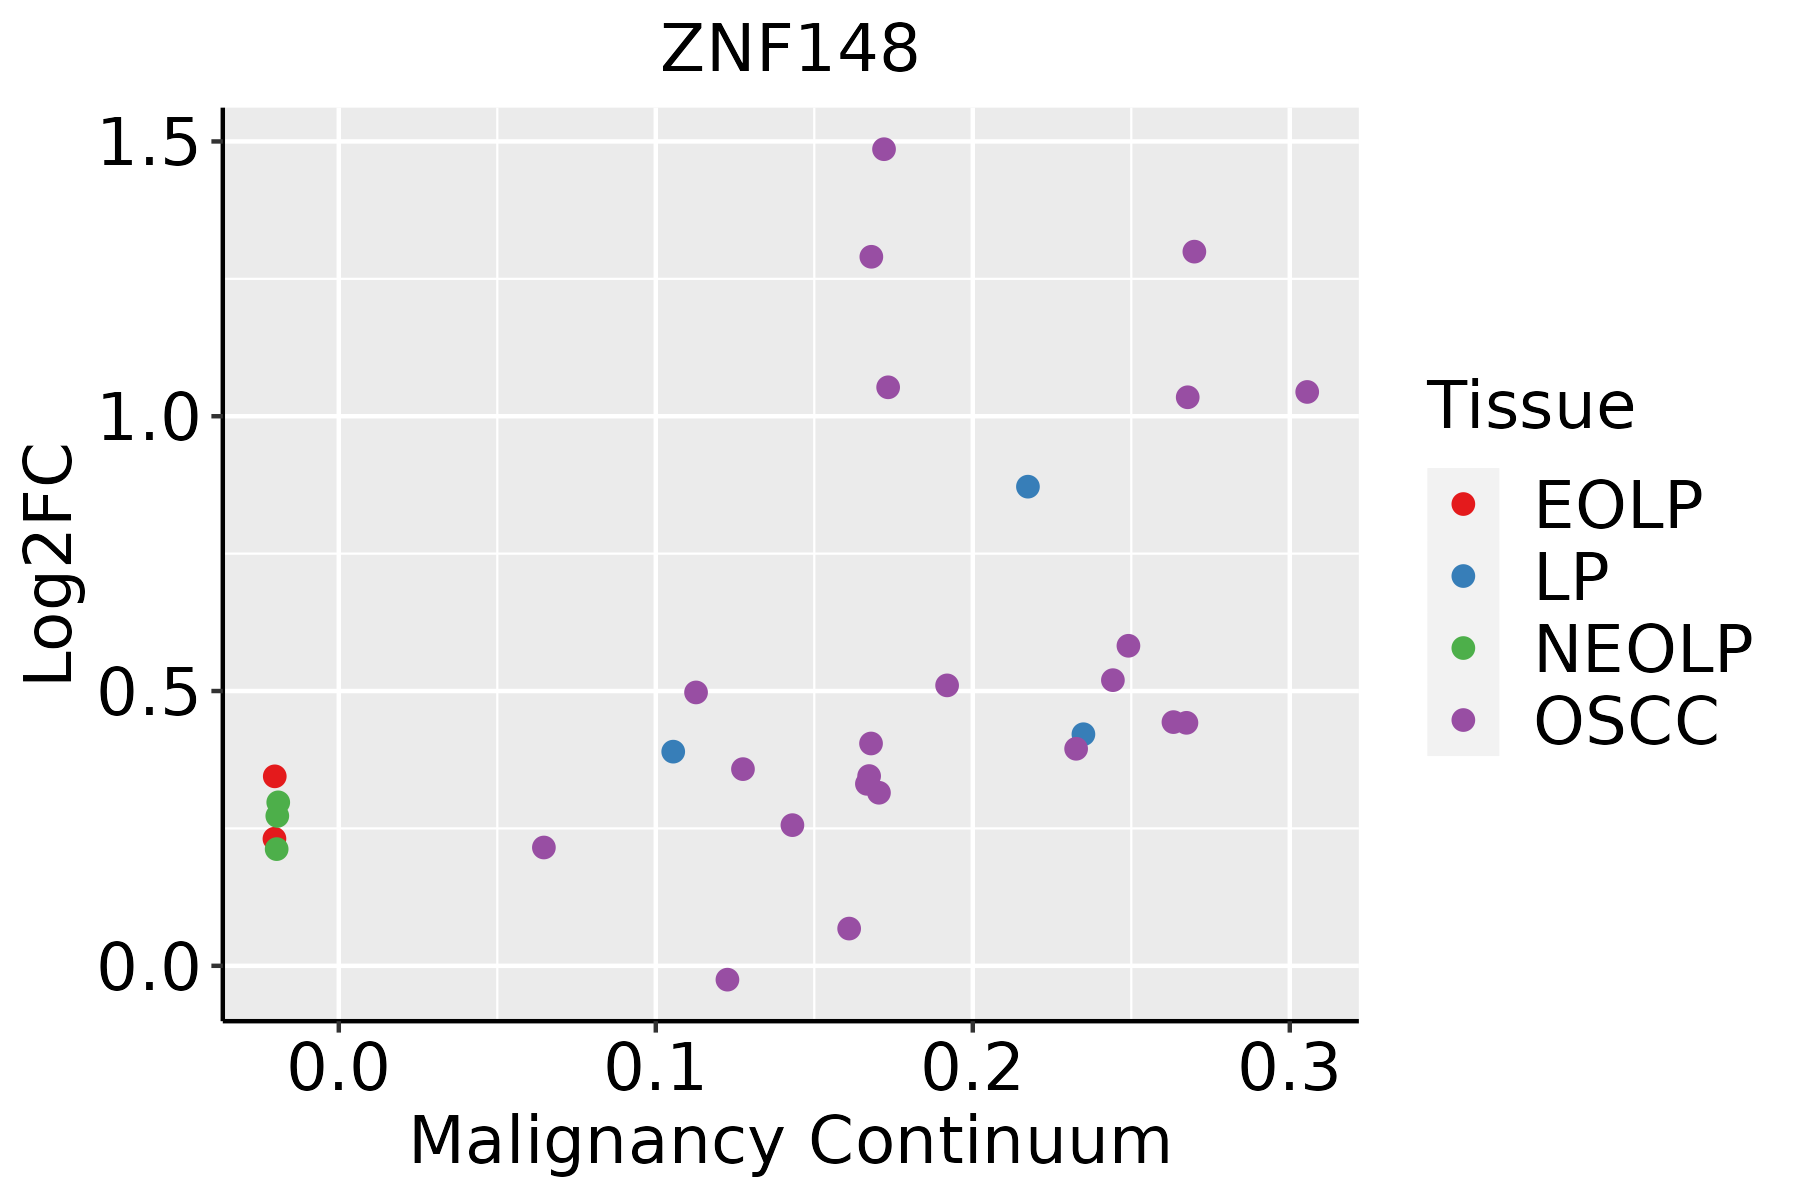 | EOLP: Erosive Oral lichen planus |
| LP: leukoplakia | ||
| NEOLP: Non-erosive oral lichen planus | ||
| OSCC: Oral squamous cell carcinoma | ||
| Prostate | 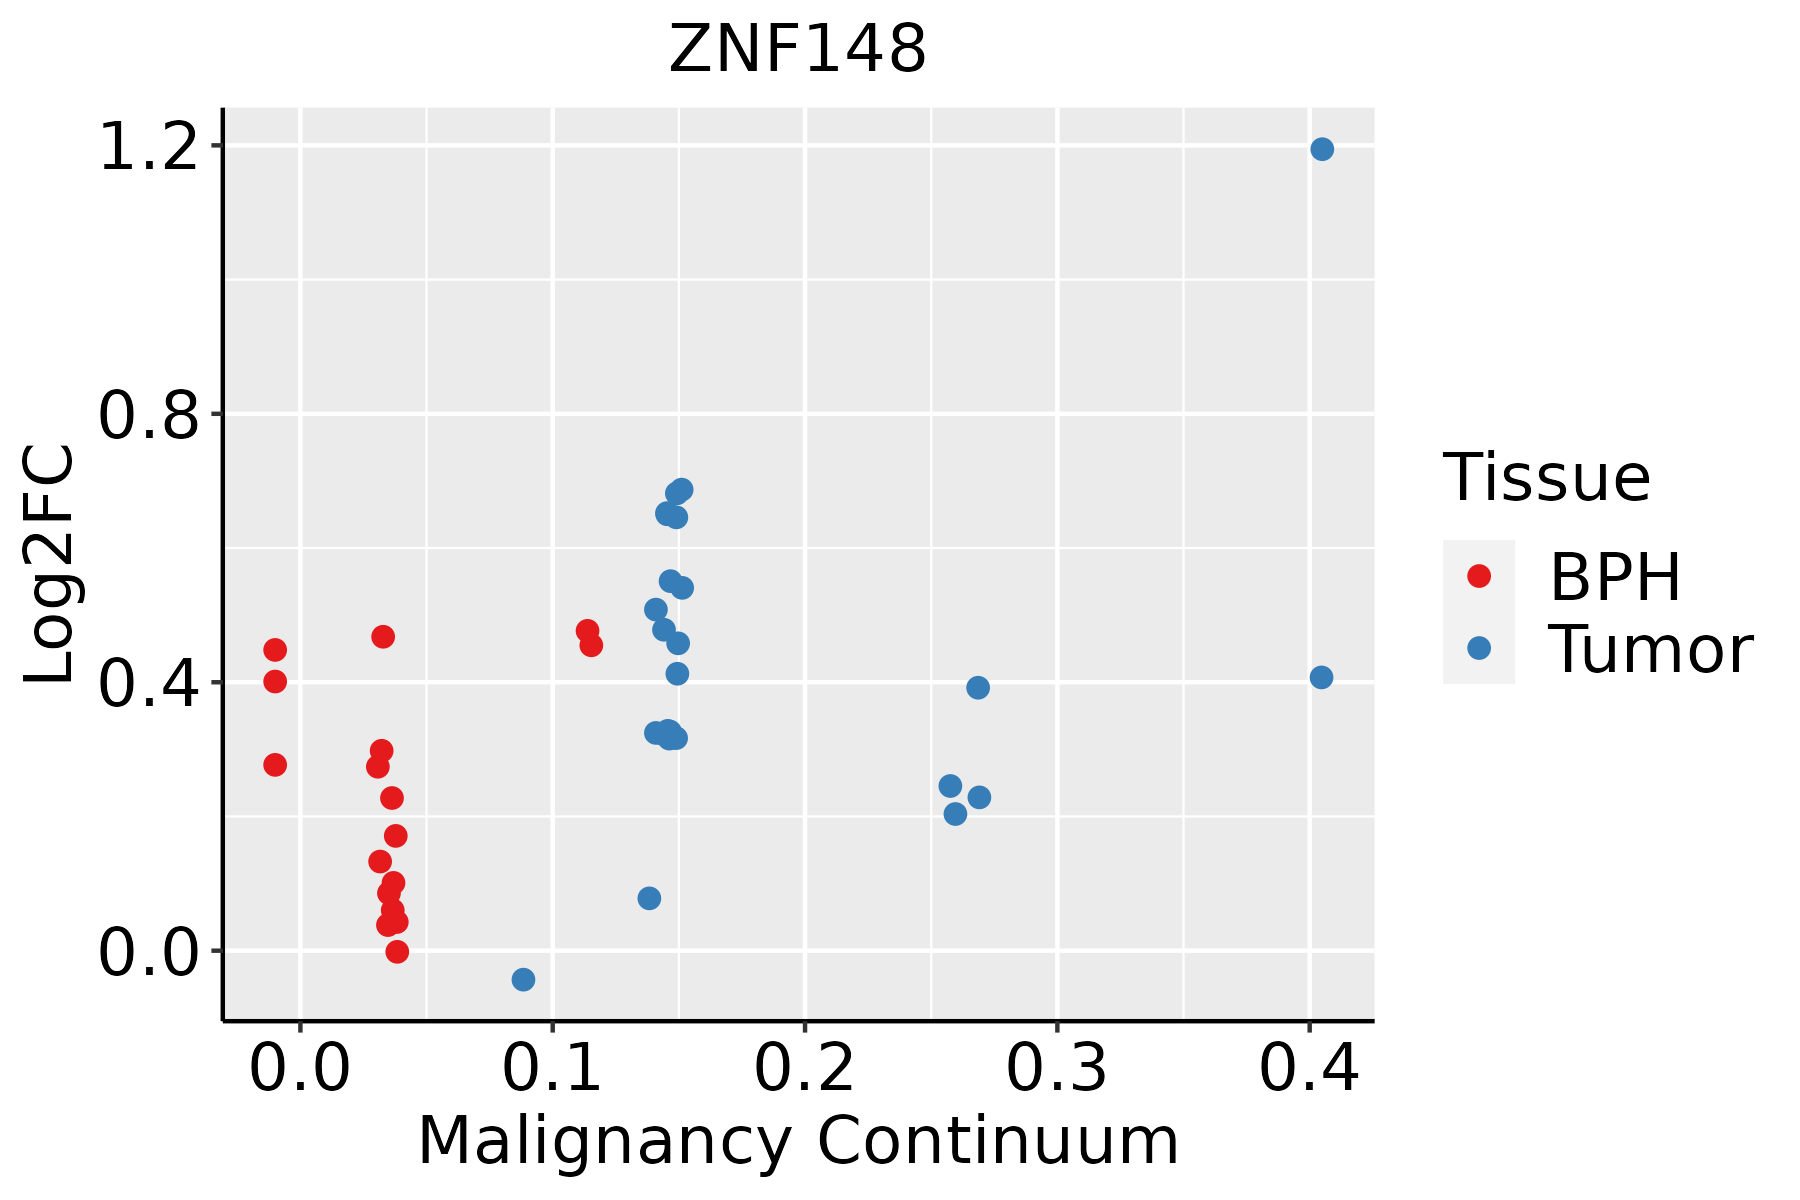 | BPH: Benign Prostatic Hyperplasia |
| Skin |  | AK: Actinic keratosis |
| cSCC: Cutaneous squamous cell carcinoma | ||
| SCCIS:squamous cell carcinoma in situ | ||
| Thyroid | 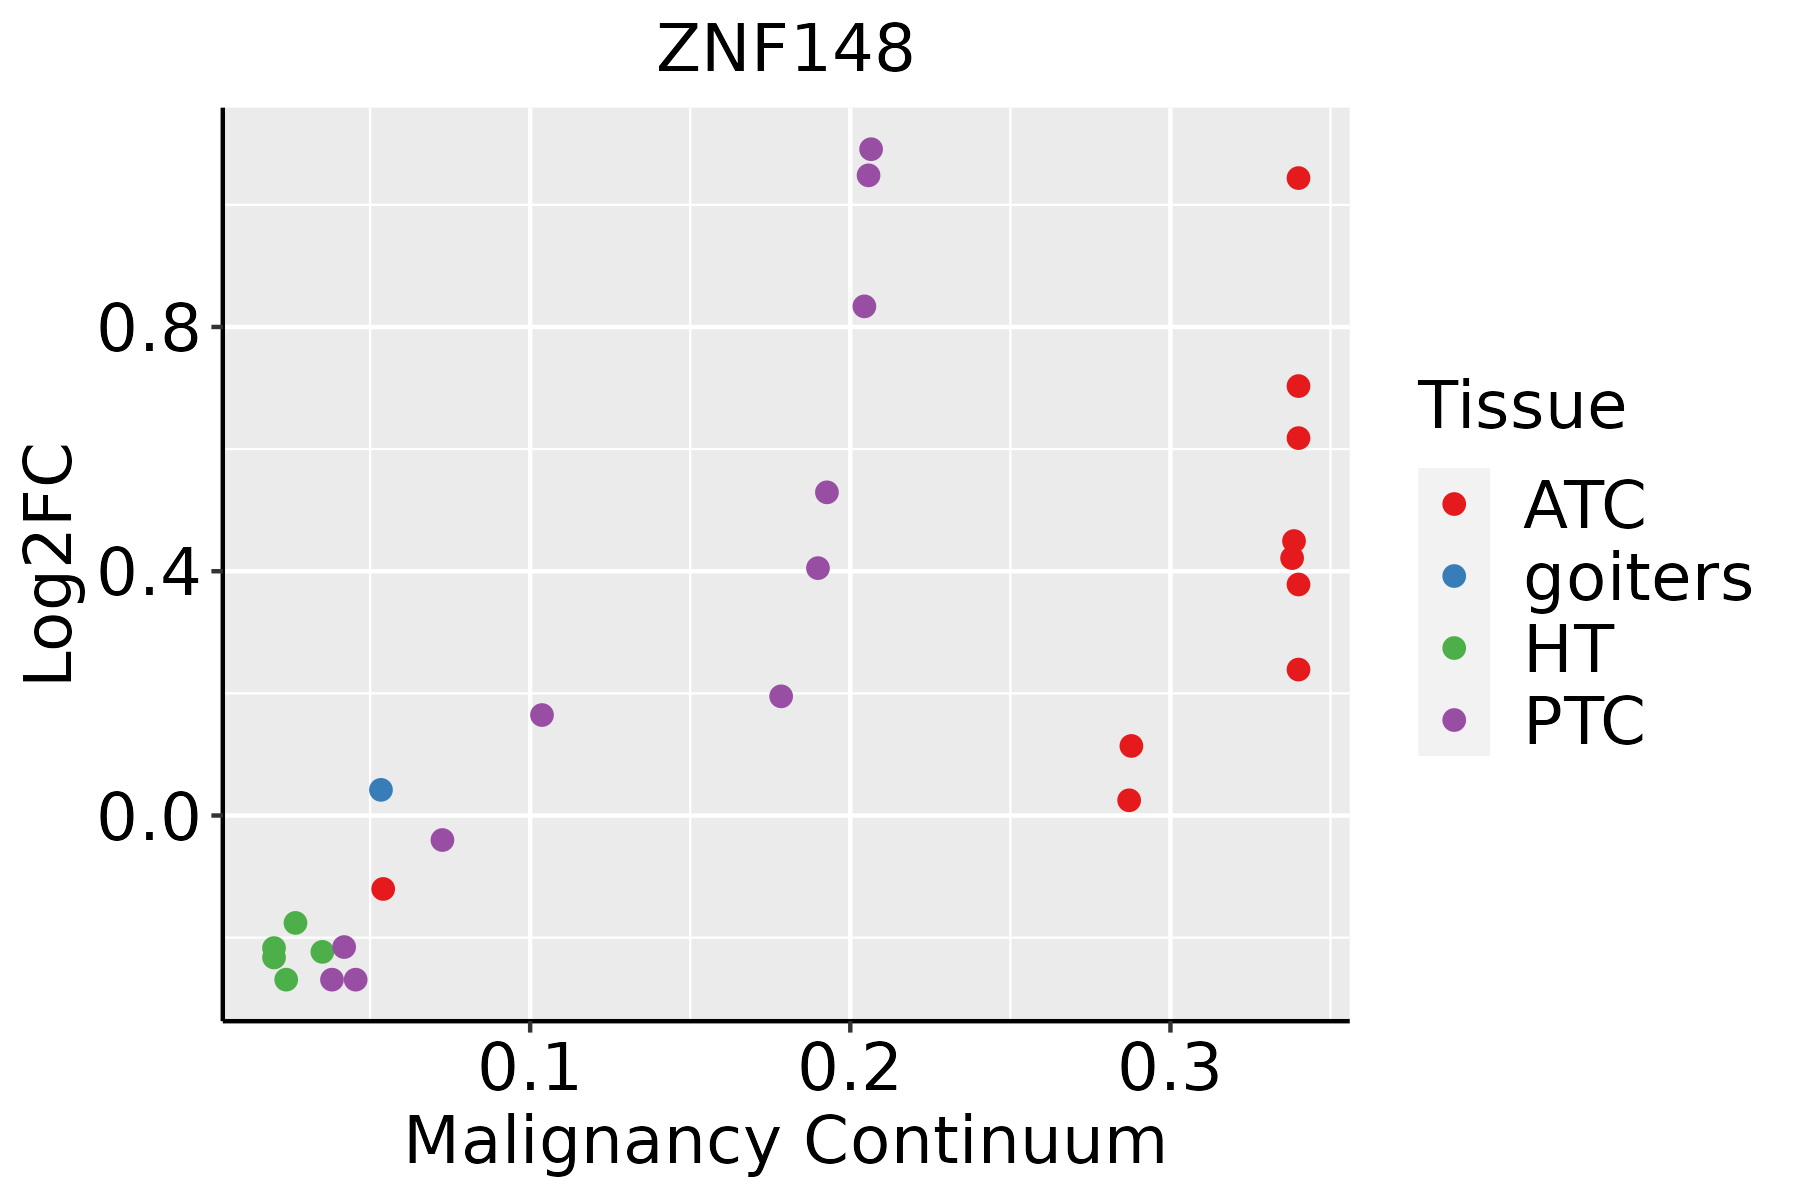 | ATC: Anaplastic thyroid cancer |
| HT: Hashimoto's thyroiditis | ||
| PTC: Papillary thyroid cancer |
| ∗log2FC in expression of this searched gene in stem-like cells from each diseased tissue sample relative to stem-like cells in normal samples in each tissue plotted against the malignancy continuum. Samples are colored based on if they are from different disease stage. |
Top |
Malignant transformation related pathway analysis |
| Find out the enriched GO biological processes and KEGG pathways involved in transition from healthy to precancer to cancer |
| Tissue | Disease Stage | Enriched GO biological Processes |
| Colorectum | AD |  |
| Colorectum | SER |  |
| Colorectum | MSS |  |
| Colorectum | MSI-H |  |
| Colorectum | FAP |  |
| ∗Top 15 enriched GO BP terms are showed in the bar plot of each disease state in each tissue. Each row represents a significant GO biological process which is colored according to the -log10(p.adjust). |
| Page: 1 2 3 4 5 6 7 8 9 |
| GO ID | Tissue | Disease Stage | Description | Gene Ratio | Bg Ratio | pvalue | p.adjust | Count |
| GO:00309019 | Cervix | CC | midbrain development | 26/2311 | 90/18723 | 2.12e-05 | 3.82e-04 | 26 |
| GO:002176210 | Cervix | CC | substantia nigra development | 16/2311 | 44/18723 | 3.81e-05 | 5.99e-04 | 16 |
| GO:00488579 | Cervix | CC | neural nucleus development | 18/2311 | 64/18723 | 5.42e-04 | 5.23e-03 | 18 |
| GO:0021762 | Colorectum | AD | substantia nigra development | 21/3918 | 44/18723 | 6.60e-05 | 1.07e-03 | 21 |
| GO:0048857 | Colorectum | AD | neural nucleus development | 27/3918 | 64/18723 | 9.57e-05 | 1.45e-03 | 27 |
| GO:0030901 | Colorectum | AD | midbrain development | 32/3918 | 90/18723 | 9.45e-04 | 8.95e-03 | 32 |
| GO:00217621 | Colorectum | SER | substantia nigra development | 21/2897 | 44/18723 | 4.77e-07 | 2.40e-05 | 21 |
| GO:00488571 | Colorectum | SER | neural nucleus development | 26/2897 | 64/18723 | 1.09e-06 | 5.11e-05 | 26 |
| GO:00309011 | Colorectum | SER | midbrain development | 29/2897 | 90/18723 | 5.50e-05 | 1.30e-03 | 29 |
| GO:00217622 | Colorectum | MSS | substantia nigra development | 21/3467 | 44/18723 | 9.54e-06 | 2.33e-04 | 21 |
| GO:00488572 | Colorectum | MSS | neural nucleus development | 26/3467 | 64/18723 | 3.19e-05 | 6.30e-04 | 26 |
| GO:00309012 | Colorectum | MSS | midbrain development | 31/3467 | 90/18723 | 2.36e-04 | 3.24e-03 | 31 |
| GO:00217624 | Colorectum | FAP | substantia nigra development | 15/2622 | 44/18723 | 6.22e-04 | 6.82e-03 | 15 |
| GO:00488574 | Colorectum | FAP | neural nucleus development | 19/2622 | 64/18723 | 8.94e-04 | 9.08e-03 | 19 |
| GO:00309014 | Colorectum | FAP | midbrain development | 24/2622 | 90/18723 | 1.12e-03 | 1.08e-02 | 24 |
| GO:00488575 | Colorectum | CRC | neural nucleus development | 17/2078 | 64/18723 | 4.59e-04 | 6.70e-03 | 17 |
| GO:00217625 | Colorectum | CRC | substantia nigra development | 13/2078 | 44/18723 | 7.05e-04 | 9.17e-03 | 13 |
| GO:00309015 | Colorectum | CRC | midbrain development | 21/2078 | 90/18723 | 7.06e-04 | 9.17e-03 | 21 |
| GO:0021762111 | Esophagus | ESCC | substantia nigra development | 35/8552 | 44/18723 | 4.40e-06 | 4.69e-05 | 35 |
| GO:004885718 | Esophagus | ESCC | neural nucleus development | 44/8552 | 64/18723 | 1.59e-04 | 1.05e-03 | 44 |
| Page: 1 2 3 |
| Pathway ID | Tissue | Disease Stage | Description | Gene Ratio | Bg Ratio | pvalue | p.adjust | qvalue | Count |
| Page: 1 |
Top |
Cell-cell communication analysis |
| Identification of potential cell-cell interactions between two cell types and their ligand-receptor pairs for different disease states |
| Ligand | Receptor | LRpair | Pathway | Tissue | Disease Stage |
| Page: 1 |
Top |
Single-cell gene regulatory network inference analysis |
| Find out the significant the regulons (TFs) and the target genes of each regulon across cell types for different disease states |
| TF | Cell Type | Tissue | Disease Stage | Target Gene | RSS | Regulon Activity |
| ZNF148 | CAF | Breast | DCIS | TFRC,LIPA,SCD, etc. | 7.27e-02 |  |
| ZNF148 | LYMEND | Breast | DCIS | TFRC,LIPA,SCD, etc. | 3.43e-02 | |
| ZNF148 | NK | Lung | ADJ | GAREM1,IKZF1,PIP4K2A, etc. | 2.07e-01 |  |
| ZNF148 | ALVMAC | Lung | Healthy | GPR107,FGD3,PRPF8, etc. | 4.24e-03 |  |
| ∗The dot plots of a searched regulon are shown for all cell subpopulations in each disease state of each tissue based on the regulon specific score inferred using pySCENIC and by calculating the average expression. |
| Page: 1 |
Top |
Somatic mutation of malignant transformation related genes |
| Annotation of somatic variants for genes involved in malignant transformation |
| Hugo Symbol | Variant Class | Variant Classification | dbSNP RS | HGVSc | HGVSp | HGVSp Short | SWISSPROT | BIOTYPE | SIFT | PolyPhen | Tumor Sample Barcode | Tissue | Histology | Sex | Age | Stage | Therapy Types | Drugs | Outcome |
| ZNF148 | SNV | Missense_Mutation | c.1333N>A | p.Asp445Asn | p.D445N | Q9UQR1 | protein_coding | deleterious(0.01) | benign(0.435) | TCGA-A8-A0A7-01 | Breast | breast invasive carcinoma | Female | <65 | I/II | Unknown | Unknown | SD | |
| ZNF148 | SNV | Missense_Mutation | novel | c.2326N>A | p.Asp776Asn | p.D776N | Q9UQR1 | protein_coding | deleterious(0.02) | benign(0.023) | TCGA-AC-A23H-01 | Breast | breast invasive carcinoma | Female | >=65 | I/II | Unknown | Unknown | PD |
| ZNF148 | SNV | Missense_Mutation | c.304N>G | p.Gln102Glu | p.Q102E | Q9UQR1 | protein_coding | tolerated(0.38) | benign(0.122) | TCGA-AC-A23H-01 | Breast | breast invasive carcinoma | Female | >=65 | I/II | Unknown | Unknown | PD | |
| ZNF148 | SNV | Missense_Mutation | c.740N>T | p.Arg247Ile | p.R247I | Q9UQR1 | protein_coding | deleterious(0) | probably_damaging(0.997) | TCGA-AN-A046-01 | Breast | breast invasive carcinoma | Female | >=65 | I/II | Unknown | Unknown | SD | |
| ZNF148 | SNV | Missense_Mutation | c.2132N>T | p.Ser711Phe | p.S711F | Q9UQR1 | protein_coding | deleterious(0.01) | benign(0) | TCGA-D8-A1JP-01 | Breast | breast invasive carcinoma | Female | >=65 | I/II | Hormone Therapy | tamoxiphen | SD | |
| ZNF148 | insertion | Frame_Shift_Ins | novel | c.1856_1857insA | p.Asn619LysfsTer2 | p.N619Kfs*2 | Q9UQR1 | protein_coding | TCGA-C8-A1HN-01 | Breast | breast invasive carcinoma | Female | <65 | I/II | Unknown | Unknown | SD | ||
| ZNF148 | SNV | Missense_Mutation | rs762634520 | c.1423C>T | p.Arg475Trp | p.R475W | Q9UQR1 | protein_coding | deleterious(0) | benign(0.005) | TCGA-2W-A8YY-01 | Cervix | cervical & endocervical cancer | Female | <65 | I/II | Chemotherapy | cisplatin | CR |
| ZNF148 | SNV | Missense_Mutation | novel | c.1142C>T | p.Ala381Val | p.A381V | Q9UQR1 | protein_coding | tolerated(0.2) | benign(0.012) | TCGA-2W-A8YY-01 | Cervix | cervical & endocervical cancer | Female | <65 | I/II | Chemotherapy | cisplatin | CR |
| ZNF148 | SNV | Missense_Mutation | c.1669N>A | p.Glu557Lys | p.E557K | Q9UQR1 | protein_coding | deleterious(0.01) | possibly_damaging(0.506) | TCGA-BI-A0VS-01 | Cervix | cervical & endocervical cancer | Female | <65 | I/II | Unknown | Unknown | SD | |
| ZNF148 | SNV | Missense_Mutation | c.2373N>C | p.Gln791His | p.Q791H | Q9UQR1 | protein_coding | deleterious(0) | possibly_damaging(0.737) | TCGA-C5-A1M6-01 | Cervix | cervical & endocervical cancer | Female | <65 | I/II | Chemotherapy | cisplatin | PD |
| Page: 1 2 3 4 5 6 7 8 9 10 11 |
Top |
Related drugs of malignant transformation related genes |
| Identification of chemicals and drugs interact with genes involved in malignant transfromation |
| (DGIdb 4.0) |
| Entrez ID | Symbol | Category | Interaction Types | Drug Claim Name | Drug Name | PMIDs |
| Page: 1 |

Copyright 2023-Present -The University of Texas Health Science Center at Houston |