
|
|||||
|
 | |
| |
| |
| |
| |
| |
|
Gene: ZNF134 |
Gene summary for ZNF134 |
| Gene information | Species | Human | Gene symbol | ZNF134 | Gene ID | 7693 |
| Gene name | zinc finger protein 134 | |
| Gene Alias | pHZ-15 | |
| Cytomap | 19q13.43 | |
| Gene Type | protein-coding | GO ID | GO:0000122 | UniProtAcc | P52741 |
Top |
Malignant transformation analysis |
| Identification of the aberrant gene expression in precancerous and cancerous lesions by comparing the gene expression of stem-like cells in diseased tissues with normal stem cells |
| Entrez ID | Symbol | Replicates | Species | Organ | Tissue | Adj P-value | Log2FC | Malignancy |
| 7693 | ZNF134 | LZE24T | Human | Esophagus | ESCC | 1.60e-03 | 9.37e-02 | 0.0596 |
| 7693 | ZNF134 | P2T-E | Human | Esophagus | ESCC | 2.50e-10 | 1.84e-01 | 0.1177 |
| 7693 | ZNF134 | P8T-E | Human | Esophagus | ESCC | 3.22e-22 | 3.87e-01 | 0.0889 |
| 7693 | ZNF134 | P10T-E | Human | Esophagus | ESCC | 8.30e-28 | 5.44e-01 | 0.116 |
| 7693 | ZNF134 | P11T-E | Human | Esophagus | ESCC | 4.81e-07 | 3.35e-01 | 0.1426 |
| 7693 | ZNF134 | P12T-E | Human | Esophagus | ESCC | 2.18e-13 | 2.42e-01 | 0.1122 |
| 7693 | ZNF134 | P16T-E | Human | Esophagus | ESCC | 2.38e-12 | 2.03e-01 | 0.1153 |
| 7693 | ZNF134 | P21T-E | Human | Esophagus | ESCC | 5.70e-04 | 4.52e-02 | 0.1617 |
| 7693 | ZNF134 | P22T-E | Human | Esophagus | ESCC | 2.84e-12 | 2.30e-01 | 0.1236 |
| 7693 | ZNF134 | P24T-E | Human | Esophagus | ESCC | 6.48e-03 | 5.12e-02 | 0.1287 |
| 7693 | ZNF134 | P27T-E | Human | Esophagus | ESCC | 2.48e-30 | 1.83e-01 | 0.1055 |
| 7693 | ZNF134 | P28T-E | Human | Esophagus | ESCC | 6.58e-08 | 7.29e-02 | 0.1149 |
| 7693 | ZNF134 | P30T-E | Human | Esophagus | ESCC | 4.10e-09 | 3.16e-01 | 0.137 |
| 7693 | ZNF134 | P32T-E | Human | Esophagus | ESCC | 2.17e-06 | 1.42e-01 | 0.1666 |
| 7693 | ZNF134 | P36T-E | Human | Esophagus | ESCC | 3.88e-04 | 1.61e-01 | 0.1187 |
| 7693 | ZNF134 | P40T-E | Human | Esophagus | ESCC | 9.46e-03 | 7.23e-02 | 0.109 |
| 7693 | ZNF134 | P42T-E | Human | Esophagus | ESCC | 3.89e-05 | 1.08e-01 | 0.1175 |
| 7693 | ZNF134 | P47T-E | Human | Esophagus | ESCC | 9.91e-08 | 9.29e-02 | 0.1067 |
| 7693 | ZNF134 | P48T-E | Human | Esophagus | ESCC | 3.47e-07 | 9.41e-02 | 0.0959 |
| 7693 | ZNF134 | P52T-E | Human | Esophagus | ESCC | 7.65e-15 | 1.86e-01 | 0.1555 |
| Page: 1 2 |
| Tissue | Expression Dynamics | Abbreviation |
| Esophagus | 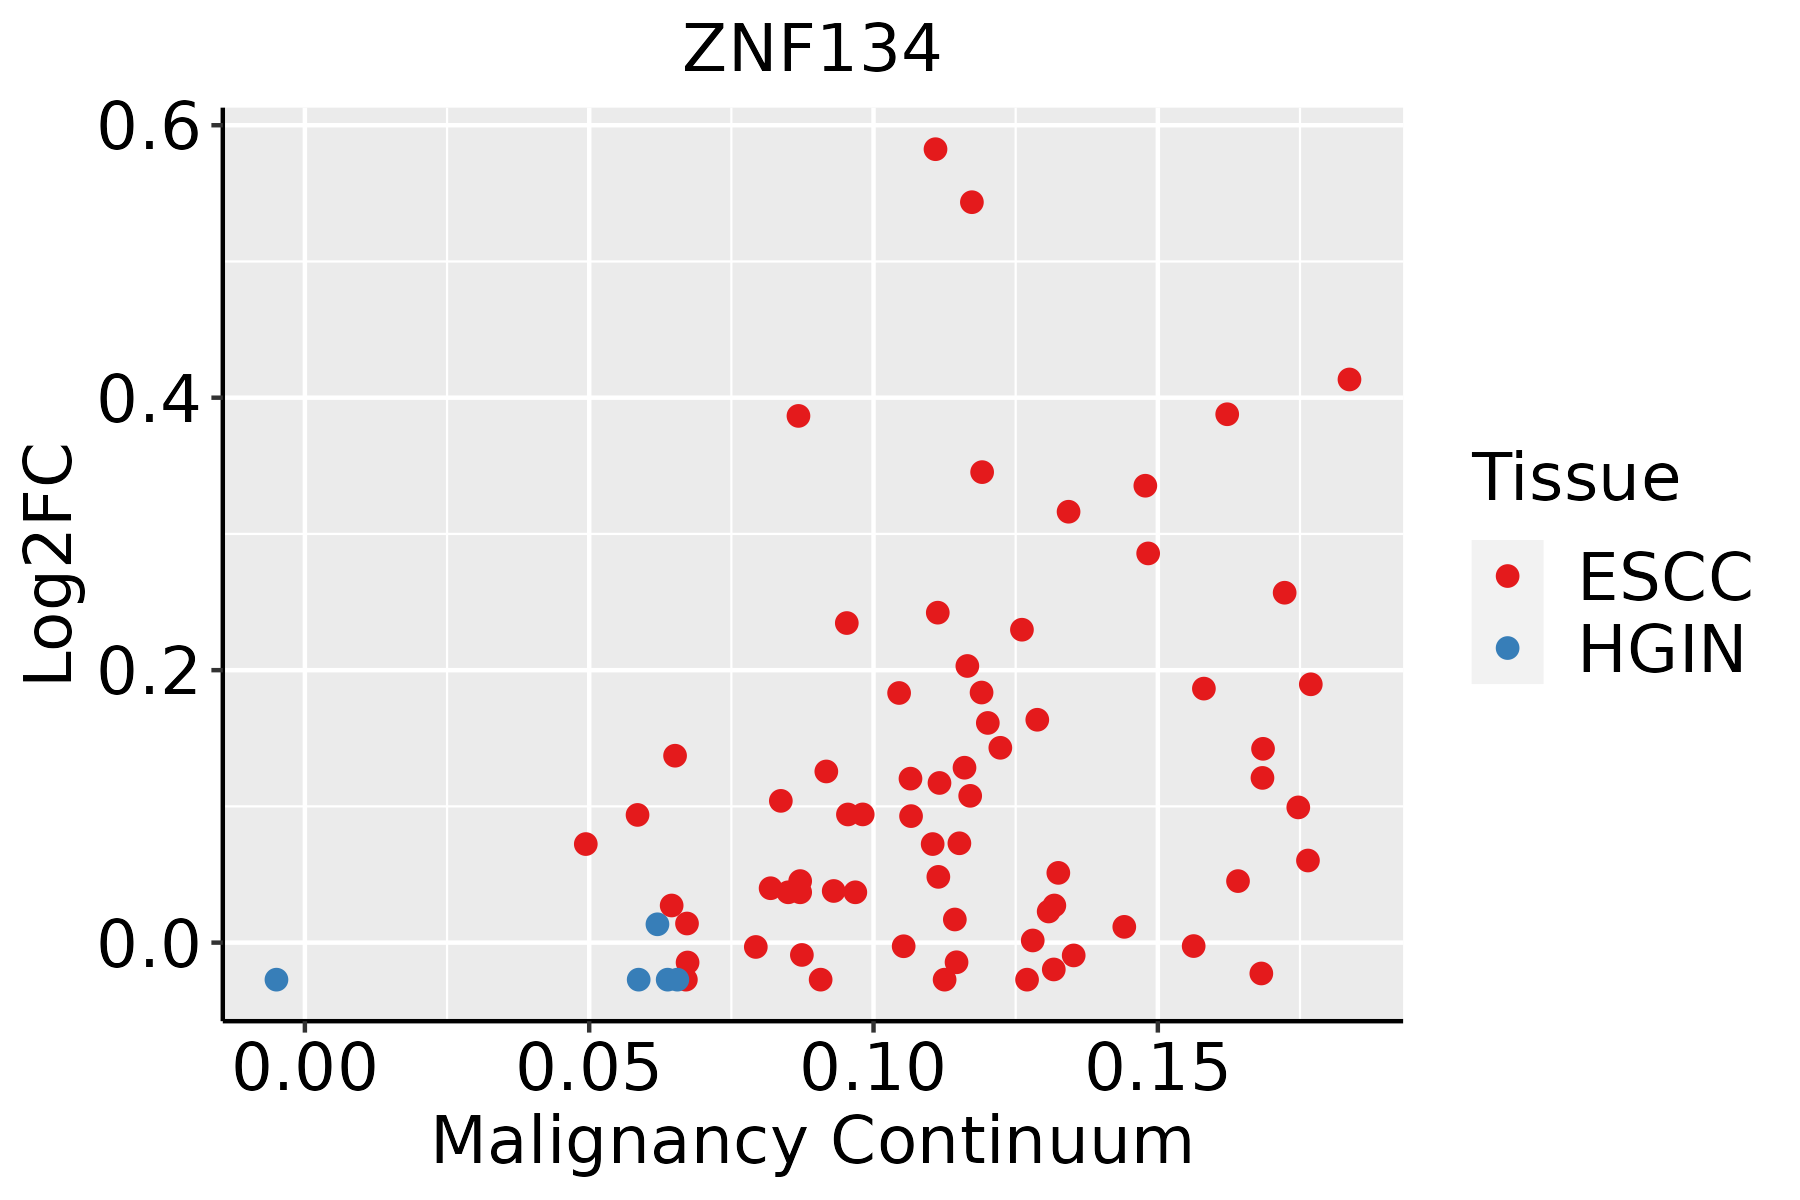 | ESCC: Esophageal squamous cell carcinoma |
| HGIN: High-grade intraepithelial neoplasias | ||
| LGIN: Low-grade intraepithelial neoplasias | ||
| Liver | 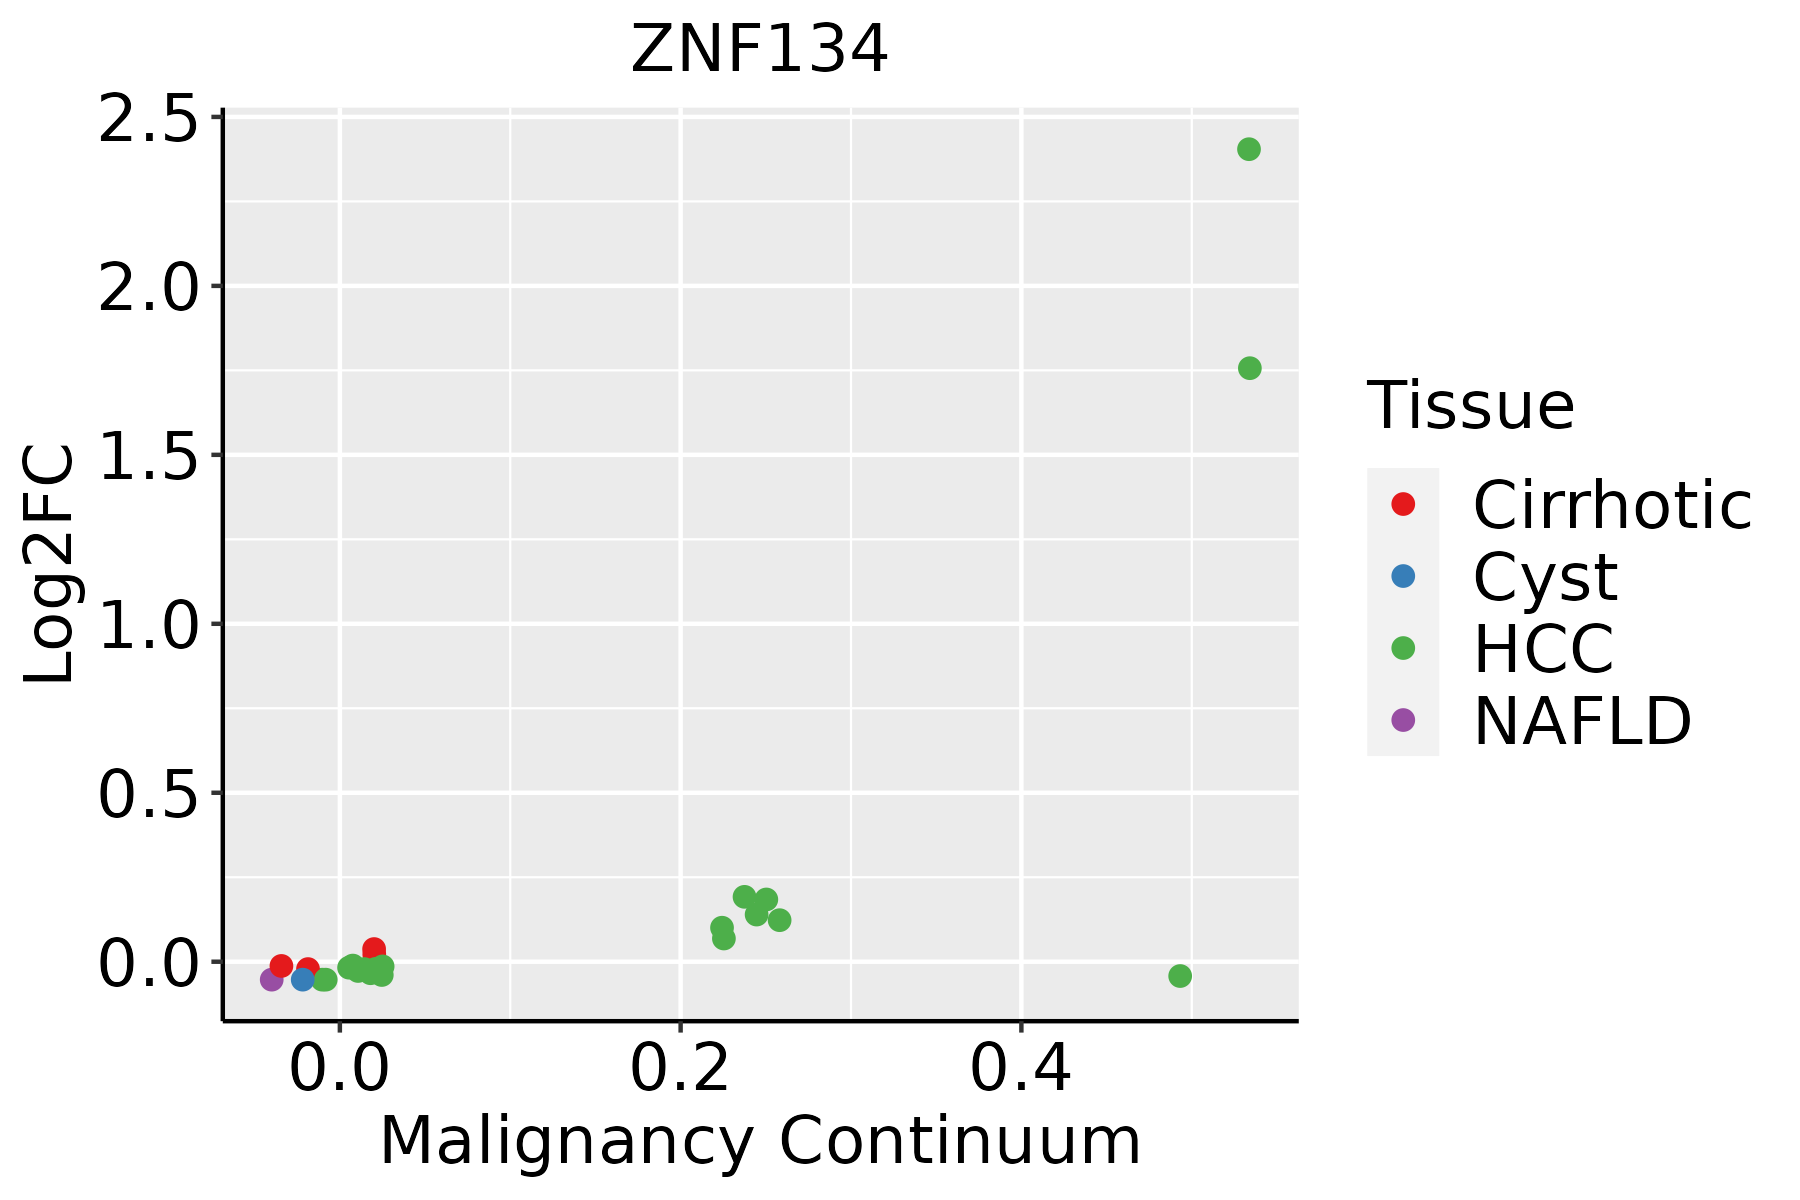 | HCC: Hepatocellular carcinoma |
| NAFLD: Non-alcoholic fatty liver disease |
| ∗log2FC in expression of this searched gene in stem-like cells from each diseased tissue sample relative to stem-like cells in normal samples in each tissue plotted against the malignancy continuum. Samples are colored based on if they are from different disease stage. |
Top |
Malignant transformation related pathway analysis |
| Find out the enriched GO biological processes and KEGG pathways involved in transition from healthy to precancer to cancer |
| Tissue | Disease Stage | Enriched GO biological Processes |
| Colorectum | AD |  |
| Colorectum | SER |  |
| Colorectum | MSS |  |
| Colorectum | MSI-H |  |
| Colorectum | FAP |  |
| ∗Top 15 enriched GO BP terms are showed in the bar plot of each disease state in each tissue. Each row represents a significant GO biological process which is colored according to the -log10(p.adjust). |
| Page: 1 2 3 4 5 6 7 8 9 |
| GO ID | Tissue | Disease Stage | Description | Gene Ratio | Bg Ratio | pvalue | p.adjust | Count |
| Page: 1 |
| Pathway ID | Tissue | Disease Stage | Description | Gene Ratio | Bg Ratio | pvalue | p.adjust | qvalue | Count |
| Page: 1 |
Top |
Cell-cell communication analysis |
| Identification of potential cell-cell interactions between two cell types and their ligand-receptor pairs for different disease states |
| Ligand | Receptor | LRpair | Pathway | Tissue | Disease Stage |
| Page: 1 |
Top |
Single-cell gene regulatory network inference analysis |
| Find out the significant the regulons (TFs) and the target genes of each regulon across cell types for different disease states |
| TF | Cell Type | Tissue | Disease Stage | Target Gene | RSS | Regulon Activity |
| ZNF134 | CD8TEFF | Breast | Precancer | DMWD,APIP,AC023157.3, etc. | 7.40e-02 |  |
| ZNF134 | TFH | Breast | Precancer | DMWD,APIP,AC023157.3, etc. | 2.98e-02 | |
| ZNF134 | QUIE | Esophagus | ADJ | KRT16,LIN54,ZNF350, etc. | 1.41e-01 |  |
| ZNF134 | PLA | Oral cavity | Healthy | TRIM24,ANO10,FOXJ2, etc. | 1.33e-01 |  |
| ZNF134 | CD8TEXP | Oral cavity | LP | TRIM24,ANO10,FOXJ2, etc. | 2.86e-02 |  |
| ZNF134 | CD8TN | Oral cavity | NEOLP | TRIM24,ANO10,FOXJ2, etc. | 1.11e-02 |  |
| ZNF134 | MAIT | Oral cavity | OSCC | TRIM24,ANO10,FOXJ2, etc. | 7.43e-03 |  |
| ZNF134 | SMC | Skin | ADJ | NFYB,STAMBP,SLMAP, etc. | 4.14e-02 |  |
| ZNF134 | SMC | Skin | AK | NFYB,STAMBP,SLMAP, etc. | 1.53e-01 |  |
| ZNF134 | SMC | Skin | cSCC | NFYB,STAMBP,SLMAP, etc. | 1.80e-02 |  |
| ∗The dot plots of a searched regulon are shown for all cell subpopulations in each disease state of each tissue based on the regulon specific score inferred using pySCENIC and by calculating the average expression. |
| Page: 1 2 |
Top |
Somatic mutation of malignant transformation related genes |
| Annotation of somatic variants for genes involved in malignant transformation |
| Hugo Symbol | Variant Class | Variant Classification | dbSNP RS | HGVSc | HGVSp | HGVSp Short | SWISSPROT | BIOTYPE | SIFT | PolyPhen | Tumor Sample Barcode | Tissue | Histology | Sex | Age | Stage | Therapy Types | Drugs | Outcome |
| ZNF134 | SNV | Missense_Mutation | novel | c.314N>T | p.Pro105Leu | p.P105L | P52741 | protein_coding | tolerated(0.3) | benign(0) | TCGA-D8-A1JT-01 | Breast | breast invasive carcinoma | Female | >=65 | I/II | Hormone Therapy | arimidex | SD |
| ZNF134 | SNV | Missense_Mutation | novel | c.1138G>C | p.Asp380His | p.D380H | P52741 | protein_coding | deleterious(0.03) | probably_damaging(0.937) | TCGA-C5-A2LV-01 | Cervix | cervical & endocervical cancer | Female | <65 | I/II | Unknown | Unknown | SD |
| ZNF134 | SNV | Missense_Mutation | c.64G>A | p.Glu22Lys | p.E22K | P52741 | protein_coding | tolerated(0.07) | benign(0.005) | TCGA-Q1-A5R2-01 | Cervix | cervical & endocervical cancer | Female | <65 | I/II | Chemotherapy | cisplatin | PR | |
| ZNF134 | SNV | Missense_Mutation | rs753867693 | c.1081G>A | p.Ala361Thr | p.A361T | P52741 | protein_coding | tolerated(0.28) | benign(0.144) | TCGA-5M-AAT6-01 | Colorectum | colon adenocarcinoma | Female | <65 | III/IV | Unknown | Unknown | PD |
| ZNF134 | SNV | Missense_Mutation | rs764224161 | c.1166N>A | p.Arg389Gln | p.R389Q | P52741 | protein_coding | tolerated(1) | benign(0.259) | TCGA-AA-3549-01 | Colorectum | colon adenocarcinoma | Male | >=65 | I/II | Unknown | Unknown | SD |
| ZNF134 | SNV | Missense_Mutation | c.1195N>T | p.Pro399Ser | p.P399S | P52741 | protein_coding | deleterious(0) | possibly_damaging(0.798) | TCGA-AA-3715-01 | Colorectum | colon adenocarcinoma | Male | >=65 | I/II | Unknown | Unknown | PD | |
| ZNF134 | SNV | Missense_Mutation | c.824T>G | p.Leu275Arg | p.L275R | P52741 | protein_coding | deleterious(0) | probably_damaging(0.998) | TCGA-AA-A00N-01 | Colorectum | colon adenocarcinoma | Male | >=65 | I/II | Unknown | Unknown | PD | |
| ZNF134 | SNV | Missense_Mutation | c.902N>A | p.Ser301Tyr | p.S301Y | P52741 | protein_coding | deleterious(0) | possibly_damaging(0.741) | TCGA-CA-6716-01 | Colorectum | colon adenocarcinoma | Male | >=65 | I/II | Chemotherapy | oxaliplatin | CR | |
| ZNF134 | SNV | Missense_Mutation | novel | c.439G>A | p.Gly147Ser | p.G147S | P52741 | protein_coding | tolerated(0.41) | benign(0) | TCGA-CA-6717-01 | Colorectum | colon adenocarcinoma | Male | <65 | I/II | Chemotherapy | oxaliplatin | CR |
| ZNF134 | SNV | Missense_Mutation | c.485N>A | p.Ser162Asn | p.S162N | P52741 | protein_coding | tolerated(0.65) | benign(0) | TCGA-CK-4951-01 | Colorectum | colon adenocarcinoma | Female | >=65 | I/II | Unknown | Unknown | PD |
| Page: 1 2 3 4 5 |
Top |
Related drugs of malignant transformation related genes |
| Identification of chemicals and drugs interact with genes involved in malignant transfromation |
| (DGIdb 4.0) |
| Entrez ID | Symbol | Category | Interaction Types | Drug Claim Name | Drug Name | PMIDs |
| 7693 | ZNF134 | NA | methylphenidate | METHYLPHENIDATE | 29382897 |
| Page: 1 |

Copyright 2023-Present -The University of Texas Health Science Center at Houston |