
|
|||||
|
 | |
| |
| |
| |
| |
| |
|
Gene: ZNF124 |
Gene summary for ZNF124 |
| Gene information | Species | Human | Gene symbol | ZNF124 | Gene ID | 7678 |
| Gene name | zinc finger protein 124 | |
| Gene Alias | HZF-16 | |
| Cytomap | 1q44 | |
| Gene Type | protein-coding | GO ID | GO:0000122 | UniProtAcc | Q15973 |
Top |
Malignant transformation analysis |
| Identification of the aberrant gene expression in precancerous and cancerous lesions by comparing the gene expression of stem-like cells in diseased tissues with normal stem cells |
| Entrez ID | Symbol | Replicates | Species | Organ | Tissue | Adj P-value | Log2FC | Malignancy |
| 7678 | ZNF124 | CCI_1 | Human | Cervix | CC | 3.91e-08 | 7.27e-01 | 0.528 |
| 7678 | ZNF124 | CCI_3 | Human | Cervix | CC | 3.23e-09 | 5.47e-01 | 0.516 |
| 7678 | ZNF124 | LZE7T | Human | Esophagus | ESCC | 6.13e-07 | 3.33e-01 | 0.0667 |
| 7678 | ZNF124 | LZE24T | Human | Esophagus | ESCC | 7.85e-14 | 3.28e-01 | 0.0596 |
| 7678 | ZNF124 | P1T-E | Human | Esophagus | ESCC | 7.11e-04 | 2.02e-01 | 0.0875 |
| 7678 | ZNF124 | P2T-E | Human | Esophagus | ESCC | 6.56e-15 | 2.58e-01 | 0.1177 |
| 7678 | ZNF124 | P4T-E | Human | Esophagus | ESCC | 1.05e-03 | 1.28e-01 | 0.1323 |
| 7678 | ZNF124 | P5T-E | Human | Esophagus | ESCC | 4.40e-09 | 1.99e-01 | 0.1327 |
| 7678 | ZNF124 | P8T-E | Human | Esophagus | ESCC | 3.75e-03 | 1.11e-01 | 0.0889 |
| 7678 | ZNF124 | P9T-E | Human | Esophagus | ESCC | 3.05e-03 | 1.20e-01 | 0.1131 |
| 7678 | ZNF124 | P10T-E | Human | Esophagus | ESCC | 9.35e-10 | 2.27e-01 | 0.116 |
| 7678 | ZNF124 | P11T-E | Human | Esophagus | ESCC | 3.75e-08 | 2.93e-01 | 0.1426 |
| 7678 | ZNF124 | P12T-E | Human | Esophagus | ESCC | 9.35e-10 | 1.76e-01 | 0.1122 |
| 7678 | ZNF124 | P15T-E | Human | Esophagus | ESCC | 5.37e-05 | 1.33e-01 | 0.1149 |
| 7678 | ZNF124 | P16T-E | Human | Esophagus | ESCC | 1.76e-12 | 2.40e-01 | 0.1153 |
| 7678 | ZNF124 | P20T-E | Human | Esophagus | ESCC | 3.11e-04 | 1.19e-01 | 0.1124 |
| 7678 | ZNF124 | P21T-E | Human | Esophagus | ESCC | 4.31e-06 | 1.27e-01 | 0.1617 |
| 7678 | ZNF124 | P22T-E | Human | Esophagus | ESCC | 3.89e-12 | 2.32e-01 | 0.1236 |
| 7678 | ZNF124 | P24T-E | Human | Esophagus | ESCC | 3.50e-02 | 8.03e-02 | 0.1287 |
| 7678 | ZNF124 | P26T-E | Human | Esophagus | ESCC | 4.17e-05 | 1.44e-01 | 0.1276 |
| Page: 1 2 3 |
| Tissue | Expression Dynamics | Abbreviation |
| Cervix | 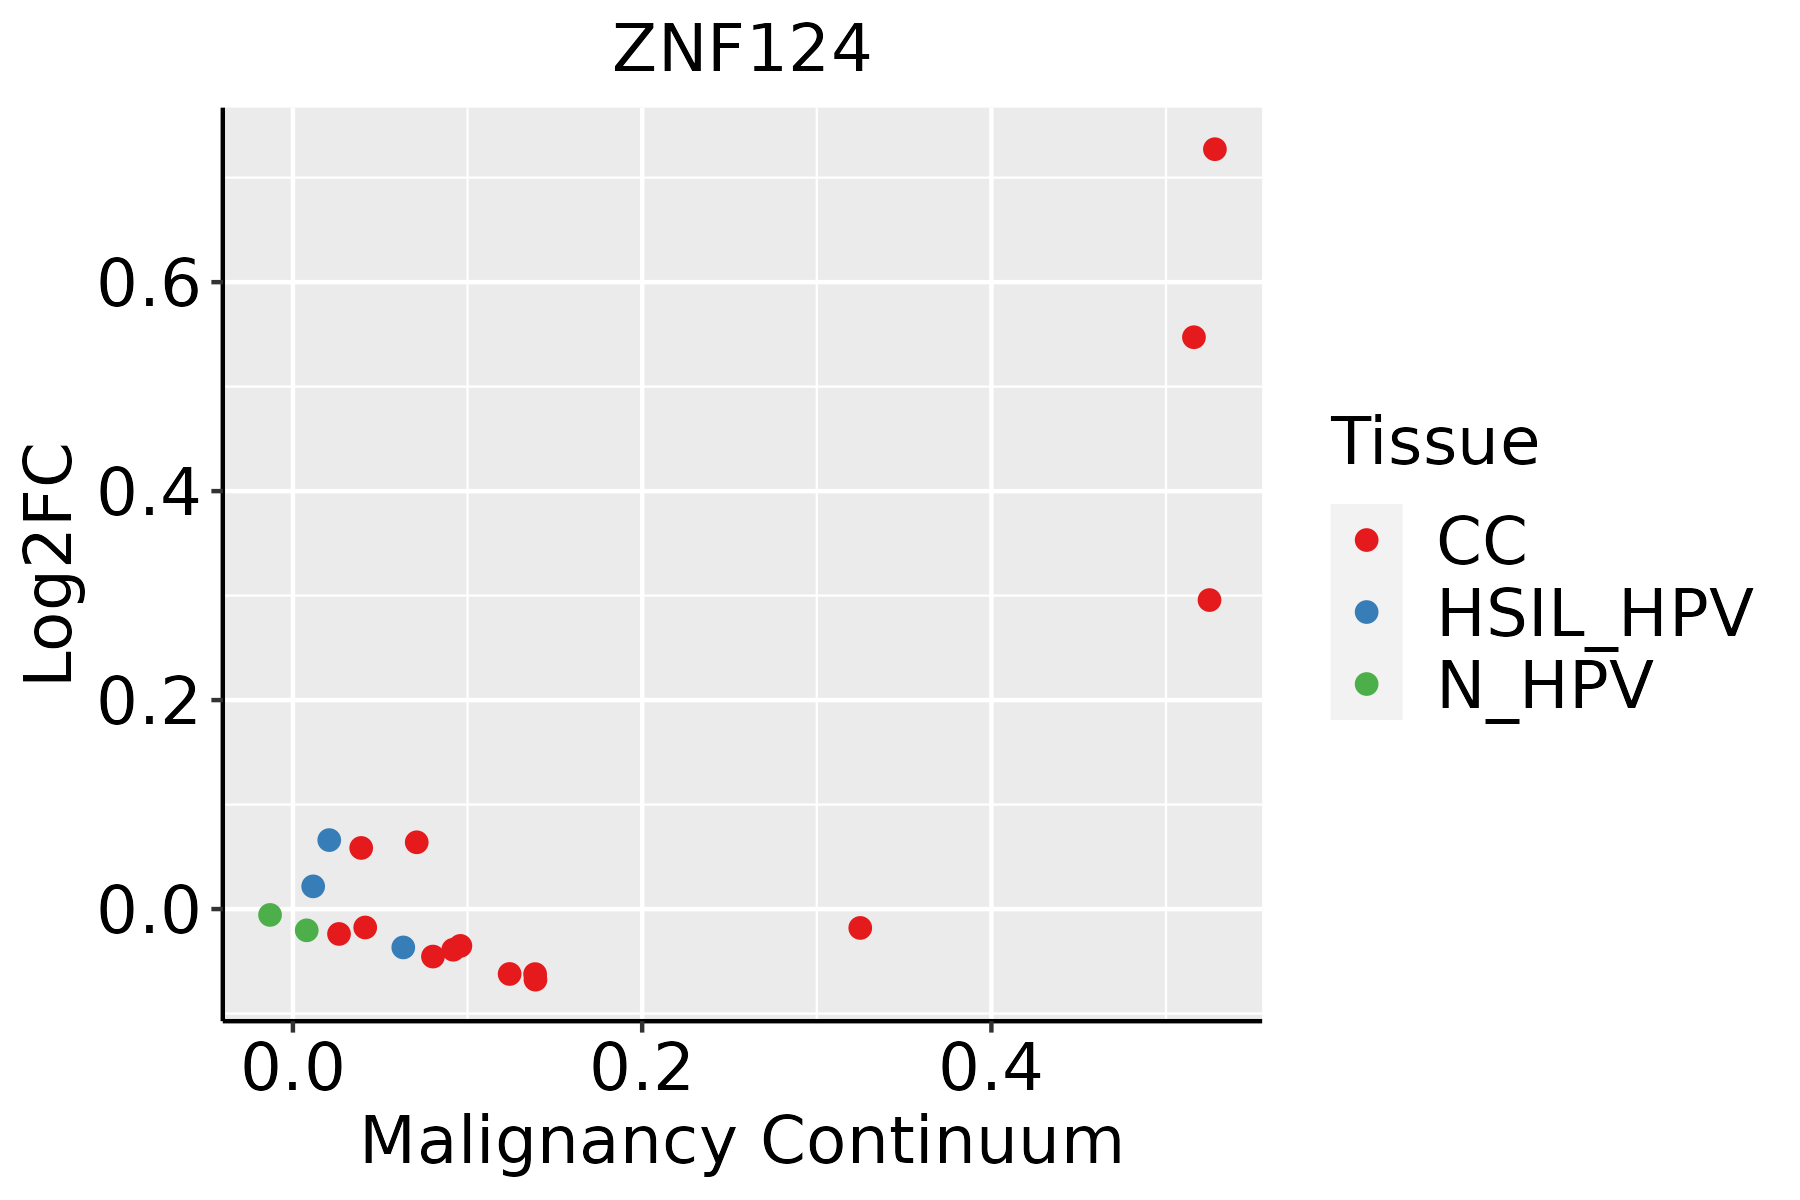 | CC: Cervix cancer |
| HSIL_HPV: HPV-infected high-grade squamous intraepithelial lesions | ||
| N_HPV: HPV-infected normal cervix | ||
| Esophagus | 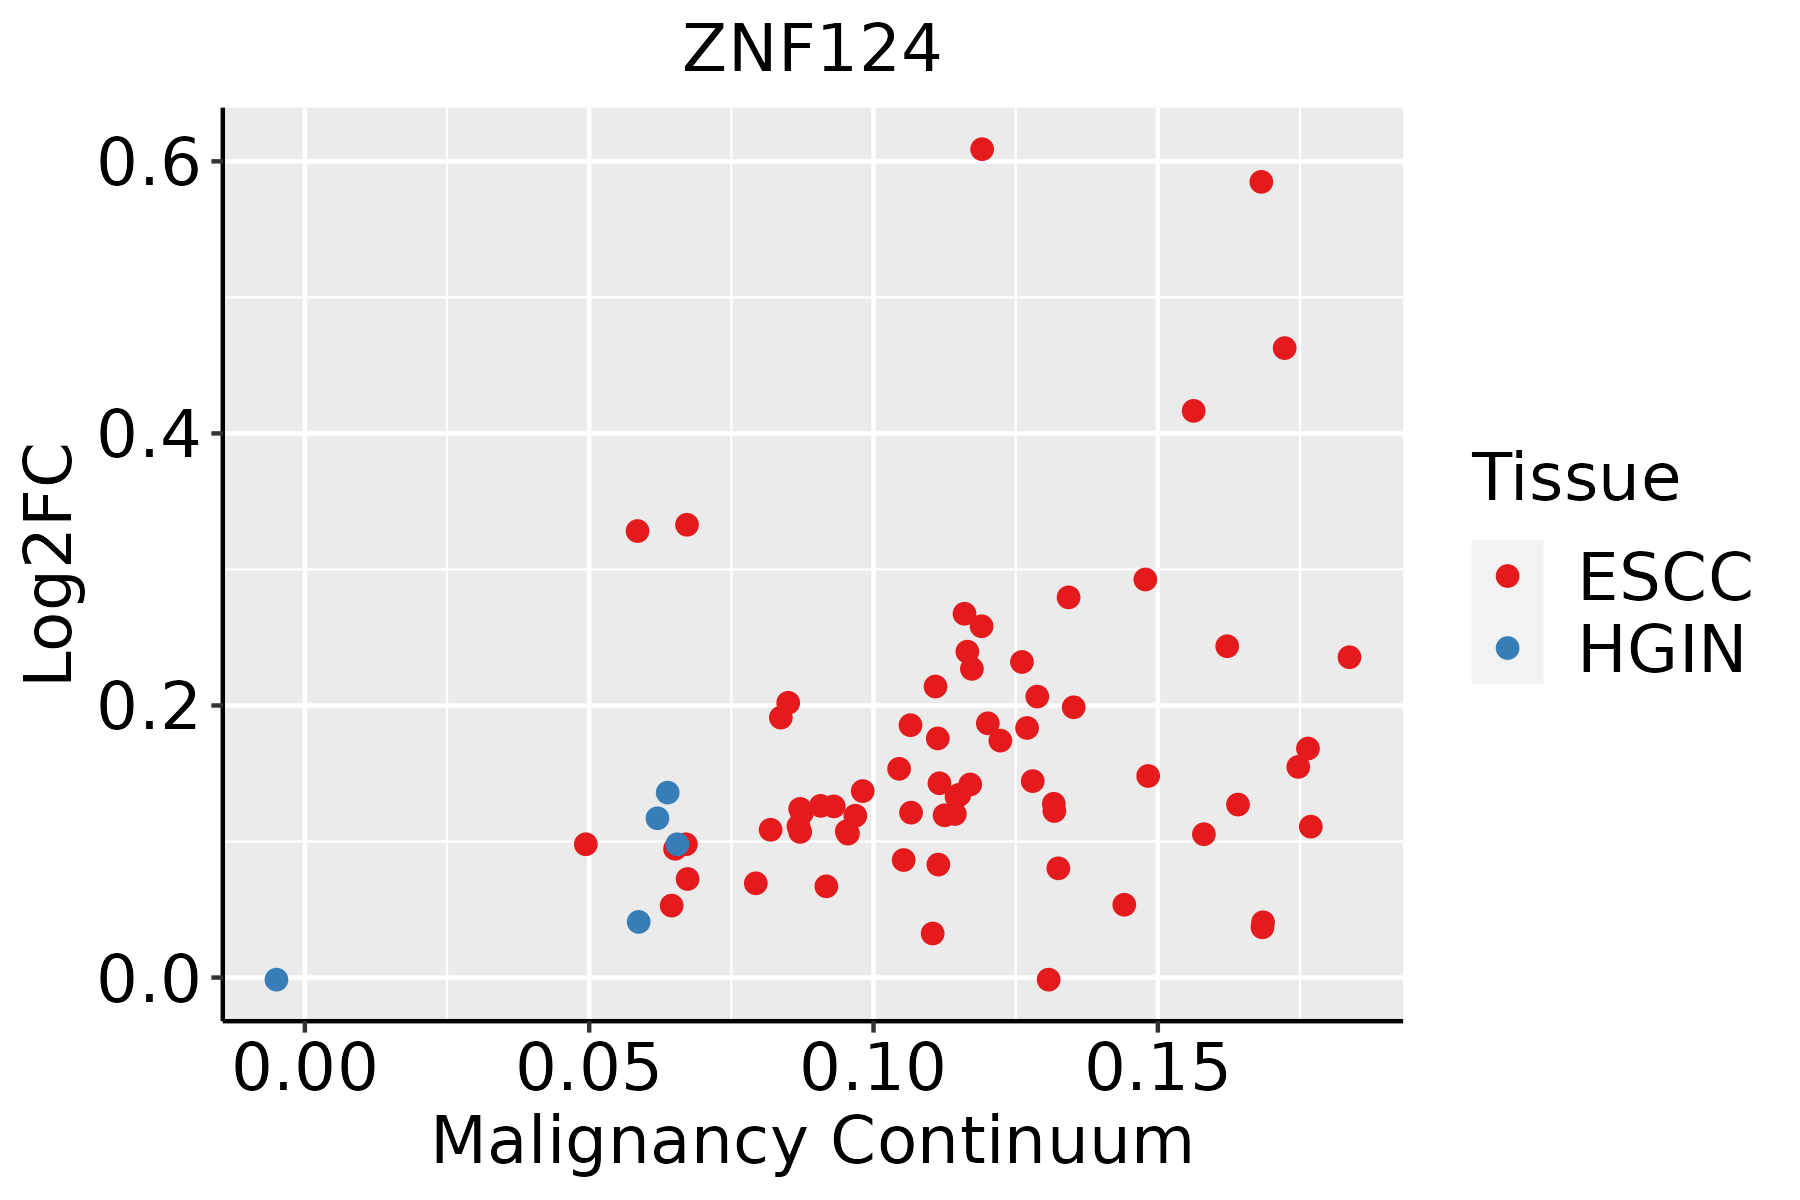 | ESCC: Esophageal squamous cell carcinoma |
| HGIN: High-grade intraepithelial neoplasias | ||
| LGIN: Low-grade intraepithelial neoplasias | ||
| Liver |  | HCC: Hepatocellular carcinoma |
| NAFLD: Non-alcoholic fatty liver disease | ||
| Lung |  | AAH: Atypical adenomatous hyperplasia |
| AIS: Adenocarcinoma in situ | ||
| IAC: Invasive lung adenocarcinoma | ||
| MIA: Minimally invasive adenocarcinoma |
| ∗log2FC in expression of this searched gene in stem-like cells from each diseased tissue sample relative to stem-like cells in normal samples in each tissue plotted against the malignancy continuum. Samples are colored based on if they are from different disease stage. |
Top |
Malignant transformation related pathway analysis |
| Find out the enriched GO biological processes and KEGG pathways involved in transition from healthy to precancer to cancer |
| Tissue | Disease Stage | Enriched GO biological Processes |
| Colorectum | AD |  |
| Colorectum | SER |  |
| Colorectum | MSS |  |
| Colorectum | MSI-H |  |
| Colorectum | FAP |  |
| ∗Top 15 enriched GO BP terms are showed in the bar plot of each disease state in each tissue. Each row represents a significant GO biological process which is colored according to the -log10(p.adjust). |
| Page: 1 2 3 4 5 6 7 8 9 |
| GO ID | Tissue | Disease Stage | Description | Gene Ratio | Bg Ratio | pvalue | p.adjust | Count |
| Page: 1 |
| Pathway ID | Tissue | Disease Stage | Description | Gene Ratio | Bg Ratio | pvalue | p.adjust | qvalue | Count |
| Page: 1 |
Top |
Cell-cell communication analysis |
| Identification of potential cell-cell interactions between two cell types and their ligand-receptor pairs for different disease states |
| Ligand | Receptor | LRpair | Pathway | Tissue | Disease Stage |
| Page: 1 |
Top |
Single-cell gene regulatory network inference analysis |
| Find out the significant the regulons (TFs) and the target genes of each regulon across cell types for different disease states |
| TF | Cell Type | Tissue | Disease Stage | Target Gene | RSS | Regulon Activity |
| ZNF124 | TREG | Colorectum | Healthy | ETV6,RAB12,TARBP1, etc. | 3.36e-02 |  |
| ZNF124 | BMEM | Lung | Healthy | VRK3,FAM162A,AIMP2, etc. | 1.35e-03 |  |
| ∗The dot plots of a searched regulon are shown for all cell subpopulations in each disease state of each tissue based on the regulon specific score inferred using pySCENIC and by calculating the average expression. |
| Page: 1 |
Top |
Somatic mutation of malignant transformation related genes |
| Annotation of somatic variants for genes involved in malignant transformation |
| Hugo Symbol | Variant Class | Variant Classification | dbSNP RS | HGVSc | HGVSp | HGVSp Short | SWISSPROT | BIOTYPE | SIFT | PolyPhen | Tumor Sample Barcode | Tissue | Histology | Sex | Age | Stage | Therapy Types | Drugs | Outcome |
| ZNF124 | SNV | Missense_Mutation | rs772443563 | c.589G>C | p.Glu197Gln | p.E197Q | Q15973 | protein_coding | deleterious(0.02) | benign(0.009) | TCGA-AC-A23H-01 | Breast | breast invasive carcinoma | Female | >=65 | I/II | Unknown | Unknown | PD |
| ZNF124 | SNV | Missense_Mutation | c.691N>C | p.Glu231Gln | p.E231Q | Q15973 | protein_coding | deleterious(0) | possibly_damaging(0.786) | TCGA-D8-A27G-01 | Breast | breast invasive carcinoma | Female | >=65 | I/II | Unknown | Unknown | SD | |
| ZNF124 | SNV | Missense_Mutation | novel | c.206C>T | p.Ser69Leu | p.S69L | Q15973 | protein_coding | tolerated(0.3) | benign(0.007) | TCGA-XX-A89A-01 | Breast | breast invasive carcinoma | Female | >=65 | I/II | Unknown | Unknown | SD |
| ZNF124 | SNV | Missense_Mutation | rs372024301 | c.647G>A | p.Arg216His | p.R216H | Q15973 | protein_coding | tolerated(0.45) | benign(0.062) | TCGA-2W-A8YY-01 | Cervix | cervical & endocervical cancer | Female | <65 | I/II | Chemotherapy | cisplatin | CR |
| ZNF124 | SNV | Missense_Mutation | rs748406955 | c.916C>T | p.Arg306Cys | p.R306C | Q15973 | protein_coding | deleterious(0) | possibly_damaging(0.843) | TCGA-AA-A00N-01 | Colorectum | colon adenocarcinoma | Male | >=65 | I/II | Unknown | Unknown | PD |
| ZNF124 | SNV | Missense_Mutation | c.612N>C | p.Lys204Asn | p.K204N | Q15973 | protein_coding | deleterious(0) | possibly_damaging(0.513) | TCGA-AU-6004-01 | Colorectum | colon adenocarcinoma | Female | >=65 | I/II | Unknown | Unknown | SD | |
| ZNF124 | SNV | Missense_Mutation | c.203C>A | p.Ser68Tyr | p.S68Y | Q15973 | protein_coding | tolerated(0.52) | benign(0.147) | TCGA-AZ-4315-01 | Colorectum | colon adenocarcinoma | Male | <65 | I/II | Unknown | Unknown | SD | |
| ZNF124 | SNV | Missense_Mutation | novel | c.715N>C | p.Cys239Arg | p.C239R | Q15973 | protein_coding | deleterious(0) | probably_damaging(1) | TCGA-CA-6717-01 | Colorectum | colon adenocarcinoma | Male | <65 | I/II | Chemotherapy | oxaliplatin | CR |
| ZNF124 | insertion | Frame_Shift_Ins | novel | c.640_641insA | p.Ala214AspfsTer12 | p.A214Dfs*12 | Q15973 | protein_coding | TCGA-AA-3939-01 | Colorectum | colon adenocarcinoma | Male | >=65 | I/II | Unknown | Unknown | SD | ||
| ZNF124 | insertion | Frame_Shift_Ins | rs755727997 | c.1051dupA | p.Met351AsnfsTer28 | p.M351Nfs*28 | Q15973 | protein_coding | TCGA-AA-A022-01 | Colorectum | colon adenocarcinoma | Female | >=65 | I/II | Unknown | Unknown | SD |
| Page: 1 2 3 4 5 |
Top |
Related drugs of malignant transformation related genes |
| Identification of chemicals and drugs interact with genes involved in malignant transfromation |
| (DGIdb 4.0) |
| Entrez ID | Symbol | Category | Interaction Types | Drug Claim Name | Drug Name | PMIDs |
| Page: 1 |

Copyright 2023-Present -The University of Texas Health Science Center at Houston |