
|
|||||
|
 | |
| |
| |
| |
| |
| |
|
Gene: ZNF12 |
Gene summary for ZNF12 |
| Gene information | Species | Human | Gene symbol | ZNF12 | Gene ID | 7559 |
| Gene name | zinc finger protein 12 | |
| Gene Alias | GIOT-3 | |
| Cytomap | 7p22.1 | |
| Gene Type | protein-coding | GO ID | GO:0006139 | UniProtAcc | P17014 |
Top |
Malignant transformation analysis |
| Identification of the aberrant gene expression in precancerous and cancerous lesions by comparing the gene expression of stem-like cells in diseased tissues with normal stem cells |
| Entrez ID | Symbol | Replicates | Species | Organ | Tissue | Adj P-value | Log2FC | Malignancy |
| 7559 | ZNF12 | HCC1_Meng | Human | Liver | HCC | 3.11e-43 | 3.90e-02 | 0.0246 |
| 7559 | ZNF12 | HCC2_Meng | Human | Liver | HCC | 5.26e-08 | 4.30e-02 | 0.0107 |
| 7559 | ZNF12 | HCC2 | Human | Liver | HCC | 4.14e-07 | 2.94e+00 | 0.5341 |
| 7559 | ZNF12 | S014 | Human | Liver | HCC | 7.74e-05 | 2.66e-01 | 0.2254 |
| 7559 | ZNF12 | S016 | Human | Liver | HCC | 3.12e-04 | 3.03e-01 | 0.2243 |
| 7559 | ZNF12 | S027 | Human | Liver | HCC | 1.48e-09 | 7.20e-01 | 0.2446 |
| 7559 | ZNF12 | S028 | Human | Liver | HCC | 4.75e-28 | 9.13e-01 | 0.2503 |
| 7559 | ZNF12 | S029 | Human | Liver | HCC | 4.09e-17 | 7.89e-01 | 0.2581 |
| 7559 | ZNF12 | C21 | Human | Oral cavity | OSCC | 6.29e-10 | 3.47e-01 | 0.2678 |
| 7559 | ZNF12 | C30 | Human | Oral cavity | OSCC | 7.36e-17 | 6.08e-01 | 0.3055 |
| 7559 | ZNF12 | C38 | Human | Oral cavity | OSCC | 4.02e-08 | 5.92e-01 | 0.172 |
| 7559 | ZNF12 | C43 | Human | Oral cavity | OSCC | 3.36e-05 | 1.36e-01 | 0.1704 |
| 7559 | ZNF12 | C46 | Human | Oral cavity | OSCC | 2.54e-04 | 1.58e-01 | 0.1673 |
| 7559 | ZNF12 | C51 | Human | Oral cavity | OSCC | 4.09e-02 | 2.31e-01 | 0.2674 |
| 7559 | ZNF12 | C08 | Human | Oral cavity | OSCC | 6.15e-21 | 3.98e-01 | 0.1919 |
| 7559 | ZNF12 | LP15 | Human | Oral cavity | LP | 4.26e-02 | 3.20e-01 | 0.2174 |
| 7559 | ZNF12 | SYSMH1 | Human | Oral cavity | OSCC | 3.77e-08 | 2.15e-01 | 0.1127 |
| 7559 | ZNF12 | SYSMH2 | Human | Oral cavity | OSCC | 4.37e-07 | 1.90e-01 | 0.2326 |
| 7559 | ZNF12 | SYSMH3 | Human | Oral cavity | OSCC | 2.70e-03 | 1.77e-01 | 0.2442 |
| 7559 | ZNF12 | male-WTA | Human | Thyroid | PTC | 7.11e-09 | 6.13e-02 | 0.1037 |
| Page: 1 2 |
| Tissue | Expression Dynamics | Abbreviation |
| Liver | 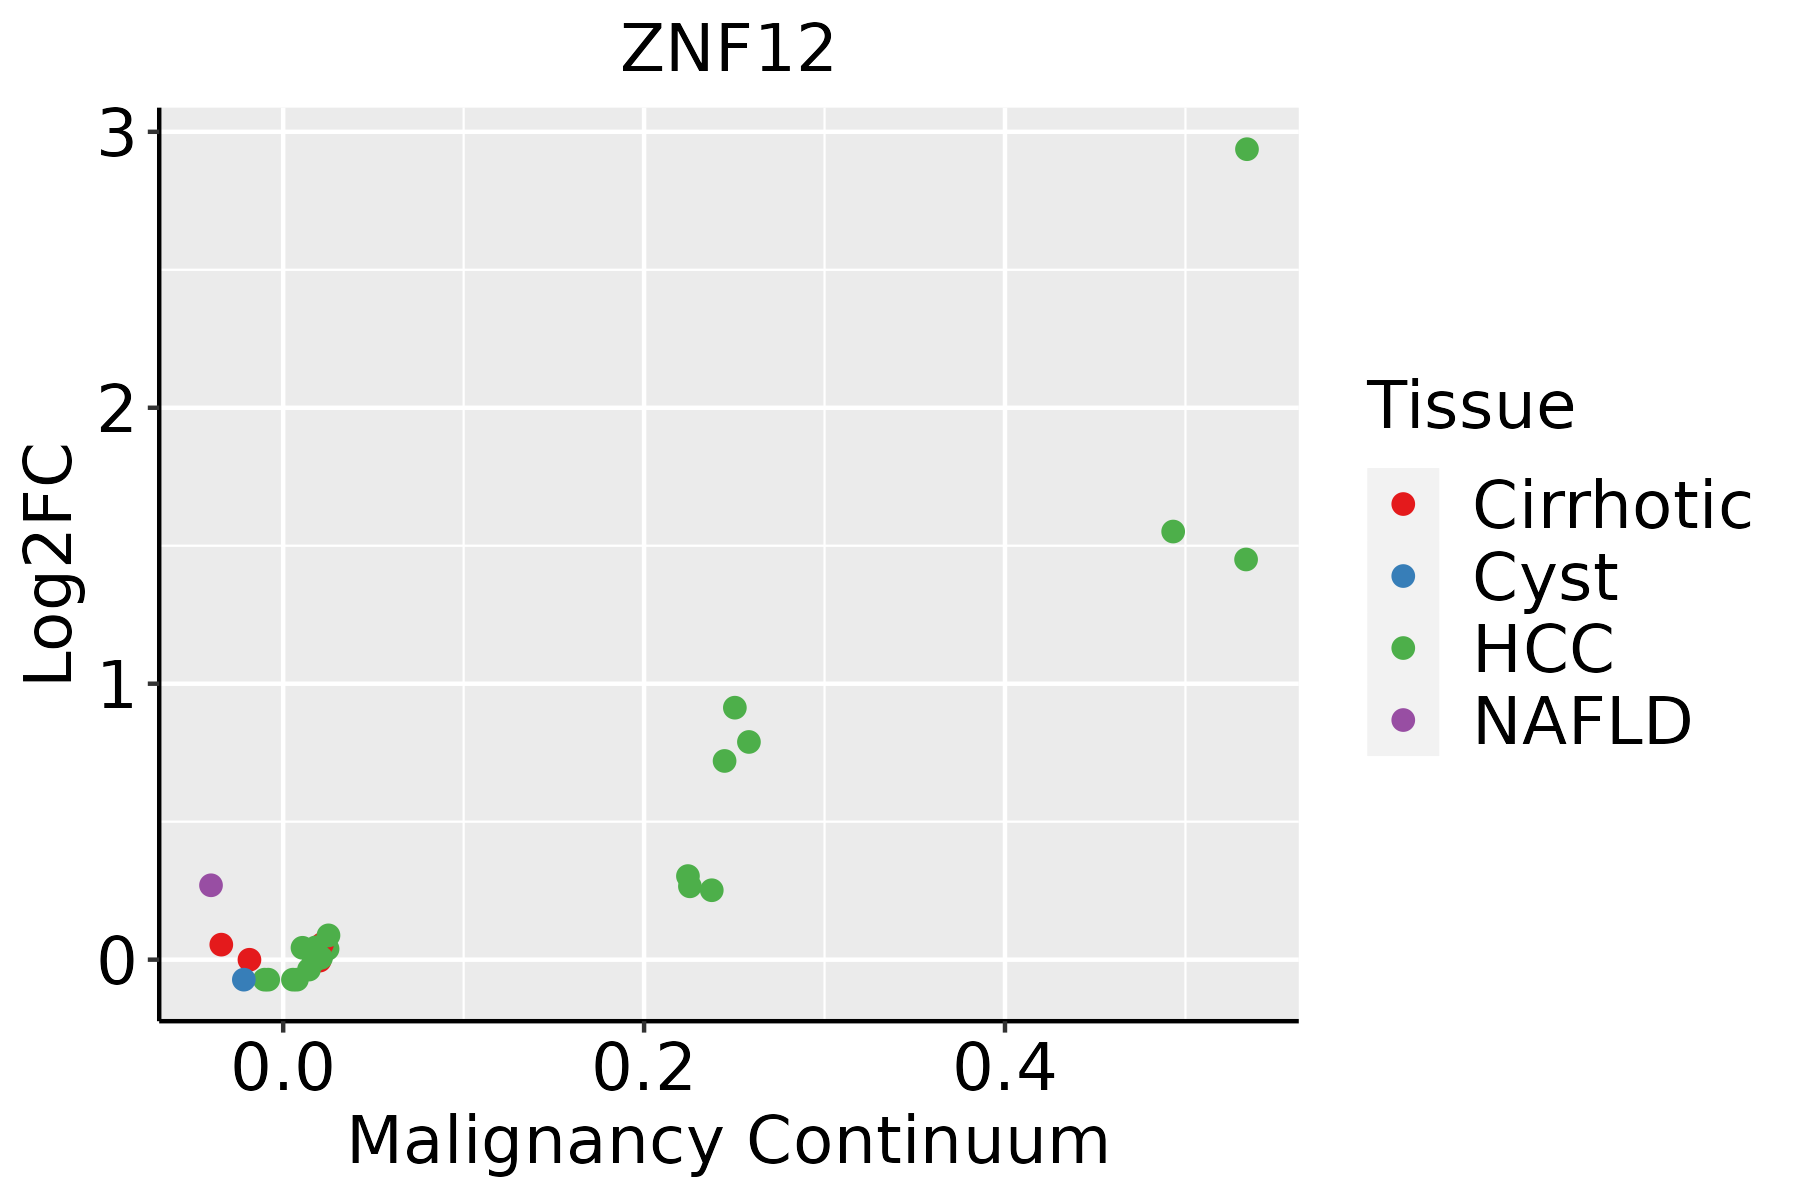 | HCC: Hepatocellular carcinoma |
| NAFLD: Non-alcoholic fatty liver disease | ||
| Oral Cavity |  | EOLP: Erosive Oral lichen planus |
| LP: leukoplakia | ||
| NEOLP: Non-erosive oral lichen planus | ||
| OSCC: Oral squamous cell carcinoma | ||
| Thyroid | 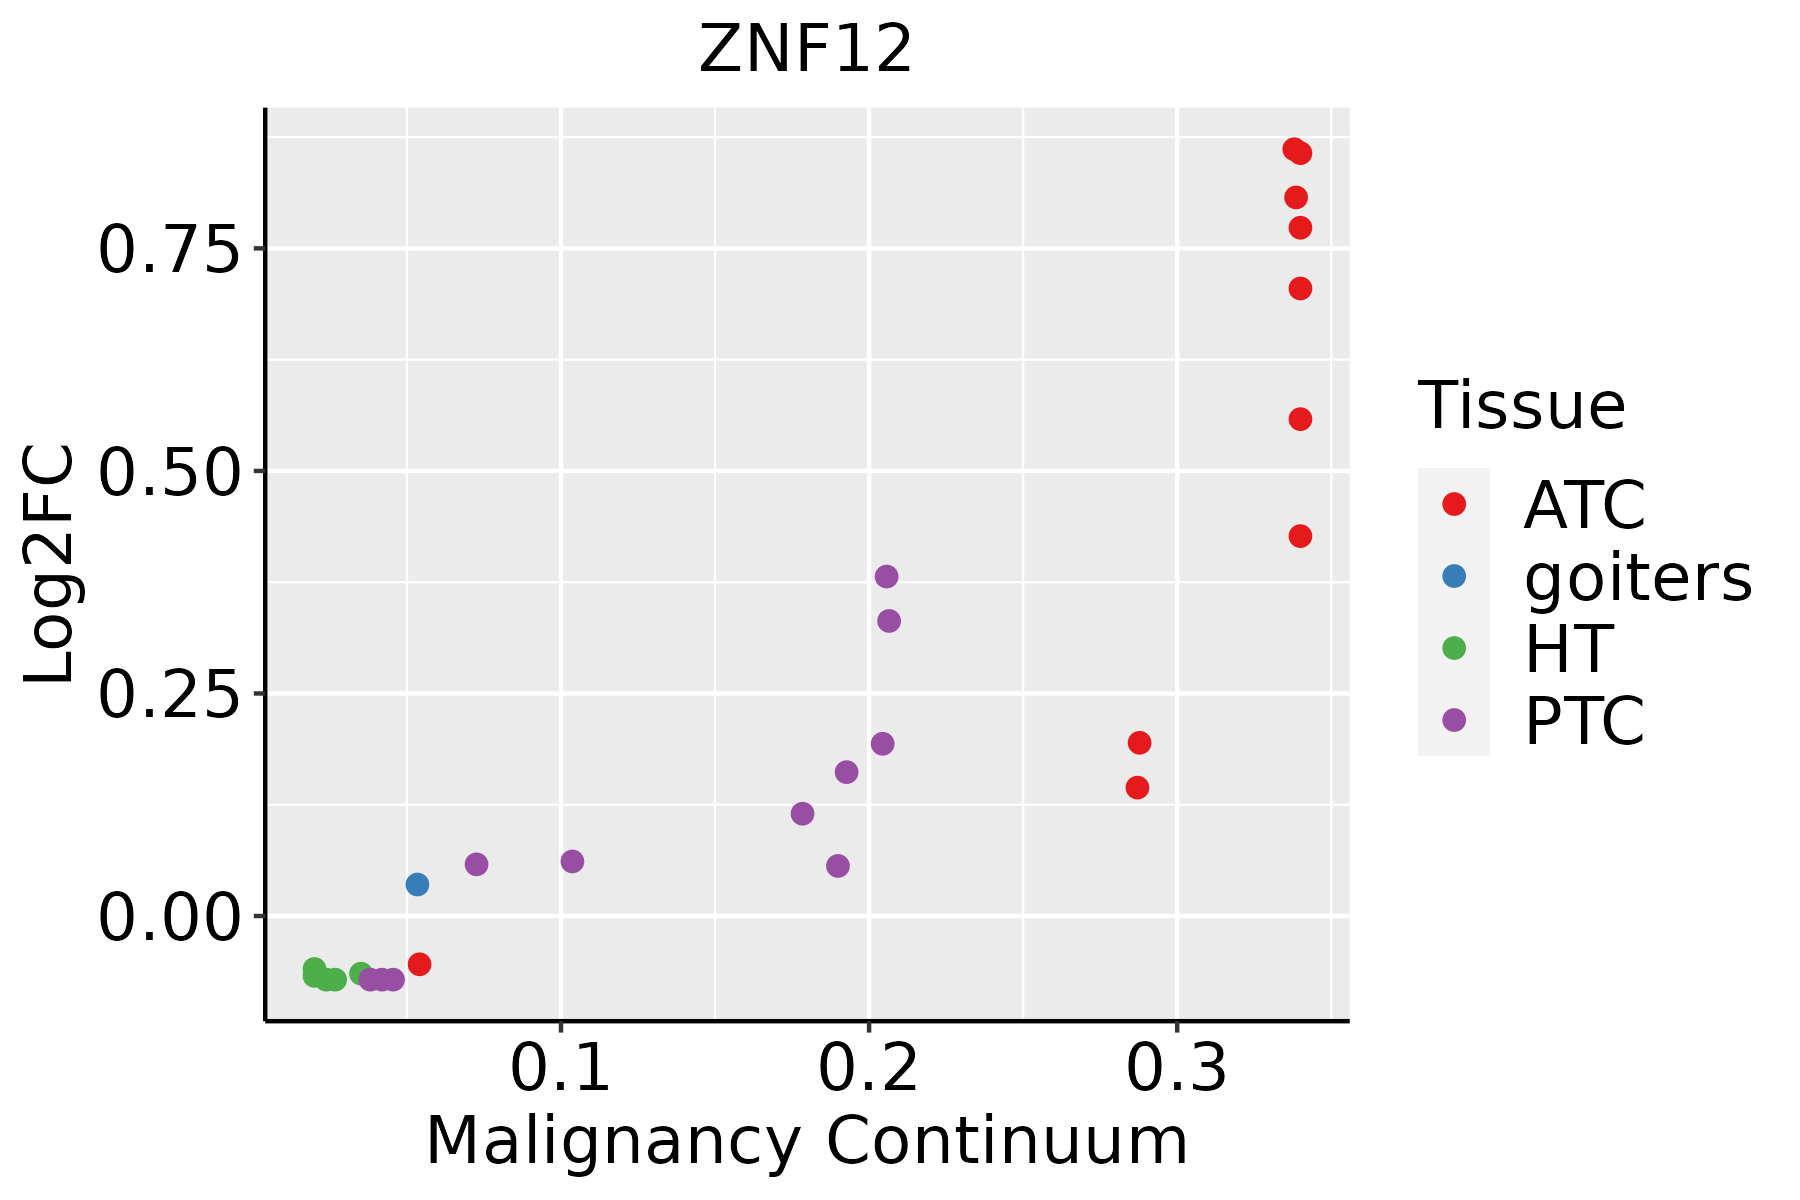 | ATC: Anaplastic thyroid cancer |
| HT: Hashimoto's thyroiditis | ||
| PTC: Papillary thyroid cancer |
| ∗log2FC in expression of this searched gene in stem-like cells from each diseased tissue sample relative to stem-like cells in normal samples in each tissue plotted against the malignancy continuum. Samples are colored based on if they are from different disease stage. |
Top |
Malignant transformation related pathway analysis |
| Find out the enriched GO biological processes and KEGG pathways involved in transition from healthy to precancer to cancer |
| Tissue | Disease Stage | Enriched GO biological Processes |
| Colorectum | AD |  |
| Colorectum | SER |  |
| Colorectum | MSS |  |
| Colorectum | MSI-H |  |
| Colorectum | FAP |  |
| ∗Top 15 enriched GO BP terms are showed in the bar plot of each disease state in each tissue. Each row represents a significant GO biological process which is colored according to the -log10(p.adjust). |
| Page: 1 2 3 4 5 6 7 8 9 |
| GO ID | Tissue | Disease Stage | Description | Gene Ratio | Bg Ratio | pvalue | p.adjust | Count |
| Page: 1 |
| Pathway ID | Tissue | Disease Stage | Description | Gene Ratio | Bg Ratio | pvalue | p.adjust | qvalue | Count |
| Page: 1 |
Top |
Cell-cell communication analysis |
| Identification of potential cell-cell interactions between two cell types and their ligand-receptor pairs for different disease states |
| Ligand | Receptor | LRpair | Pathway | Tissue | Disease Stage |
| Page: 1 |
Top |
Single-cell gene regulatory network inference analysis |
| Find out the significant the regulons (TFs) and the target genes of each regulon across cell types for different disease states |
| TF | Cell Type | Tissue | Disease Stage | Target Gene | RSS | Regulon Activity |
| ZNF12 | ECC | Skin | ADJ | STEAP2,BMT2,SHLD1, etc. | 9.02e-02 |  |
| ∗The dot plots of a searched regulon are shown for all cell subpopulations in each disease state of each tissue based on the regulon specific score inferred using pySCENIC and by calculating the average expression. |
| Page: 1 |
Top |
Somatic mutation of malignant transformation related genes |
| Annotation of somatic variants for genes involved in malignant transformation |
| Hugo Symbol | Variant Class | Variant Classification | dbSNP RS | HGVSc | HGVSp | HGVSp Short | SWISSPROT | BIOTYPE | SIFT | PolyPhen | Tumor Sample Barcode | Tissue | Histology | Sex | Age | Stage | Therapy Types | Drugs | Outcome |
| ZNF12 | SNV | Missense_Mutation | c.1751N>G | p.Lys584Arg | p.K584R | P17014 | protein_coding | deleterious(0.02) | probably_damaging(0.997) | TCGA-C8-A135-01 | Breast | breast invasive carcinoma | Female | <65 | I/II | Chemotherapy | 5-fluorouracil | CR | |
| ZNF12 | SNV | Missense_Mutation | c.1848G>C | p.Gln616His | p.Q616H | P17014 | protein_coding | tolerated(0.44) | probably_damaging(0.997) | TCGA-D8-A1J8-01 | Breast | breast invasive carcinoma | Female | >=65 | I/II | Hormone Therapy | nolvadex | SD | |
| ZNF12 | SNV | Missense_Mutation | c.685G>A | p.Asp229Asn | p.D229N | P17014 | protein_coding | tolerated(0.14) | benign(0.001) | TCGA-EW-A1P8-01 | Breast | breast invasive carcinoma | Female | <65 | III/IV | Chemotherapy | fluorouracil | PD | |
| ZNF12 | SNV | Missense_Mutation | c.737N>G | p.Ser246Cys | p.S246C | P17014 | protein_coding | tolerated(1) | possibly_damaging(0.778) | TCGA-GM-A2D9-01 | Breast | breast invasive carcinoma | Female | >=65 | I/II | Hormone Therapy | arimidex | SD | |
| ZNF12 | insertion | Frame_Shift_Ins | novel | c.723_724insCAGAGAAC | p.Lys242GlnfsTer10 | p.K242Qfs*10 | P17014 | protein_coding | TCGA-A8-A08H-01 | Breast | breast invasive carcinoma | Female | >=65 | I/II | Unknown | Unknown | SD | ||
| ZNF12 | SNV | Missense_Mutation | rs575444294 | c.659T>G | p.Ile220Ser | p.I220S | P17014 | protein_coding | tolerated(0.71) | benign(0.024) | TCGA-2W-A8YY-01 | Cervix | cervical & endocervical cancer | Female | <65 | I/II | Chemotherapy | cisplatin | CR |
| ZNF12 | SNV | Missense_Mutation | c.1678C>G | p.Gln560Glu | p.Q560E | P17014 | protein_coding | tolerated(0.32) | benign(0.003) | TCGA-IR-A3LA-01 | Cervix | cervical & endocervical cancer | Female | <65 | I/II | Chemotherapy | cisplatin | CR | |
| ZNF12 | SNV | Missense_Mutation | c.1909N>C | p.Glu637Gln | p.E637Q | P17014 | protein_coding | tolerated(0.07) | benign(0.182) | TCGA-JW-A5VJ-01 | Cervix | cervical & endocervical cancer | Female | <65 | I/II | Unknown | Unknown | PD | |
| ZNF12 | SNV | Missense_Mutation | c.1379C>T | p.Ser460Leu | p.S460L | P17014 | protein_coding | tolerated(0.33) | benign(0.01) | TCGA-Q1-A73O-01 | Cervix | cervical & endocervical cancer | Female | <65 | I/II | Chemotherapy | cisplatin | CR | |
| ZNF12 | SNV | Missense_Mutation | novel | c.589N>A | p.Glu197Lys | p.E197K | P17014 | protein_coding | tolerated(1) | benign(0) | TCGA-VS-A959-01 | Cervix | cervical & endocervical cancer | Female | >=65 | I/II | Unknown | Unknown | SD |
| Page: 1 2 3 4 5 6 7 8 9 |
Top |
Related drugs of malignant transformation related genes |
| Identification of chemicals and drugs interact with genes involved in malignant transfromation |
| (DGIdb 4.0) |
| Entrez ID | Symbol | Category | Interaction Types | Drug Claim Name | Drug Name | PMIDs |
| Page: 1 |

Copyright 2023-Present -The University of Texas Health Science Center at Houston |