
|
|||||
|
 | |
| |
| |
| |
| |
| |
|
Gene: ZNF117 |
Gene summary for ZNF117 |
| Gene information | Species | Human | Gene symbol | ZNF117 | Gene ID | 51351 |
| Gene name | zinc finger protein 117 | |
| Gene Alias | H-plk | |
| Cytomap | 7q11.21 | |
| Gene Type | protein-coding | GO ID | GO:0006139 | UniProtAcc | Q03924 |
Top |
Malignant transformation analysis |
| Identification of the aberrant gene expression in precancerous and cancerous lesions by comparing the gene expression of stem-like cells in diseased tissues with normal stem cells |
| Entrez ID | Symbol | Replicates | Species | Organ | Tissue | Adj P-value | Log2FC | Malignancy |
| 51351 | ZNF117 | HCC2_Meng | Human | Liver | HCC | 5.53e-05 | 6.28e-02 | 0.0107 |
| 51351 | ZNF117 | HCC2 | Human | Liver | HCC | 9.60e-05 | 1.99e+00 | 0.5341 |
| 51351 | ZNF117 | S027 | Human | Liver | HCC | 3.80e-18 | 1.18e+00 | 0.2446 |
| 51351 | ZNF117 | S028 | Human | Liver | HCC | 4.27e-37 | 1.48e+00 | 0.2503 |
| 51351 | ZNF117 | S029 | Human | Liver | HCC | 2.29e-35 | 1.67e+00 | 0.2581 |
| 51351 | ZNF117 | C21 | Human | Oral cavity | OSCC | 4.19e-19 | 1.22e+00 | 0.2678 |
| 51351 | ZNF117 | C43 | Human | Oral cavity | OSCC | 2.81e-06 | 1.92e-01 | 0.1704 |
| 51351 | ZNF117 | C46 | Human | Oral cavity | OSCC | 8.29e-05 | 1.28e-01 | 0.1673 |
| 51351 | ZNF117 | C51 | Human | Oral cavity | OSCC | 5.59e-06 | 2.81e-01 | 0.2674 |
| 51351 | ZNF117 | C57 | Human | Oral cavity | OSCC | 6.20e-13 | 4.06e-01 | 0.1679 |
| 51351 | ZNF117 | C08 | Human | Oral cavity | OSCC | 3.47e-36 | 7.71e-01 | 0.1919 |
| 51351 | ZNF117 | LN22 | Human | Oral cavity | OSCC | 4.38e-03 | 5.20e-01 | 0.1733 |
| 51351 | ZNF117 | SYSMH1 | Human | Oral cavity | OSCC | 6.51e-07 | 2.15e-01 | 0.1127 |
| 51351 | ZNF117 | SYSMH6 | Human | Oral cavity | OSCC | 3.52e-03 | 9.86e-02 | 0.1275 |
| 51351 | ZNF117 | male-WTA | Human | Thyroid | PTC | 6.61e-10 | 1.19e-01 | 0.1037 |
| 51351 | ZNF117 | PTC01 | Human | Thyroid | PTC | 3.74e-03 | 9.35e-02 | 0.1899 |
| 51351 | ZNF117 | PTC04 | Human | Thyroid | PTC | 1.04e-15 | 2.89e-01 | 0.1927 |
| 51351 | ZNF117 | PTC05 | Human | Thyroid | PTC | 2.70e-17 | 6.77e-01 | 0.2065 |
| 51351 | ZNF117 | PTC06 | Human | Thyroid | PTC | 1.70e-24 | 6.21e-01 | 0.2057 |
| 51351 | ZNF117 | PTC07 | Human | Thyroid | PTC | 2.26e-09 | 2.16e-01 | 0.2044 |
| Page: 1 2 |
| Tissue | Expression Dynamics | Abbreviation |
| Liver | 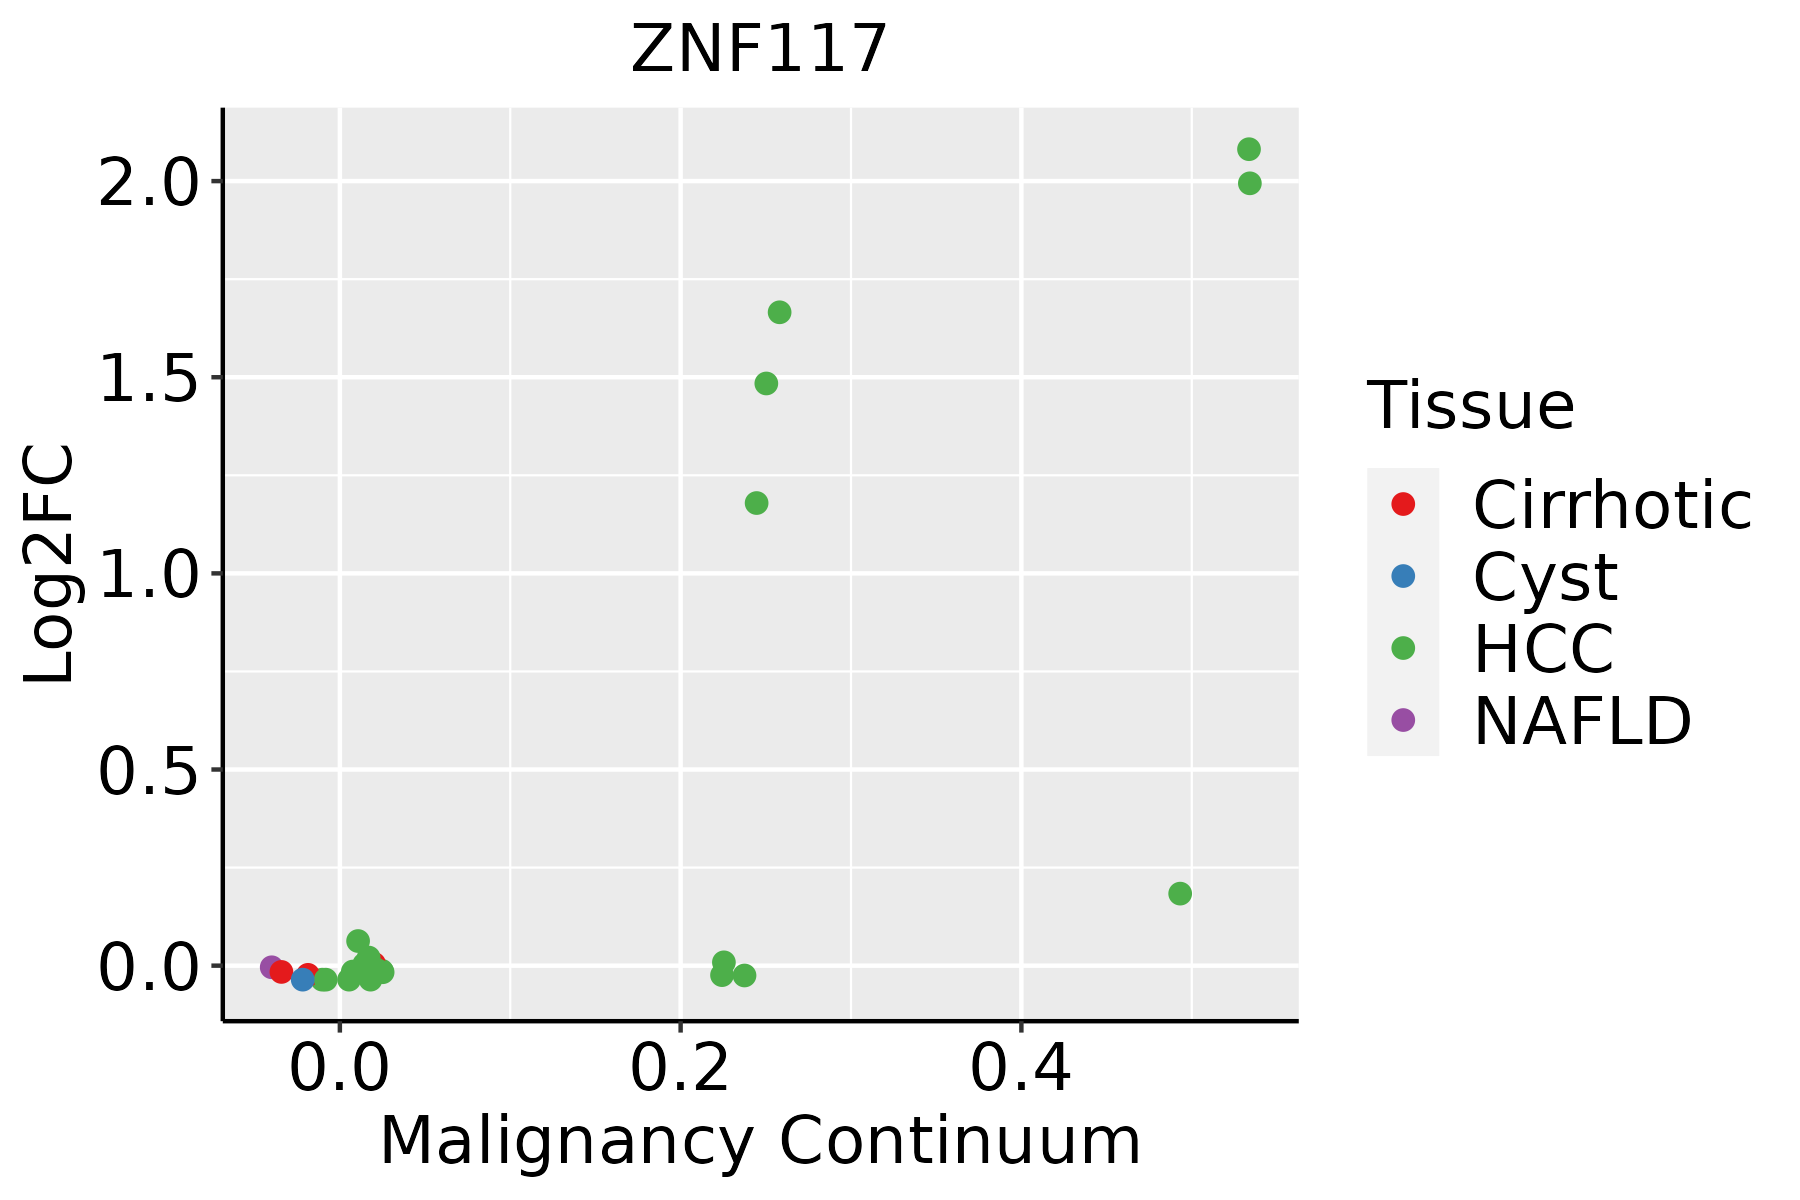 | HCC: Hepatocellular carcinoma |
| NAFLD: Non-alcoholic fatty liver disease | ||
| Oral Cavity |  | EOLP: Erosive Oral lichen planus |
| LP: leukoplakia | ||
| NEOLP: Non-erosive oral lichen planus | ||
| OSCC: Oral squamous cell carcinoma | ||
| Thyroid | 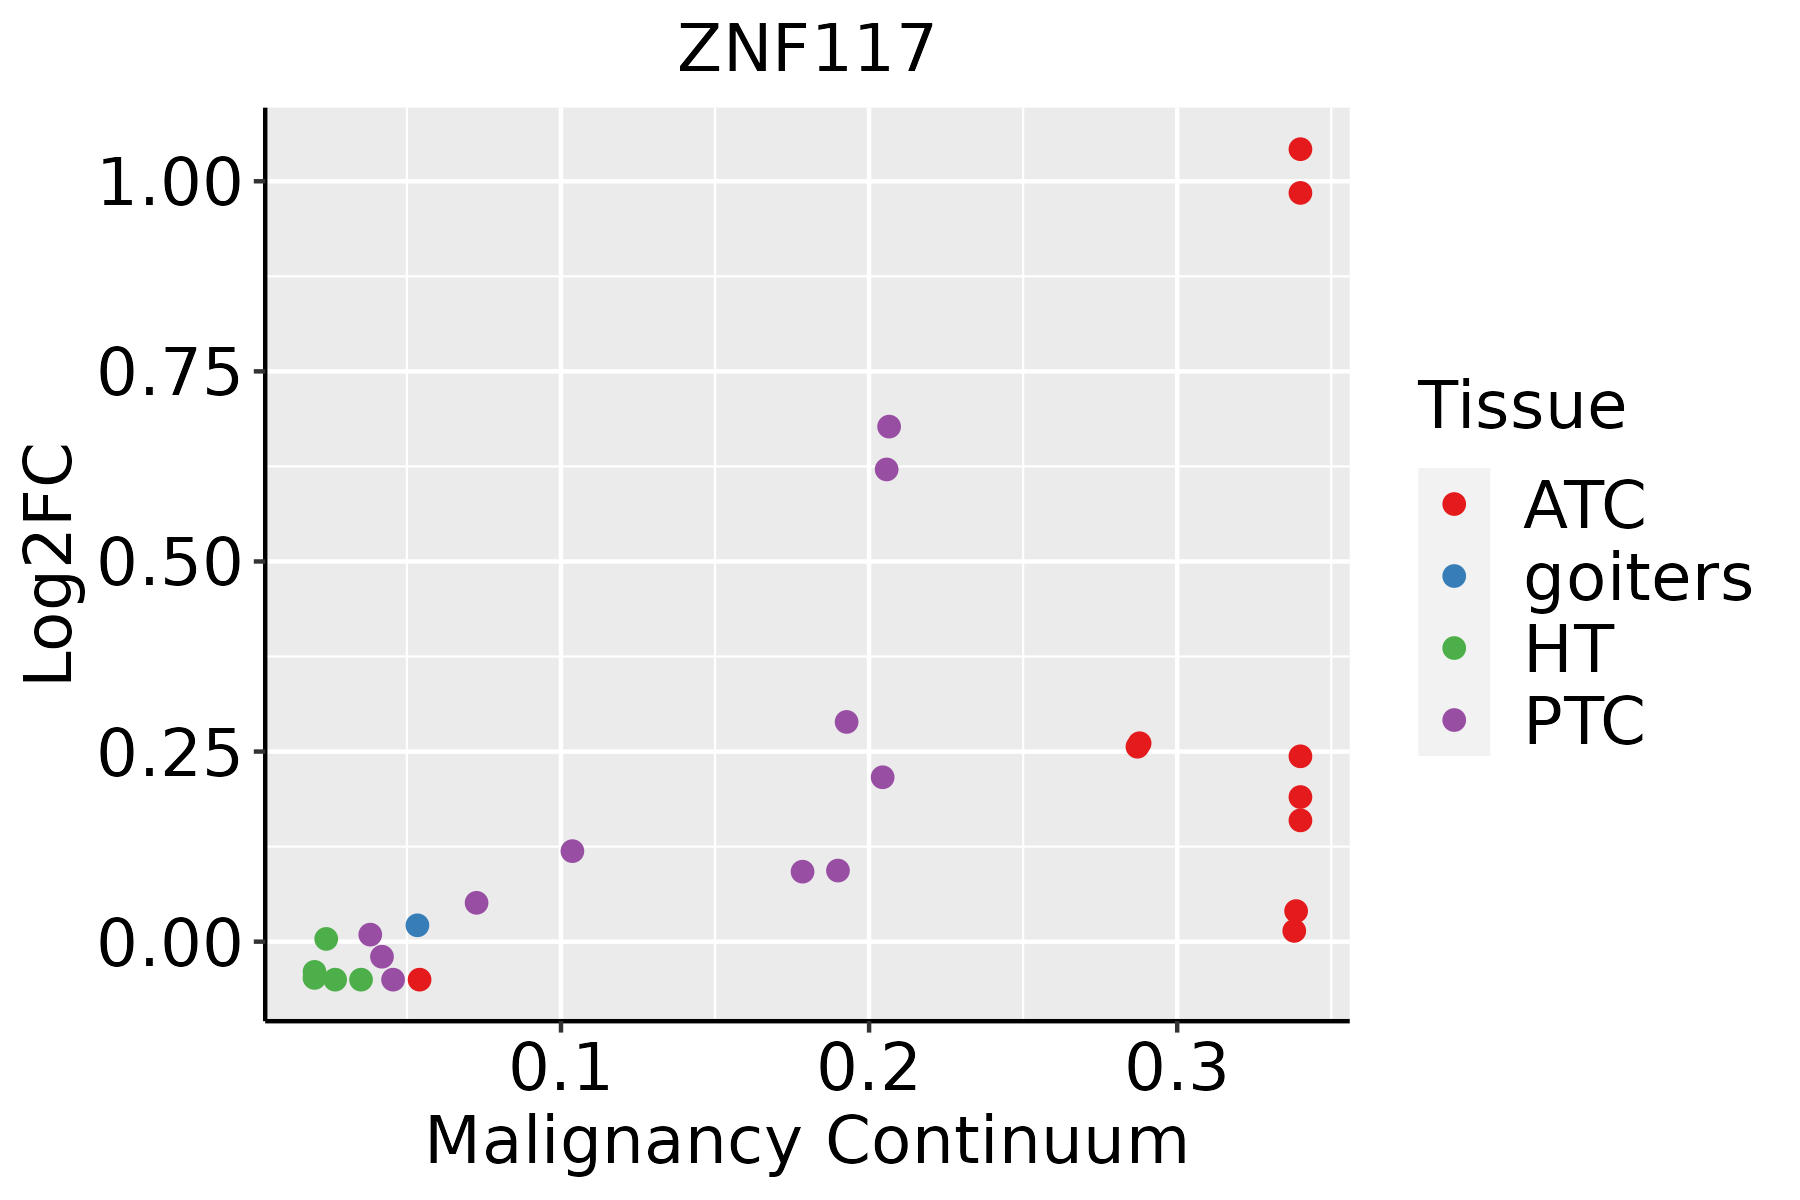 | ATC: Anaplastic thyroid cancer |
| HT: Hashimoto's thyroiditis | ||
| PTC: Papillary thyroid cancer |
| ∗log2FC in expression of this searched gene in stem-like cells from each diseased tissue sample relative to stem-like cells in normal samples in each tissue plotted against the malignancy continuum. Samples are colored based on if they are from different disease stage. |
Top |
Malignant transformation related pathway analysis |
| Find out the enriched GO biological processes and KEGG pathways involved in transition from healthy to precancer to cancer |
| Tissue | Disease Stage | Enriched GO biological Processes |
| Colorectum | AD |  |
| Colorectum | SER |  |
| Colorectum | MSS |  |
| Colorectum | MSI-H |  |
| Colorectum | FAP |  |
| ∗Top 15 enriched GO BP terms are showed in the bar plot of each disease state in each tissue. Each row represents a significant GO biological process which is colored according to the -log10(p.adjust). |
| Page: 1 2 3 4 5 6 7 8 9 |
| GO ID | Tissue | Disease Stage | Description | Gene Ratio | Bg Ratio | pvalue | p.adjust | Count |
| Page: 1 |
| Pathway ID | Tissue | Disease Stage | Description | Gene Ratio | Bg Ratio | pvalue | p.adjust | qvalue | Count |
| Page: 1 |
Top |
Cell-cell communication analysis |
| Identification of potential cell-cell interactions between two cell types and their ligand-receptor pairs for different disease states |
| Ligand | Receptor | LRpair | Pathway | Tissue | Disease Stage |
| Page: 1 |
Top |
Single-cell gene regulatory network inference analysis |
| Find out the significant the regulons (TFs) and the target genes of each regulon across cell types for different disease states |
| TF | Cell Type | Tissue | Disease Stage | Target Gene | RSS | Regulon Activity |
| ZNF117 | ADIPO | Colorectum | ADJ | ACACB,RNPC3,PDE3B, etc. | 9.48e-02 |  |
| ZNF117 | ADIPO | Colorectum | CRC | ACACB,RNPC3,PDE3B, etc. | 2.97e-01 |  |
| ZNF117 | ADIPO | Colorectum | FAP | ACACB,RNPC3,PDE3B, etc. | 4.50e-02 |  |
| ZNF117 | ADIPO | Colorectum | Healthy | ACACB,RNPC3,PDE3B, etc. | 2.60e-02 |  |
| ZNF117 | M1MAC | Thyroid | ADJ | CD36,MEGF6,MME, etc. | 9.19e-02 |  |
| ZNF117 | M2MAC | Thyroid | goiters | CD36,MEGF6,MME, etc. | 8.28e-03 |  |
| ZNF117 | BMEM | Thyroid | Healthy | CD36,MEGF6,MME, etc. | 1.74e-02 |  |
| ∗The dot plots of a searched regulon are shown for all cell subpopulations in each disease state of each tissue based on the regulon specific score inferred using pySCENIC and by calculating the average expression. |
| Page: 1 |
Top |
Somatic mutation of malignant transformation related genes |
| Annotation of somatic variants for genes involved in malignant transformation |
| Hugo Symbol | Variant Class | Variant Classification | dbSNP RS | HGVSc | HGVSp | HGVSp Short | SWISSPROT | BIOTYPE | SIFT | PolyPhen | Tumor Sample Barcode | Tissue | Histology | Sex | Age | Stage | Therapy Types | Drugs | Outcome |
| ZNF117 | SNV | Missense_Mutation | novel | c.1330C>G | p.Pro444Ala | p.P444A | Q03924 | protein_coding | deleterious(0.01) | benign(0.235) | TCGA-AN-A046-01 | Breast | breast invasive carcinoma | Female | >=65 | I/II | Unknown | Unknown | SD |
| ZNF117 | SNV | Missense_Mutation | c.470G>T | p.Arg157Ile | p.R157I | Q03924 | protein_coding | tolerated(0.33) | benign(0.235) | TCGA-AN-A046-01 | Breast | breast invasive carcinoma | Female | >=65 | I/II | Unknown | Unknown | SD | |
| ZNF117 | SNV | Missense_Mutation | novel | c.125N>T | p.Cys42Phe | p.C42F | Q03924 | protein_coding | deleterious(0) | possibly_damaging(0.59) | TCGA-AR-A0TU-01 | Breast | breast invasive carcinoma | Female | <65 | I/II | Unspecific | Doxorubicin | SD |
| ZNF117 | SNV | Missense_Mutation | novel | c.343N>T | p.Arg115Cys | p.R115C | Q03924 | protein_coding | deleterious(0) | possibly_damaging(0.759) | TCGA-C8-A12W-01 | Breast | breast invasive carcinoma | Female | <65 | III/IV | Unknown | Unknown | SD |
| ZNF117 | SNV | Missense_Mutation | c.392A>G | p.Gln131Arg | p.Q131R | Q03924 | protein_coding | deleterious(0.01) | benign(0.08) | TCGA-D8-A1XK-01 | Breast | breast invasive carcinoma | Female | <65 | I/II | Chemotherapy | doxorubicine+cyclophosphamide | SD | |
| ZNF117 | SNV | Missense_Mutation | c.1029N>A | p.Asn343Lys | p.N343K | Q03924 | protein_coding | tolerated(0.47) | benign(0.026) | TCGA-EW-A1OY-01 | Breast | breast invasive carcinoma | Female | <65 | I/II | Chemotherapy | doxorubicin | SD | |
| ZNF117 | SNV | Missense_Mutation | rs762844393 | c.1310G>T | p.Arg437Ile | p.R437I | Q03924 | protein_coding | tolerated(0.51) | benign(0) | TCGA-2W-A8YY-01 | Cervix | cervical & endocervical cancer | Female | <65 | I/II | Chemotherapy | cisplatin | CR |
| ZNF117 | SNV | Missense_Mutation | rs757793015 | c.1247N>C | p.Leu416Pro | p.L416P | Q03924 | protein_coding | tolerated(1) | benign(0) | TCGA-DS-A1OA-01 | Cervix | cervical & endocervical cancer | Female | >=65 | I/II | Chemotherapy | carboplatin | PD |
| ZNF117 | SNV | Missense_Mutation | c.655A>T | p.Ile219Phe | p.I219F | Q03924 | protein_coding | deleterious(0) | benign(0.242) | TCGA-A6-6653-01 | Colorectum | colon adenocarcinoma | Male | >=65 | I/II | Unknown | Unknown | SD | |
| ZNF117 | SNV | Missense_Mutation | c.254N>C | p.Lys85Thr | p.K85T | Q03924 | protein_coding | tolerated(0.07) | possibly_damaging(0.698) | TCGA-AA-3510-01 | Colorectum | colon adenocarcinoma | Male | >=65 | I/II | Unknown | Unknown | SD |
| Page: 1 2 3 4 5 6 7 |
Top |
Related drugs of malignant transformation related genes |
| Identification of chemicals and drugs interact with genes involved in malignant transfromation |
| (DGIdb 4.0) |
| Entrez ID | Symbol | Category | Interaction Types | Drug Claim Name | Drug Name | PMIDs |
| Page: 1 |

Copyright 2023-Present -The University of Texas Health Science Center at Houston |