
|
|||||
|
 | |
| |
| |
| |
| |
| |
|
Gene: ZNF101 |
Gene summary for ZNF101 |
| Gene information | Species | Human | Gene symbol | ZNF101 | Gene ID | 94039 |
| Gene name | zinc finger protein 101 | |
| Gene Alias | HZF12 | |
| Cytomap | 19p13.11 | |
| Gene Type | protein-coding | GO ID | GO:0006139 | UniProtAcc | Q8IZC7 |
Top |
Malignant transformation analysis |
| Identification of the aberrant gene expression in precancerous and cancerous lesions by comparing the gene expression of stem-like cells in diseased tissues with normal stem cells |
| Entrez ID | Symbol | Replicates | Species | Organ | Tissue | Adj P-value | Log2FC | Malignancy |
| 94039 | ZNF101 | HCC1_Meng | Human | Liver | HCC | 1.41e-05 | -1.56e-02 | 0.0246 |
| 94039 | ZNF101 | HCC1 | Human | Liver | HCC | 7.91e-15 | 1.98e+00 | 0.5336 |
| 94039 | ZNF101 | HCC2 | Human | Liver | HCC | 1.85e-22 | 2.61e+00 | 0.5341 |
| 94039 | ZNF101 | HCC5 | Human | Liver | HCC | 1.65e-19 | 2.04e+00 | 0.4932 |
| 94039 | ZNF101 | S015 | Human | Liver | HCC | 2.10e-04 | 2.28e-01 | 0.2375 |
| 94039 | ZNF101 | S016 | Human | Liver | HCC | 2.77e-03 | 1.10e-01 | 0.2243 |
| Page: 1 |
| Tissue | Expression Dynamics | Abbreviation |
| Liver | 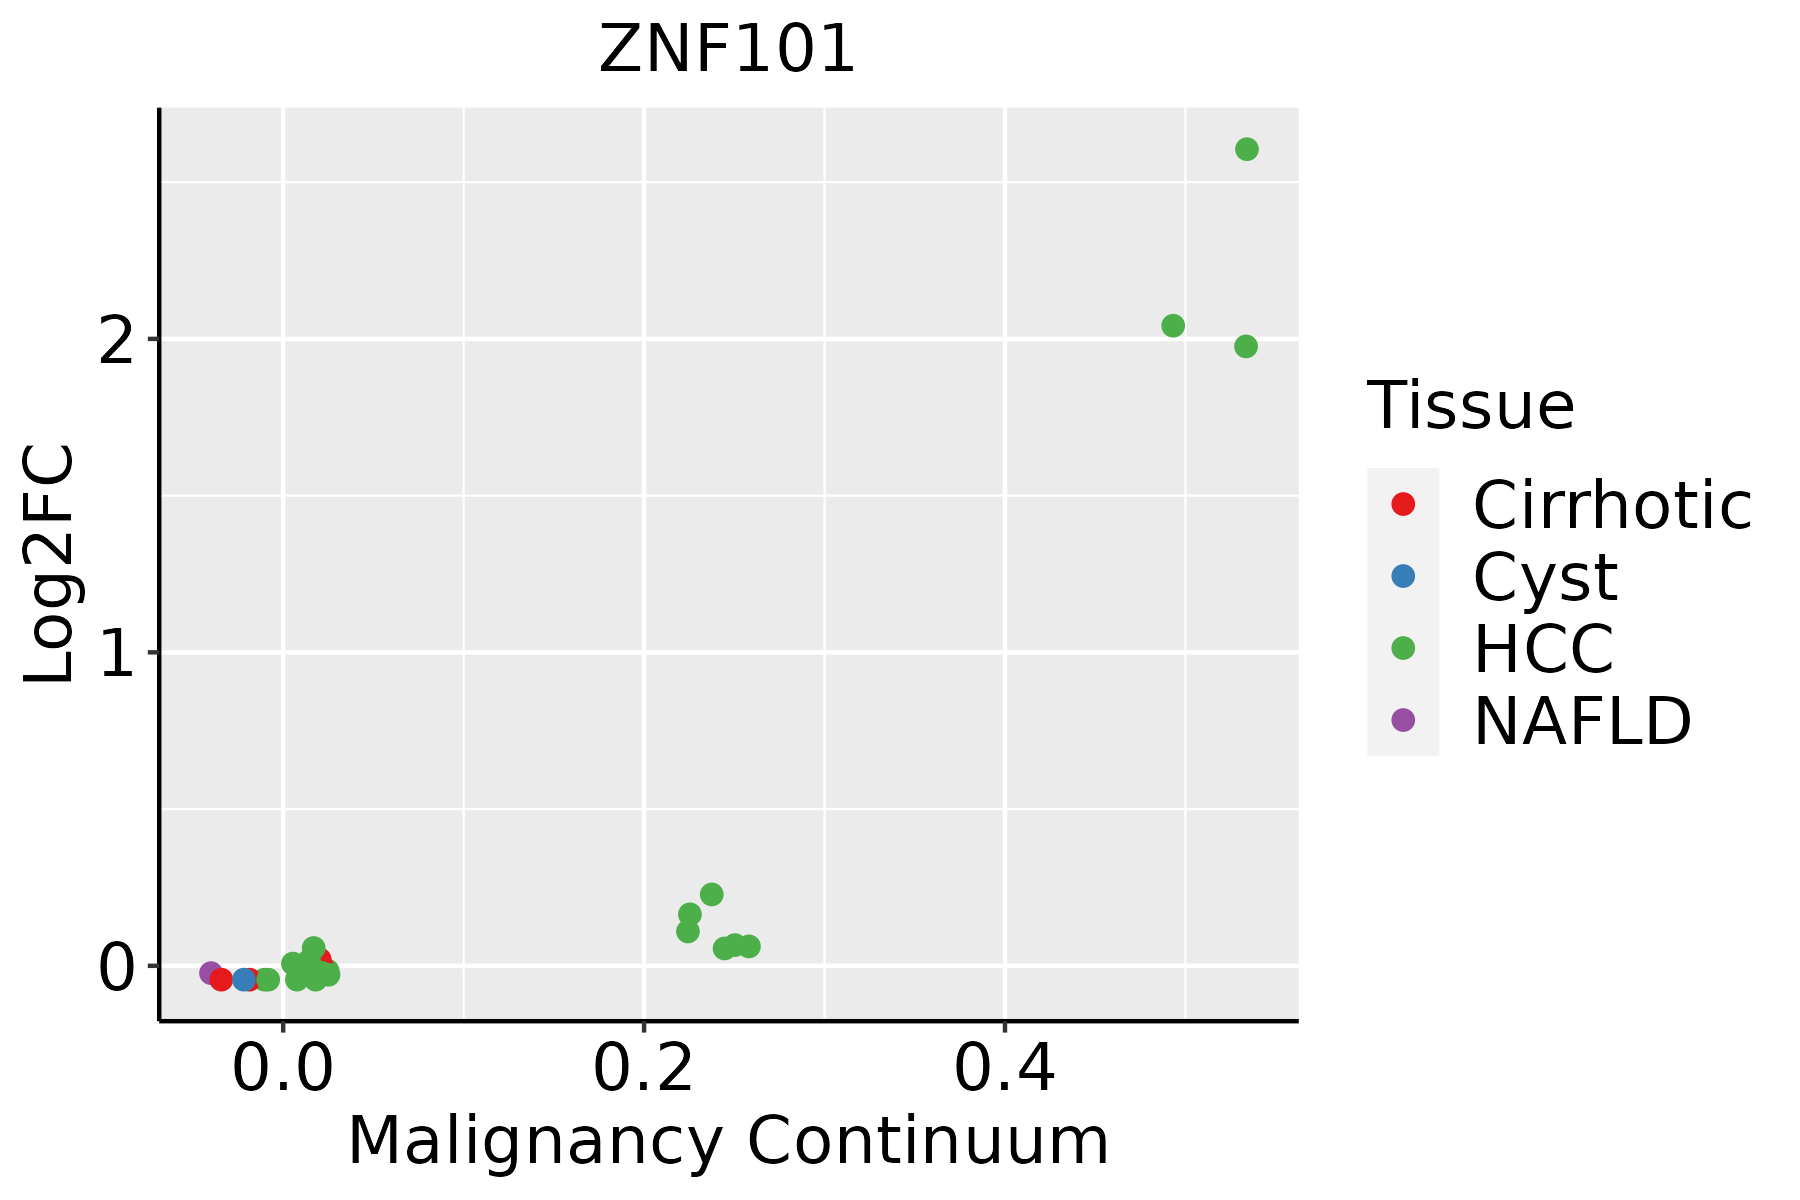 | HCC: Hepatocellular carcinoma |
| NAFLD: Non-alcoholic fatty liver disease |
| ∗log2FC in expression of this searched gene in stem-like cells from each diseased tissue sample relative to stem-like cells in normal samples in each tissue plotted against the malignancy continuum. Samples are colored based on if they are from different disease stage. |
Top |
Malignant transformation related pathway analysis |
| Find out the enriched GO biological processes and KEGG pathways involved in transition from healthy to precancer to cancer |
| Tissue | Disease Stage | Enriched GO biological Processes |
| Colorectum | AD |  |
| Colorectum | SER |  |
| Colorectum | MSS |  |
| Colorectum | MSI-H |  |
| Colorectum | FAP |  |
| ∗Top 15 enriched GO BP terms are showed in the bar plot of each disease state in each tissue. Each row represents a significant GO biological process which is colored according to the -log10(p.adjust). |
| Page: 1 2 3 4 5 6 7 8 9 |
| GO ID | Tissue | Disease Stage | Description | Gene Ratio | Bg Ratio | pvalue | p.adjust | Count |
| Page: 1 |
| Pathway ID | Tissue | Disease Stage | Description | Gene Ratio | Bg Ratio | pvalue | p.adjust | qvalue | Count |
| Page: 1 |
Top |
Cell-cell communication analysis |
| Identification of potential cell-cell interactions between two cell types and their ligand-receptor pairs for different disease states |
| Ligand | Receptor | LRpair | Pathway | Tissue | Disease Stage |
| Page: 1 |
Top |
Single-cell gene regulatory network inference analysis |
| Find out the significant the regulons (TFs) and the target genes of each regulon across cell types for different disease states |
| TF | Cell Type | Tissue | Disease Stage | Target Gene | RSS | Regulon Activity |
| ZNF101 | CT | Colorectum | Healthy | ZDHHC8,HELZ2,SLC25A34, etc. | 1.03e-01 |  |
| ZNF101 | TH1 | Colorectum | AD | RHEX,GPM6A,AHDC1, etc. | 1.97e-02 |  |
| ZNF101 | TREG | Colorectum | MSI-H | RHEX,GPM6A,AHDC1, etc. | 8.83e-02 |  |
| ZNF101 | TREG | Colorectum | SER | RHEX,GPM6A,AHDC1, etc. | 4.99e-02 |  |
| ZNF101 | STM | Liver | NAFLD | MAPK10,EPS8L3,ARGFX, etc. | 0.00e+00 |  |
| ZNF101 | TREG | Stomach | ADJ | FOXP3,HDAC5,GIMAP7, etc. | 9.89e-02 |  |
| ZNF101 | MAIT | Stomach | ADJ | FOXP3,HDAC5,GIMAP7, etc. | 5.12e-02 | |
| ZNF101 | GC | Stomach | CAG | FOXP3,HDAC5,GIMAP7, etc. | 1.88e-02 |  |
| ZNF101 | CD8TEXP | Stomach | CAG with IM | FOXP3,HDAC5,GIMAP7, etc. | 1.94e-02 |  |
| ZNF101 | TH17 | Stomach | CSG | FOXP3,HDAC5,GIMAP7, etc. | 2.50e-02 |  |
| ∗The dot plots of a searched regulon are shown for all cell subpopulations in each disease state of each tissue based on the regulon specific score inferred using pySCENIC and by calculating the average expression. |
| Page: 1 2 3 |
Top |
Somatic mutation of malignant transformation related genes |
| Annotation of somatic variants for genes involved in malignant transformation |
| Hugo Symbol | Variant Class | Variant Classification | dbSNP RS | HGVSc | HGVSp | HGVSp Short | SWISSPROT | BIOTYPE | SIFT | PolyPhen | Tumor Sample Barcode | Tissue | Histology | Sex | Age | Stage | Therapy Types | Drugs | Outcome |
| ZNF101 | SNV | Missense_Mutation | c.553N>G | p.Gln185Glu | p.Q185E | Q8IZC7 | protein_coding | deleterious(0.02) | benign(0.403) | TCGA-A1-A0SI-01 | Breast | breast invasive carcinoma | Female | <65 | I/II | Unknown | Unknown | SD | |
| ZNF101 | SNV | Missense_Mutation | c.476N>A | p.Arg159His | p.R159H | Q8IZC7 | protein_coding | tolerated(1) | benign(0) | TCGA-A2-A0T0-01 | Breast | breast invasive carcinoma | Female | <65 | I/II | Chemotherapy | taxotere | SD | |
| ZNF101 | SNV | Missense_Mutation | c.1025N>C | p.Lys342Thr | p.K342T | Q8IZC7 | protein_coding | tolerated(0.14) | benign(0.276) | TCGA-AN-A046-01 | Breast | breast invasive carcinoma | Female | >=65 | I/II | Unknown | Unknown | SD | |
| ZNF101 | SNV | Missense_Mutation | c.1100N>T | p.Glu367Val | p.E367V | Q8IZC7 | protein_coding | deleterious(0.02) | possibly_damaging(0.589) | TCGA-B6-A0IJ-01 | Breast | breast invasive carcinoma | Female | <65 | I/II | Unknown | Unknown | SD | |
| ZNF101 | SNV | Missense_Mutation | rs144162757 | c.805N>T | p.Arg269Trp | p.R269W | Q8IZC7 | protein_coding | deleterious(0) | benign(0.007) | TCGA-E2-A3DX-01 | Breast | breast invasive carcinoma | Female | <65 | III/IV | Chemotherapy | doxorubicin | SD |
| ZNF101 | SNV | Missense_Mutation | rs551033773 | c.98N>T | p.Thr33Met | p.T33M | Q8IZC7 | protein_coding | tolerated(1) | benign(0) | TCGA-OL-A66O-01 | Breast | breast invasive carcinoma | Female | <65 | I/II | Chemotherapy | cytoxan | CR |
| ZNF101 | insertion | Frame_Shift_Ins | novel | c.183_184insGGGGC | p.Lys62GlyfsTer4 | p.K62Gfs*4 | Q8IZC7 | protein_coding | TCGA-E9-A1NC-01 | Breast | breast invasive carcinoma | Female | <65 | I/II | Chemotherapy | doxorubicin | CR | ||
| ZNF101 | insertion | In_Frame_Ins | novel | c.184_185insTCGTGGGCCAGGTAC | p.Lys62delinsIleValGlyGlnValGln | p.K62delinsIVGQVQ | Q8IZC7 | protein_coding | TCGA-E9-A1NC-01 | Breast | breast invasive carcinoma | Female | <65 | I/II | Chemotherapy | doxorubicin | CR | ||
| ZNF101 | SNV | Missense_Mutation | novel | c.651N>C | p.Lys217Asn | p.K217N | Q8IZC7 | protein_coding | deleterious(0.02) | benign(0.334) | TCGA-2W-A8YY-01 | Cervix | cervical & endocervical cancer | Female | <65 | I/II | Chemotherapy | cisplatin | CR |
| ZNF101 | SNV | Missense_Mutation | rs373338300 | c.670C>T | p.Arg224Cys | p.R224C | Q8IZC7 | protein_coding | deleterious(0) | benign(0.445) | TCGA-EA-A97N-01 | Cervix | cervical & endocervical cancer | Female | <65 | I/II | Unknown | Unknown | SD |
| Page: 1 2 3 4 5 6 |
Top |
Related drugs of malignant transformation related genes |
| Identification of chemicals and drugs interact with genes involved in malignant transfromation |
| (DGIdb 4.0) |
| Entrez ID | Symbol | Category | Interaction Types | Drug Claim Name | Drug Name | PMIDs |
| Page: 1 |

Copyright 2023-Present -The University of Texas Health Science Center at Houston |