
|
|||||
|
 | |
| |
| |
| |
| |
| |
|
Gene: ZMYND19 |
Gene summary for ZMYND19 |
| Gene information | Species | Human | Gene symbol | ZMYND19 | Gene ID | 116225 |
| Gene name | zinc finger MYND-type containing 19 | |
| Gene Alias | MIZIP | |
| Cytomap | 9q34.3 | |
| Gene Type | protein-coding | GO ID | GO:0005575 | UniProtAcc | Q96E35 |
Top |
Malignant transformation analysis |
| Identification of the aberrant gene expression in precancerous and cancerous lesions by comparing the gene expression of stem-like cells in diseased tissues with normal stem cells |
| Entrez ID | Symbol | Replicates | Species | Organ | Tissue | Adj P-value | Log2FC | Malignancy |
| 116225 | ZMYND19 | HCC1_Meng | Human | Liver | HCC | 2.05e-23 | 3.18e-02 | 0.0246 |
| 116225 | ZMYND19 | HCC2_Meng | Human | Liver | HCC | 1.65e-03 | 4.19e-02 | 0.0107 |
| 116225 | ZMYND19 | HCC1 | Human | Liver | HCC | 3.12e-03 | 1.33e+00 | 0.5336 |
| 116225 | ZMYND19 | HCC2 | Human | Liver | HCC | 6.20e-03 | 8.28e-01 | 0.5341 |
| 116225 | ZMYND19 | S014 | Human | Liver | HCC | 1.64e-05 | 1.89e-01 | 0.2254 |
| 116225 | ZMYND19 | S015 | Human | Liver | HCC | 2.74e-02 | 1.13e-01 | 0.2375 |
| 116225 | ZMYND19 | S016 | Human | Liver | HCC | 8.17e-08 | 1.85e-01 | 0.2243 |
| 116225 | ZMYND19 | S027 | Human | Liver | HCC | 1.62e-09 | 4.21e-01 | 0.2446 |
| 116225 | ZMYND19 | S028 | Human | Liver | HCC | 4.40e-18 | 4.76e-01 | 0.2503 |
| 116225 | ZMYND19 | S029 | Human | Liver | HCC | 1.35e-19 | 5.09e-01 | 0.2581 |
| 116225 | ZMYND19 | C04 | Human | Oral cavity | OSCC | 1.31e-02 | 2.26e-01 | 0.2633 |
| 116225 | ZMYND19 | C21 | Human | Oral cavity | OSCC | 4.34e-13 | 4.93e-01 | 0.2678 |
| 116225 | ZMYND19 | C30 | Human | Oral cavity | OSCC | 1.65e-32 | 1.31e+00 | 0.3055 |
| 116225 | ZMYND19 | C38 | Human | Oral cavity | OSCC | 2.09e-02 | 4.03e-01 | 0.172 |
| 116225 | ZMYND19 | C43 | Human | Oral cavity | OSCC | 4.38e-06 | 1.47e-01 | 0.1704 |
| 116225 | ZMYND19 | C46 | Human | Oral cavity | OSCC | 2.25e-02 | 1.23e-01 | 0.1673 |
| 116225 | ZMYND19 | C06 | Human | Oral cavity | OSCC | 2.98e-02 | 7.25e-01 | 0.2699 |
| 116225 | ZMYND19 | C08 | Human | Oral cavity | OSCC | 4.65e-07 | 2.57e-01 | 0.1919 |
| 116225 | ZMYND19 | C09 | Human | Oral cavity | OSCC | 1.48e-02 | 1.08e-01 | 0.1431 |
| 116225 | ZMYND19 | LN22 | Human | Oral cavity | OSCC | 5.60e-03 | 5.60e-01 | 0.1733 |
| Page: 1 2 |
| Tissue | Expression Dynamics | Abbreviation |
| Liver | 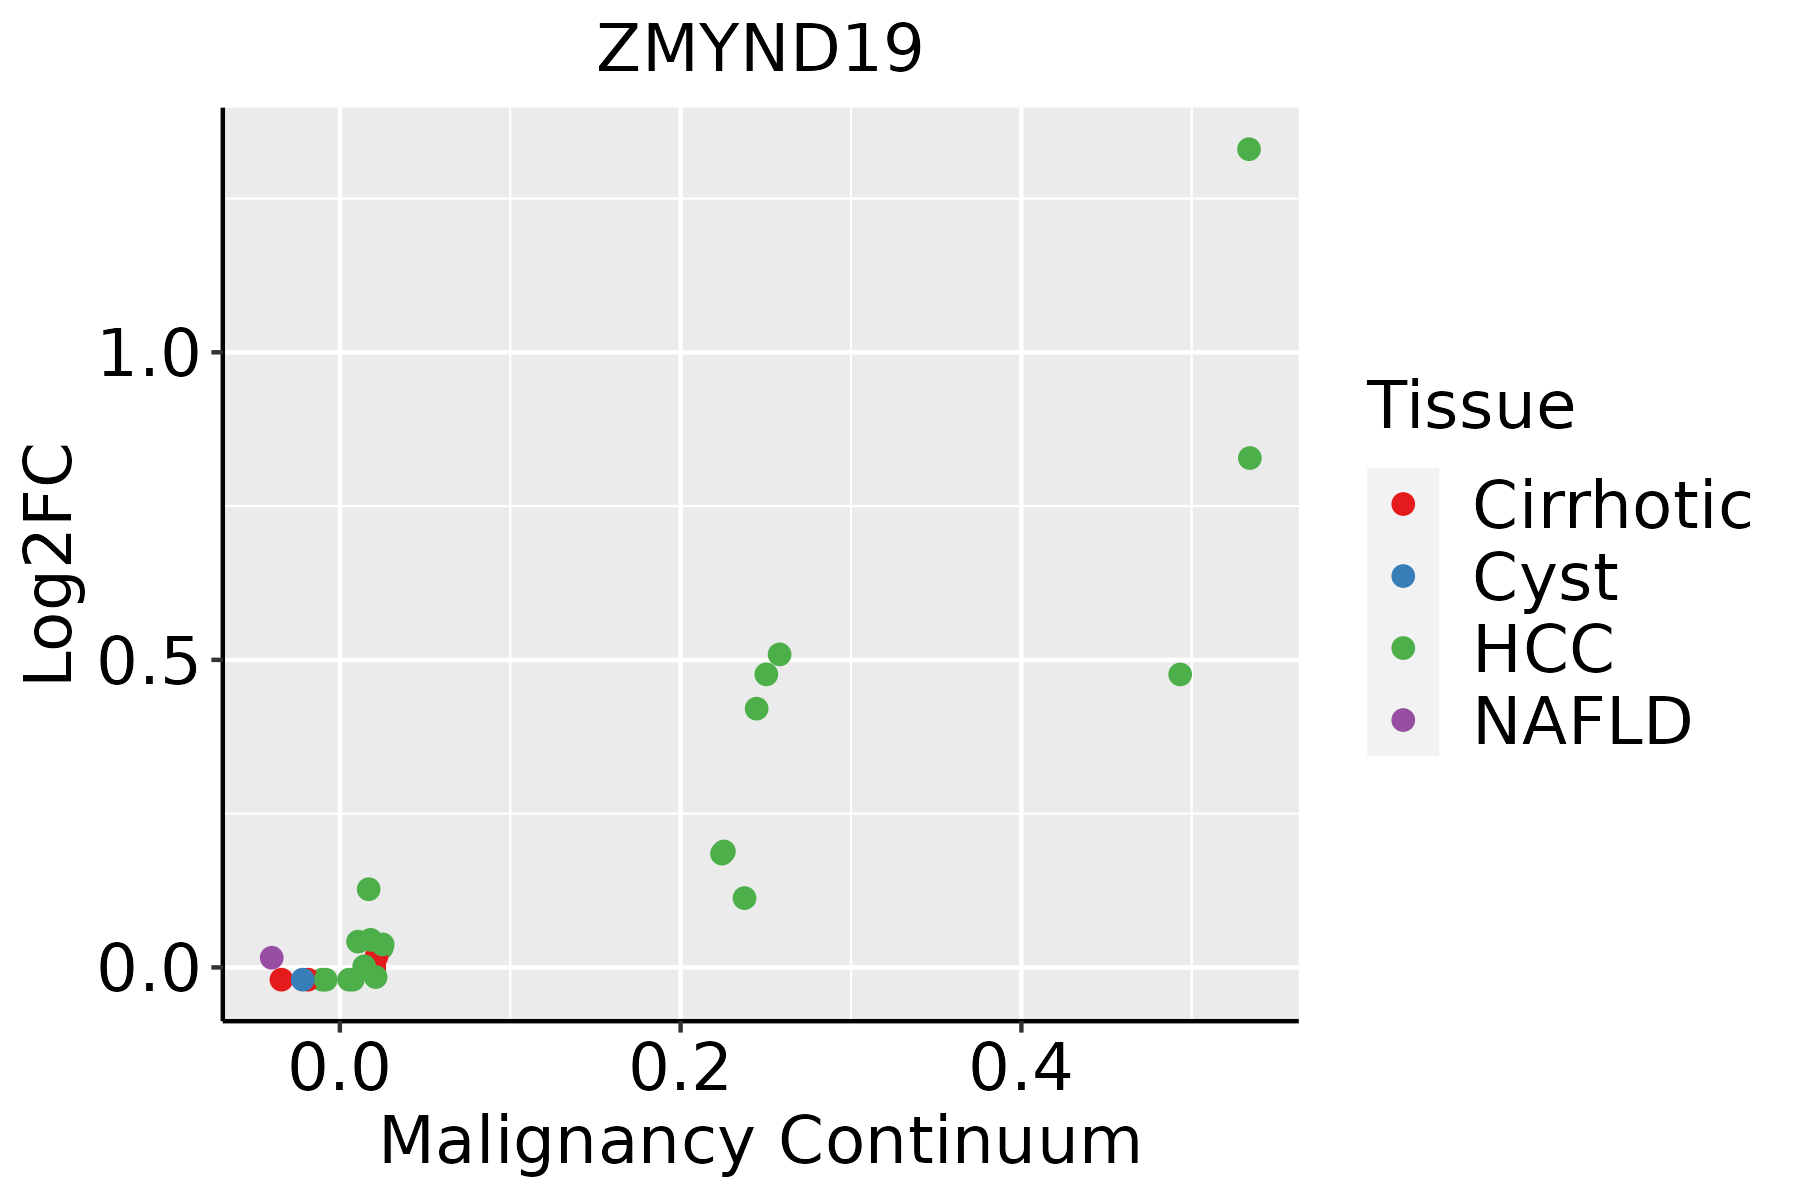 | HCC: Hepatocellular carcinoma |
| NAFLD: Non-alcoholic fatty liver disease | ||
| Oral Cavity |  | EOLP: Erosive Oral lichen planus |
| LP: leukoplakia | ||
| NEOLP: Non-erosive oral lichen planus | ||
| OSCC: Oral squamous cell carcinoma |
| ∗log2FC in expression of this searched gene in stem-like cells from each diseased tissue sample relative to stem-like cells in normal samples in each tissue plotted against the malignancy continuum. Samples are colored based on if they are from different disease stage. |
Top |
Malignant transformation related pathway analysis |
| Find out the enriched GO biological processes and KEGG pathways involved in transition from healthy to precancer to cancer |
| Tissue | Disease Stage | Enriched GO biological Processes |
| Colorectum | AD |  |
| Colorectum | SER |  |
| Colorectum | MSS |  |
| Colorectum | MSI-H |  |
| Colorectum | FAP |  |
| ∗Top 15 enriched GO BP terms are showed in the bar plot of each disease state in each tissue. Each row represents a significant GO biological process which is colored according to the -log10(p.adjust). |
| Page: 1 2 3 4 5 6 7 8 9 |
| GO ID | Tissue | Disease Stage | Description | Gene Ratio | Bg Ratio | pvalue | p.adjust | Count |
| Page: 1 |
| Pathway ID | Tissue | Disease Stage | Description | Gene Ratio | Bg Ratio | pvalue | p.adjust | qvalue | Count |
| Page: 1 |
Top |
Cell-cell communication analysis |
| Identification of potential cell-cell interactions between two cell types and their ligand-receptor pairs for different disease states |
| Ligand | Receptor | LRpair | Pathway | Tissue | Disease Stage |
| Page: 1 |
Top |
Single-cell gene regulatory network inference analysis |
| Find out the significant the regulons (TFs) and the target genes of each regulon across cell types for different disease states |
| TF | Cell Type | Tissue | Disease Stage | Target Gene | RSS | Regulon Activity |
| ∗The dot plots of a searched regulon are shown for all cell subpopulations in each disease state of each tissue based on the regulon specific score inferred using pySCENIC and by calculating the average expression. |
| Page: 1 |
Top |
Somatic mutation of malignant transformation related genes |
| Annotation of somatic variants for genes involved in malignant transformation |
| Hugo Symbol | Variant Class | Variant Classification | dbSNP RS | HGVSc | HGVSp | HGVSp Short | SWISSPROT | BIOTYPE | SIFT | PolyPhen | Tumor Sample Barcode | Tissue | Histology | Sex | Age | Stage | Therapy Types | Drugs | Outcome |
| ZMYND19 | SNV | Missense_Mutation | novel | c.362N>G | p.Glu121Gly | p.E121G | Q96E35 | protein_coding | deleterious(0) | probably_damaging(0.954) | TCGA-A8-A08F-01 | Breast | breast invasive carcinoma | Female | <65 | III/IV | Chemotherapy | 5-fluorouracil | CR |
| ZMYND19 | SNV | Missense_Mutation | novel | c.83T>C | p.Ile28Thr | p.I28T | Q96E35 | protein_coding | deleterious(0) | possibly_damaging(0.84) | TCGA-CA-6717-01 | Colorectum | colon adenocarcinoma | Male | <65 | I/II | Chemotherapy | oxaliplatin | CR |
| ZMYND19 | deletion | Frame_Shift_Del | rs759203218 | c.236delG | p.Gly79AlafsTer14 | p.G79Afs*14 | Q96E35 | protein_coding | TCGA-CM-4743-01 | Colorectum | colon adenocarcinoma | Male | >=65 | I/II | Chemotherapy | capecitabine | SD | ||
| ZMYND19 | SNV | Missense_Mutation | novel | c.116N>A | p.Arg39Gln | p.R39Q | Q96E35 | protein_coding | tolerated(0.06) | benign(0.091) | TCGA-AP-A1E1-01 | Endometrium | uterine corpus endometrioid carcinoma | Female | >=65 | I/II | Unknown | Unknown | SD |
| ZMYND19 | SNV | Missense_Mutation | rs369093998 | c.62C>T | p.Thr21Met | p.T21M | Q96E35 | protein_coding | tolerated(0.09) | probably_damaging(0.985) | TCGA-D1-A175-01 | Endometrium | uterine corpus endometrioid carcinoma | Female | <65 | I/II | Chemotherapy | paclitaxel | SD |
| ZMYND19 | SNV | Missense_Mutation | rs867446857 | c.620C>T | p.Ala207Val | p.A207V | Q96E35 | protein_coding | tolerated(0.24) | benign(0.145) | TCGA-D1-A17R-01 | Endometrium | uterine corpus endometrioid carcinoma | Female | <65 | I/II | Unknown | Unknown | SD |
| ZMYND19 | SNV | Missense_Mutation | novel | c.343A>G | p.Thr115Ala | p.T115A | Q96E35 | protein_coding | tolerated(0.85) | benign(0) | TCGA-EO-A22R-01 | Endometrium | uterine corpus endometrioid carcinoma | Female | <65 | I/II | Unknown | Unknown | SD |
| ZMYND19 | insertion | Frame_Shift_Ins | rs753541275 | c.236_237insG | p.Val80ArgfsTer34 | p.V80Rfs*34 | Q96E35 | protein_coding | TCGA-B5-A1MX-01 | Endometrium | uterine corpus endometrioid carcinoma | Female | <65 | I/II | Hormone Therapy | megace | SD | ||
| ZMYND19 | deletion | Frame_Shift_Del | rs759203218 | c.236delN | p.Gly79AlafsTer14 | p.G79Afs*14 | Q96E35 | protein_coding | TCGA-D1-A17M-01 | Endometrium | uterine corpus endometrioid carcinoma | Female | <65 | I/II | Unknown | Unknown | SD | ||
| ZMYND19 | insertion | Frame_Shift_Ins | rs753541275 | c.236dupG | p.Val80ArgfsTer34 | p.V80Rfs*34 | Q96E35 | protein_coding | TCGA-D1-A1NZ-01 | Endometrium | uterine corpus endometrioid carcinoma | Female | <65 | I/II | Unknown | Unknown | SD |
| Page: 1 2 3 |
Top |
Related drugs of malignant transformation related genes |
| Identification of chemicals and drugs interact with genes involved in malignant transfromation |
| (DGIdb 4.0) |
| Entrez ID | Symbol | Category | Interaction Types | Drug Claim Name | Drug Name | PMIDs |
| Page: 1 |

Copyright 2023-Present -The University of Texas Health Science Center at Houston |