
|
|||||
|
 | |
| |
| |
| |
| |
| |
|
Gene: ZMYND11 |
Gene summary for ZMYND11 |
| Gene information | Species | Human | Gene symbol | ZMYND11 | Gene ID | 10771 |
| Gene name | zinc finger MYND-type containing 11 | |
| Gene Alias | BRAM1 | |
| Cytomap | 10p15.3 | |
| Gene Type | protein-coding | GO ID | GO:0000165 | UniProtAcc | Q15326 |
Top |
Malignant transformation analysis |
| Identification of the aberrant gene expression in precancerous and cancerous lesions by comparing the gene expression of stem-like cells in diseased tissues with normal stem cells |
| Entrez ID | Symbol | Replicates | Species | Organ | Tissue | Adj P-value | Log2FC | Malignancy |
| 10771 | ZMYND11 | LZE4T | Human | Esophagus | ESCC | 1.47e-04 | 4.48e-02 | 0.0811 |
| 10771 | ZMYND11 | LZE7T | Human | Esophagus | ESCC | 3.33e-05 | 1.77e-01 | 0.0667 |
| 10771 | ZMYND11 | LZE8T | Human | Esophagus | ESCC | 1.67e-05 | 3.17e-02 | 0.067 |
| 10771 | ZMYND11 | LZE24T | Human | Esophagus | ESCC | 1.04e-06 | 3.38e-01 | 0.0596 |
| 10771 | ZMYND11 | P1T-E | Human | Esophagus | ESCC | 2.03e-05 | 1.73e-01 | 0.0875 |
| 10771 | ZMYND11 | P2T-E | Human | Esophagus | ESCC | 1.38e-15 | 2.79e-01 | 0.1177 |
| 10771 | ZMYND11 | P4T-E | Human | Esophagus | ESCC | 4.37e-09 | 2.46e-01 | 0.1323 |
| 10771 | ZMYND11 | P5T-E | Human | Esophagus | ESCC | 1.04e-06 | 2.04e-02 | 0.1327 |
| 10771 | ZMYND11 | P8T-E | Human | Esophagus | ESCC | 2.83e-13 | 3.01e-01 | 0.0889 |
| 10771 | ZMYND11 | P9T-E | Human | Esophagus | ESCC | 1.22e-10 | 9.52e-02 | 0.1131 |
| 10771 | ZMYND11 | P10T-E | Human | Esophagus | ESCC | 2.98e-19 | 2.42e-01 | 0.116 |
| 10771 | ZMYND11 | P11T-E | Human | Esophagus | ESCC | 1.23e-11 | 2.31e-01 | 0.1426 |
| 10771 | ZMYND11 | P12T-E | Human | Esophagus | ESCC | 2.48e-25 | 4.82e-01 | 0.1122 |
| 10771 | ZMYND11 | P15T-E | Human | Esophagus | ESCC | 2.14e-09 | 3.32e-01 | 0.1149 |
| 10771 | ZMYND11 | P16T-E | Human | Esophagus | ESCC | 2.24e-20 | 3.13e-01 | 0.1153 |
| 10771 | ZMYND11 | P17T-E | Human | Esophagus | ESCC | 8.11e-11 | 2.15e-01 | 0.1278 |
| 10771 | ZMYND11 | P20T-E | Human | Esophagus | ESCC | 3.66e-11 | 2.64e-01 | 0.1124 |
| 10771 | ZMYND11 | P21T-E | Human | Esophagus | ESCC | 1.19e-21 | 4.26e-01 | 0.1617 |
| 10771 | ZMYND11 | P22T-E | Human | Esophagus | ESCC | 5.28e-08 | 3.20e-02 | 0.1236 |
| 10771 | ZMYND11 | P23T-E | Human | Esophagus | ESCC | 1.23e-11 | 1.92e-01 | 0.108 |
| Page: 1 2 3 4 5 6 |
| Tissue | Expression Dynamics | Abbreviation |
| Esophagus | 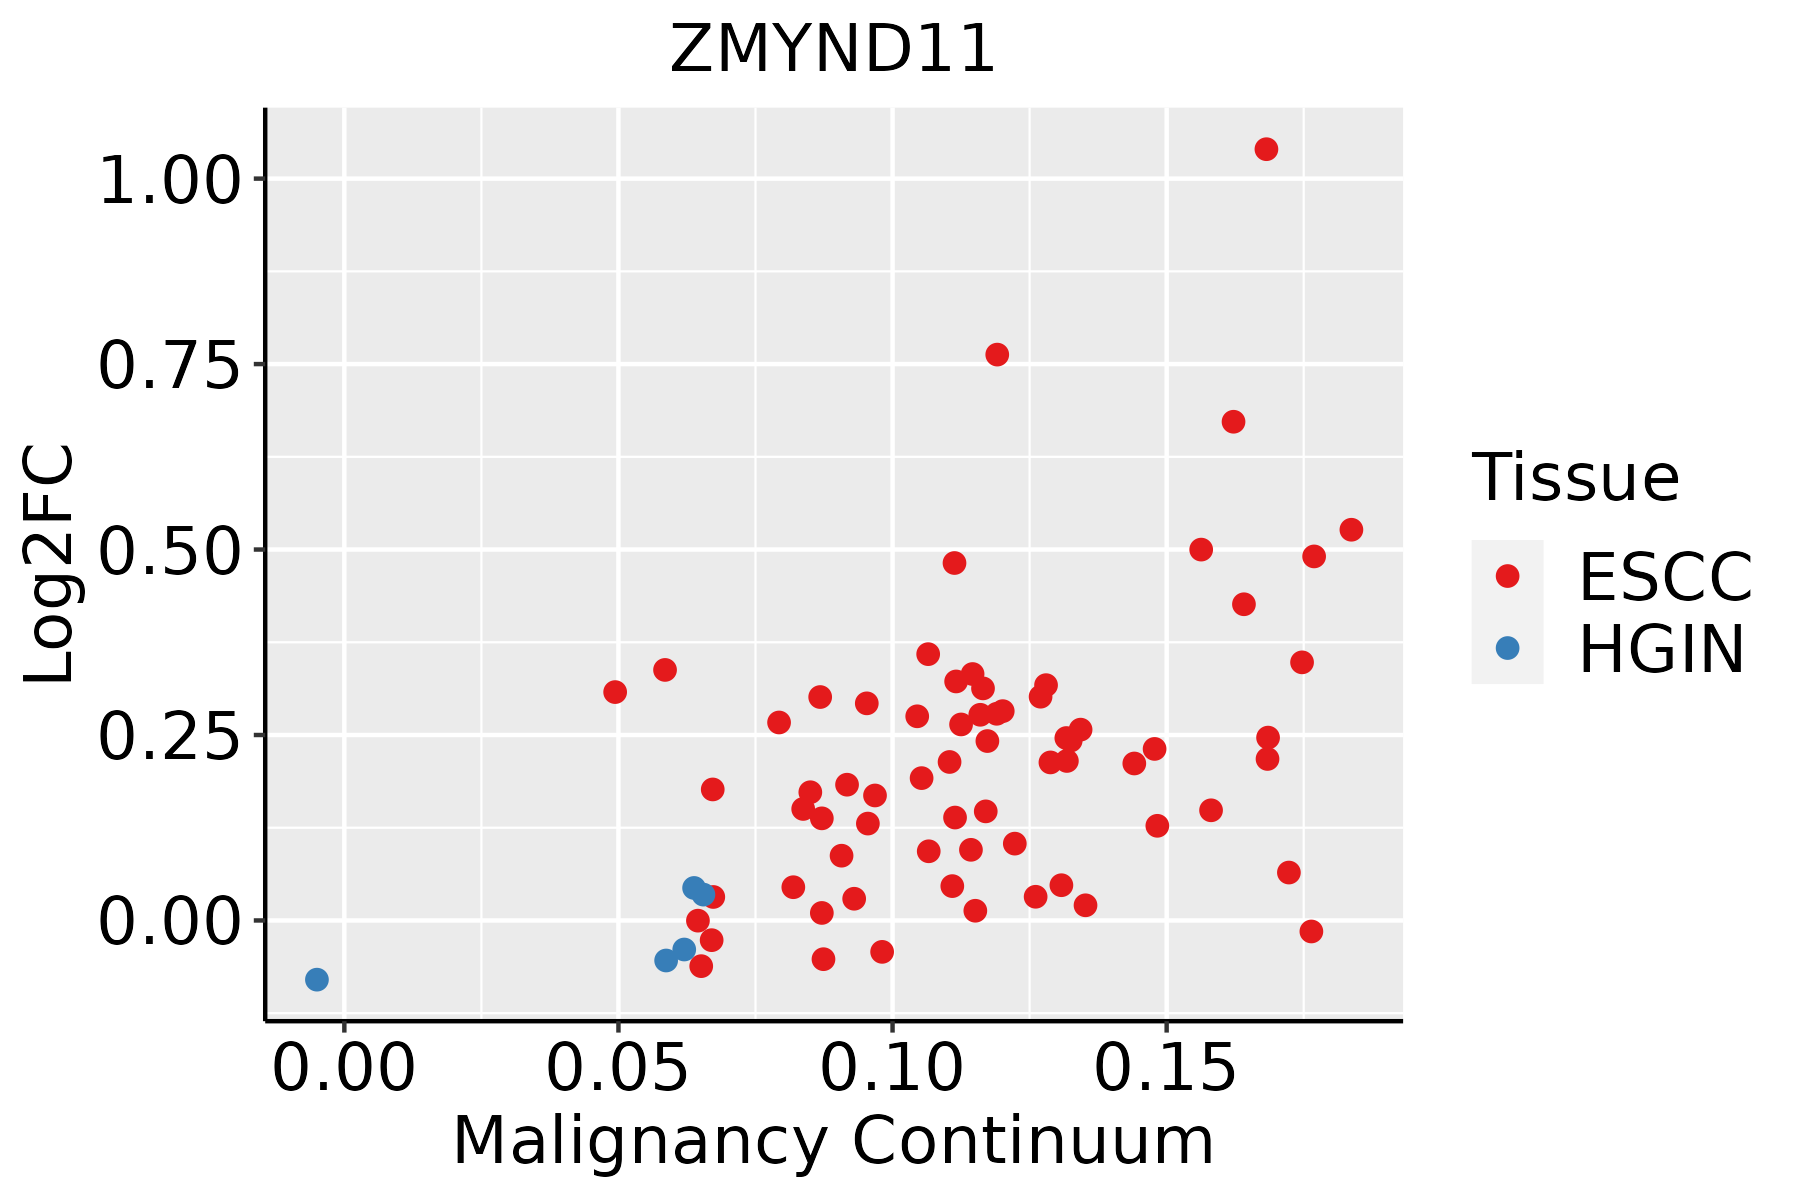 | ESCC: Esophageal squamous cell carcinoma |
| HGIN: High-grade intraepithelial neoplasias | ||
| LGIN: Low-grade intraepithelial neoplasias | ||
| Liver |  | HCC: Hepatocellular carcinoma |
| NAFLD: Non-alcoholic fatty liver disease | ||
| Prostate |  | BPH: Benign Prostatic Hyperplasia |
| Thyroid |  | ATC: Anaplastic thyroid cancer |
| HT: Hashimoto's thyroiditis | ||
| PTC: Papillary thyroid cancer |
| ∗log2FC in expression of this searched gene in stem-like cells from each diseased tissue sample relative to stem-like cells in normal samples in each tissue plotted against the malignancy continuum. Samples are colored based on if they are from different disease stage. |
Top |
Malignant transformation related pathway analysis |
| Find out the enriched GO biological processes and KEGG pathways involved in transition from healthy to precancer to cancer |
| Tissue | Disease Stage | Enriched GO biological Processes |
| Colorectum | AD |  |
| Colorectum | SER |  |
| Colorectum | MSS |  |
| Colorectum | MSI-H |  |
| Colorectum | FAP |  |
| ∗Top 15 enriched GO BP terms are showed in the bar plot of each disease state in each tissue. Each row represents a significant GO biological process which is colored according to the -log10(p.adjust). |
| Page: 1 2 3 4 5 6 7 8 9 |
| GO ID | Tissue | Disease Stage | Description | Gene Ratio | Bg Ratio | pvalue | p.adjust | Count |
| GO:2001233111 | Esophagus | ESCC | regulation of apoptotic signaling pathway | 256/8552 | 356/18723 | 4.11e-24 | 1.04e-21 | 256 |
| GO:0097191111 | Esophagus | ESCC | extrinsic apoptotic signaling pathway | 159/8552 | 219/18723 | 4.12e-16 | 2.94e-14 | 159 |
| GO:2001234111 | Esophagus | ESCC | negative regulation of apoptotic signaling pathway | 161/8552 | 224/18723 | 1.24e-15 | 8.09e-14 | 161 |
| GO:000961518 | Esophagus | ESCC | response to virus | 238/8552 | 367/18723 | 6.65e-14 | 3.32e-12 | 238 |
| GO:000635414 | Esophagus | ESCC | DNA-templated transcription, elongation | 76/8552 | 91/18723 | 8.35e-14 | 4.11e-12 | 76 |
| GO:2001236111 | Esophagus | ESCC | regulation of extrinsic apoptotic signaling pathway | 111/8552 | 151/18723 | 2.97e-12 | 1.18e-10 | 111 |
| GO:0043122110 | Esophagus | ESCC | regulation of I-kappaB kinase/NF-kappaB signaling | 167/8552 | 249/18723 | 6.11e-12 | 2.32e-10 | 167 |
| GO:000724919 | Esophagus | ESCC | I-kappaB kinase/NF-kappaB signaling | 183/8552 | 281/18723 | 3.02e-11 | 1.01e-09 | 183 |
| GO:00516075 | Esophagus | ESCC | defense response to virus | 171/8552 | 265/18723 | 3.91e-10 | 1.05e-08 | 171 |
| GO:01405465 | Esophagus | ESCC | defense response to symbiont | 171/8552 | 265/18723 | 3.91e-10 | 1.05e-08 | 171 |
| GO:000636814 | Esophagus | ESCC | transcription elongation from RNA polymerase II promoter | 56/8552 | 69/18723 | 1.40e-09 | 3.30e-08 | 56 |
| GO:003278412 | Esophagus | ESCC | regulation of DNA-templated transcription, elongation | 45/8552 | 53/18723 | 3.64e-09 | 7.61e-08 | 45 |
| GO:000632517 | Esophagus | ESCC | chromatin organization | 240/8552 | 409/18723 | 6.52e-08 | 1.14e-06 | 240 |
| GO:003109818 | Esophagus | ESCC | stress-activated protein kinase signaling cascade | 154/8552 | 247/18723 | 8.53e-08 | 1.44e-06 | 154 |
| GO:2001237111 | Esophagus | ESCC | negative regulation of extrinsic apoptotic signaling pathway | 69/8552 | 97/18723 | 3.23e-07 | 4.55e-06 | 69 |
| GO:005140318 | Esophagus | ESCC | stress-activated MAPK cascade | 147/8552 | 239/18723 | 5.43e-07 | 7.18e-06 | 147 |
| GO:003424312 | Esophagus | ESCC | regulation of transcription elongation from RNA polymerase II promoter | 28/8552 | 32/18723 | 1.02e-06 | 1.29e-05 | 28 |
| GO:007030217 | Esophagus | ESCC | regulation of stress-activated protein kinase signaling cascade | 119/8552 | 195/18723 | 1.07e-05 | 1.01e-04 | 119 |
| GO:003287217 | Esophagus | ESCC | regulation of stress-activated MAPK cascade | 116/8552 | 192/18723 | 2.63e-05 | 2.21e-04 | 116 |
| GO:00072549 | Esophagus | ESCC | JNK cascade | 102/8552 | 167/18723 | 4.22e-05 | 3.39e-04 | 102 |
| Page: 1 2 3 4 5 6 7 8 9 |
| Pathway ID | Tissue | Disease Stage | Description | Gene Ratio | Bg Ratio | pvalue | p.adjust | qvalue | Count |
| Page: 1 |
Top |
Cell-cell communication analysis |
| Identification of potential cell-cell interactions between two cell types and their ligand-receptor pairs for different disease states |
| Ligand | Receptor | LRpair | Pathway | Tissue | Disease Stage |
| Page: 1 |
Top |
Single-cell gene regulatory network inference analysis |
| Find out the significant the regulons (TFs) and the target genes of each regulon across cell types for different disease states |
| TF | Cell Type | Tissue | Disease Stage | Target Gene | RSS | Regulon Activity |
| ∗The dot plots of a searched regulon are shown for all cell subpopulations in each disease state of each tissue based on the regulon specific score inferred using pySCENIC and by calculating the average expression. |
| Page: 1 |
Top |
Somatic mutation of malignant transformation related genes |
| Annotation of somatic variants for genes involved in malignant transformation |
| Hugo Symbol | Variant Class | Variant Classification | dbSNP RS | HGVSc | HGVSp | HGVSp Short | SWISSPROT | BIOTYPE | SIFT | PolyPhen | Tumor Sample Barcode | Tissue | Histology | Sex | Age | Stage | Therapy Types | Drugs | Outcome |
| ZMYND11 | SNV | Missense_Mutation | c.976N>G | p.Gln326Glu | p.Q326E | Q15326 | protein_coding | deleterious(0.01) | possibly_damaging(0.591) | TCGA-A8-A0A9-01 | Breast | breast invasive carcinoma | Female | >=65 | I/II | Hormone Therapy | anastrozole | SD | |
| ZMYND11 | SNV | Missense_Mutation | c.393N>G | p.Phe131Leu | p.F131L | Q15326 | protein_coding | tolerated(0.86) | benign(0) | TCGA-IR-A3LK-01 | Cervix | cervical & endocervical cancer | Female | >=65 | I/II | Chemotherapy | cisplatin | PD | |
| ZMYND11 | SNV | Missense_Mutation | rs751729106 | c.1475N>A | p.Arg492His | p.R492H | Q15326 | protein_coding | tolerated(0.13) | possibly_damaging(0.904) | TCGA-A6-5666-01 | Colorectum | colon adenocarcinoma | Male | >=65 | I/II | Unknown | Unknown | PD |
| ZMYND11 | SNV | Missense_Mutation | c.289N>C | p.Glu97Gln | p.E97Q | Q15326 | protein_coding | deleterious(0.03) | probably_damaging(0.932) | TCGA-AA-3956-01 | Colorectum | colon adenocarcinoma | Male | >=65 | I/II | Unknown | Unknown | SD | |
| ZMYND11 | SNV | Missense_Mutation | novel | c.632N>A | p.Arg211Gln | p.R211Q | Q15326 | protein_coding | deleterious(0.02) | benign(0.254) | TCGA-AA-3984-01 | Colorectum | colon adenocarcinoma | Female | <65 | I/II | Unknown | Unknown | SD |
| ZMYND11 | SNV | Missense_Mutation | c.919N>A | p.Asp307Asn | p.D307N | Q15326 | protein_coding | deleterious(0) | probably_damaging(1) | TCGA-AA-A010-01 | Colorectum | colon adenocarcinoma | Female | <65 | I/II | Chemotherapy | folinic | CR | |
| ZMYND11 | SNV | Missense_Mutation | c.1139N>T | p.Ser380Phe | p.S380F | Q15326 | protein_coding | deleterious(0) | probably_damaging(0.959) | TCGA-AD-6895-01 | Colorectum | colon adenocarcinoma | Male | >=65 | III/IV | Unknown | Unknown | SD | |
| ZMYND11 | SNV | Missense_Mutation | rs764387198 | c.1474N>T | p.Arg492Cys | p.R492C | Q15326 | protein_coding | deleterious(0) | probably_damaging(0.965) | TCGA-AD-A5EJ-01 | Colorectum | colon adenocarcinoma | Female | >=65 | I/II | Unknown | Unknown | SD |
| ZMYND11 | SNV | Missense_Mutation | c.1709N>T | p.Ala570Val | p.A570V | Q15326 | protein_coding | deleterious(0) | benign(0.042) | TCGA-AM-5821-01 | Colorectum | colon adenocarcinoma | Female | >=65 | I/II | Unknown | Unknown | SD | |
| ZMYND11 | SNV | Missense_Mutation | c.1796N>A | p.Arg599His | p.R599H | Q15326 | protein_coding | deleterious(0) | probably_damaging(0.997) | TCGA-AZ-6601-01 | Colorectum | colon adenocarcinoma | Male | >=65 | I/II | Unknown | Unknown | PD |
| Page: 1 2 3 4 5 6 7 |
Top |
Related drugs of malignant transformation related genes |
| Identification of chemicals and drugs interact with genes involved in malignant transfromation |
| (DGIdb 4.0) |
| Entrez ID | Symbol | Category | Interaction Types | Drug Claim Name | Drug Name | PMIDs |
| Page: 1 |

Copyright 2023-Present -The University of Texas Health Science Center at Houston |