| Tissue | Expression Dynamics | Abbreviation |
| Cervix | 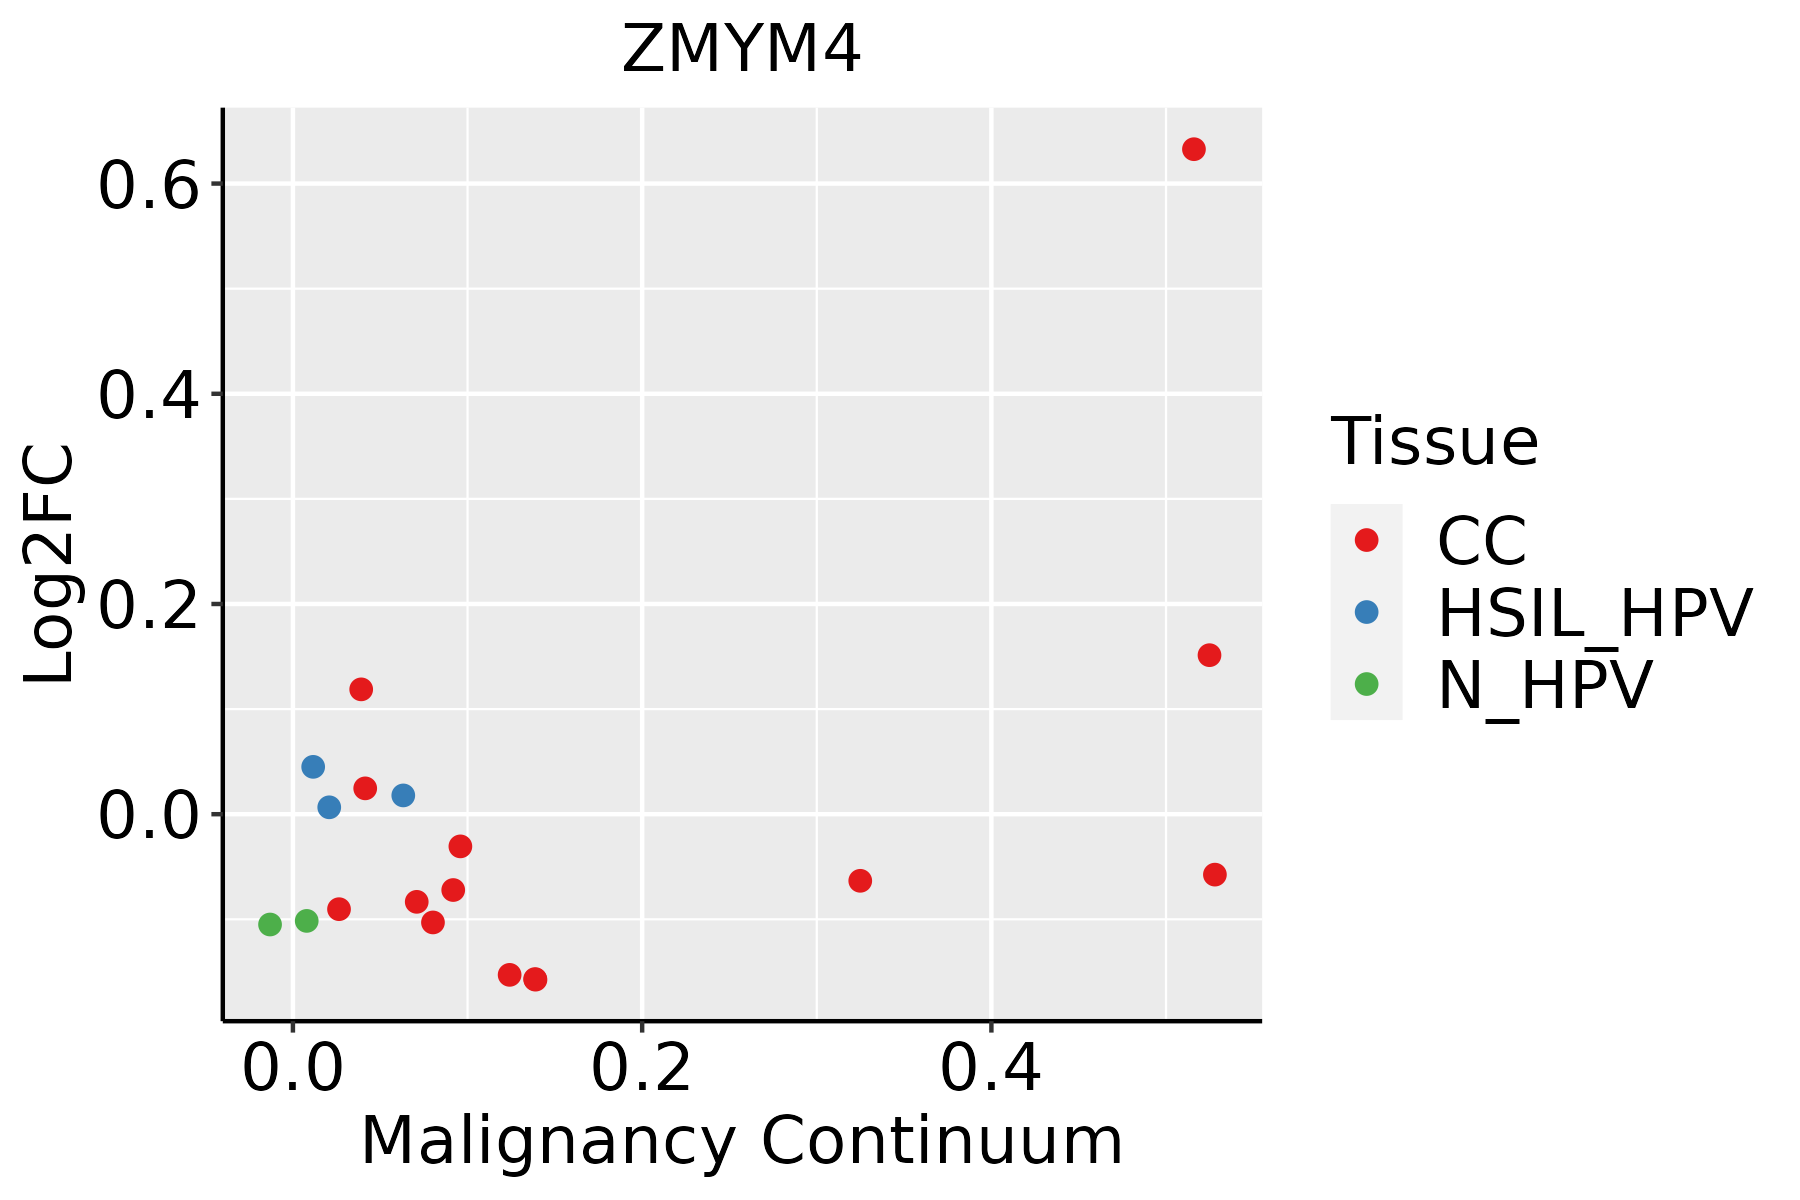 | CC: Cervix cancer |
| HSIL_HPV: HPV-infected high-grade squamous intraepithelial lesions |
| N_HPV: HPV-infected normal cervix |
| Colorectum (GSE201348) |  | FAP: Familial adenomatous polyposis |
| CRC: Colorectal cancer |
| Colorectum (HTA11) |  | AD: Adenomas |
| SER: Sessile serrated lesions |
| MSI-H: Microsatellite-high colorectal cancer |
| MSS: Microsatellite stable colorectal cancer |
| Endometrium | 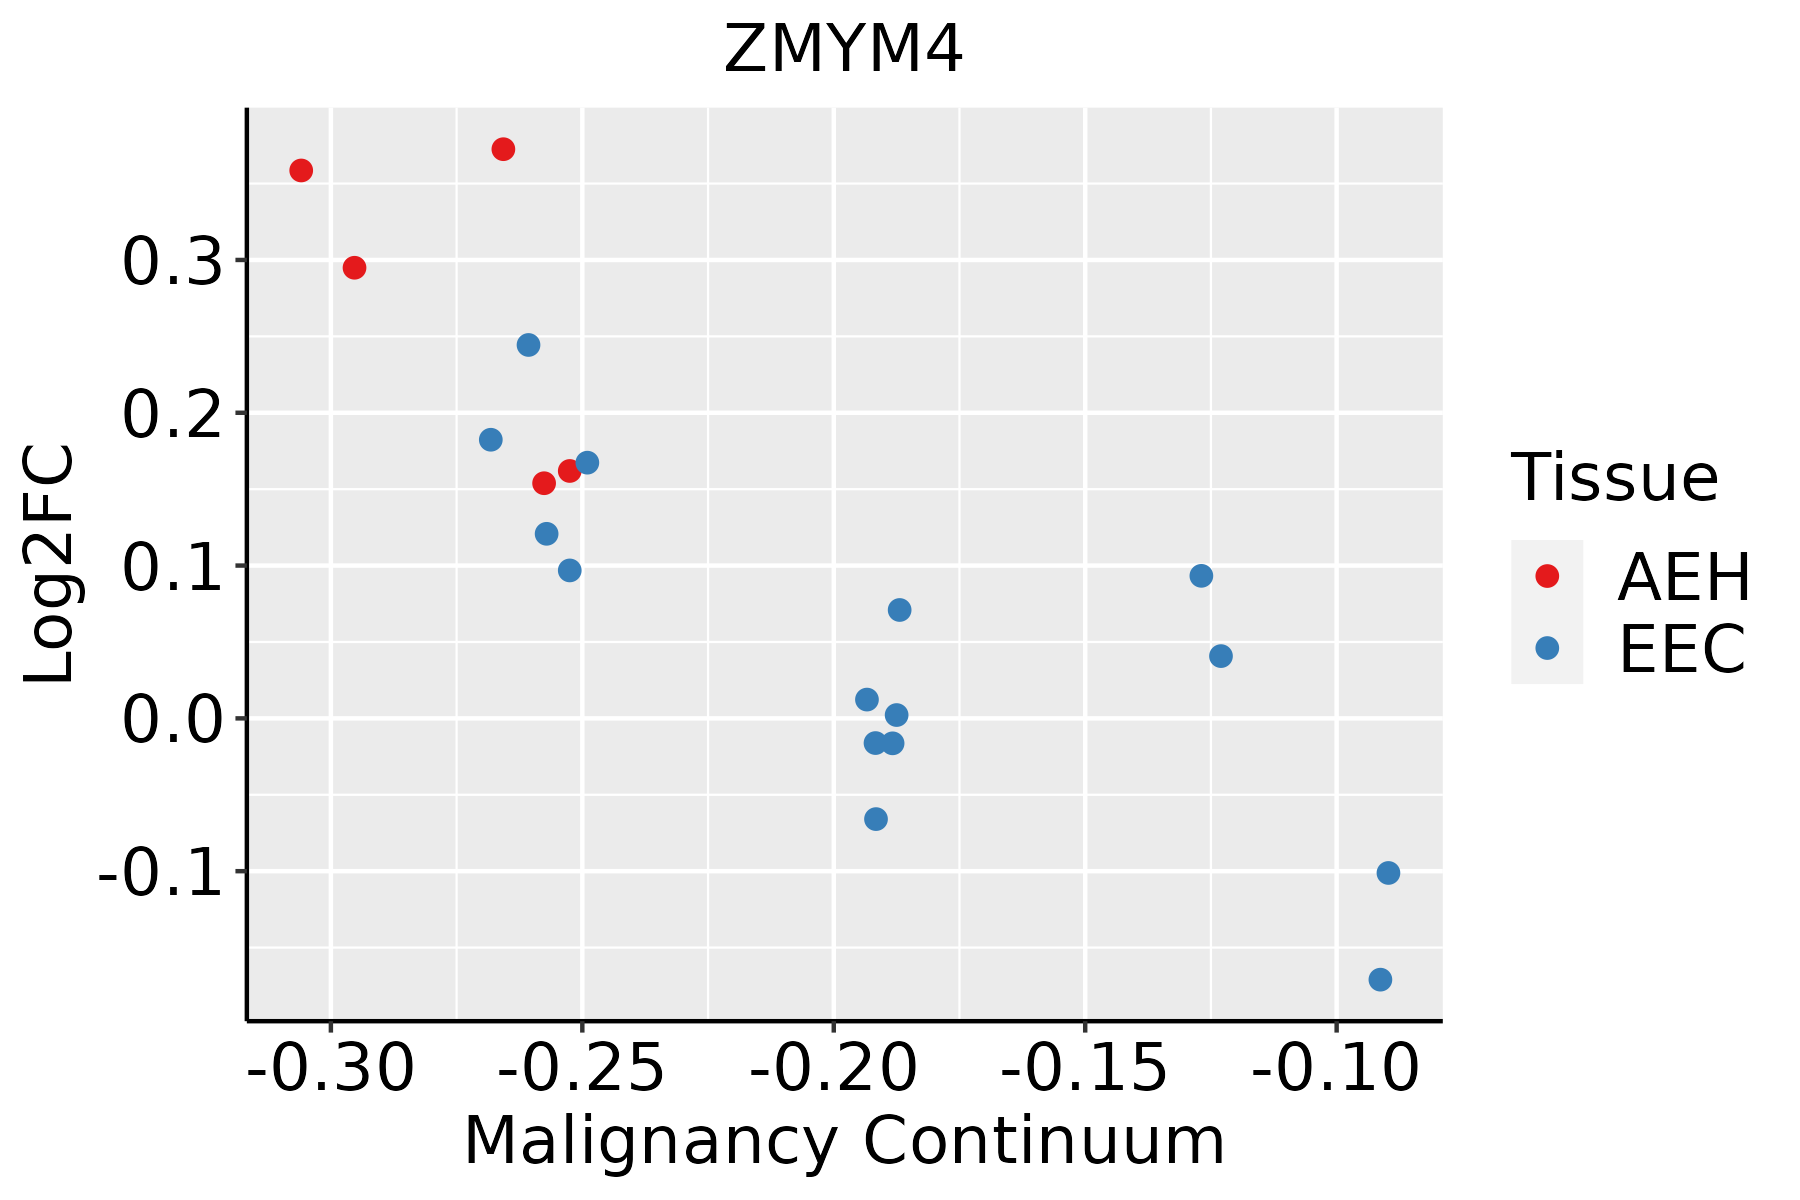 | AEH: Atypical endometrial hyperplasia |
| EEC: Endometrioid Cancer |
| Esophagus | 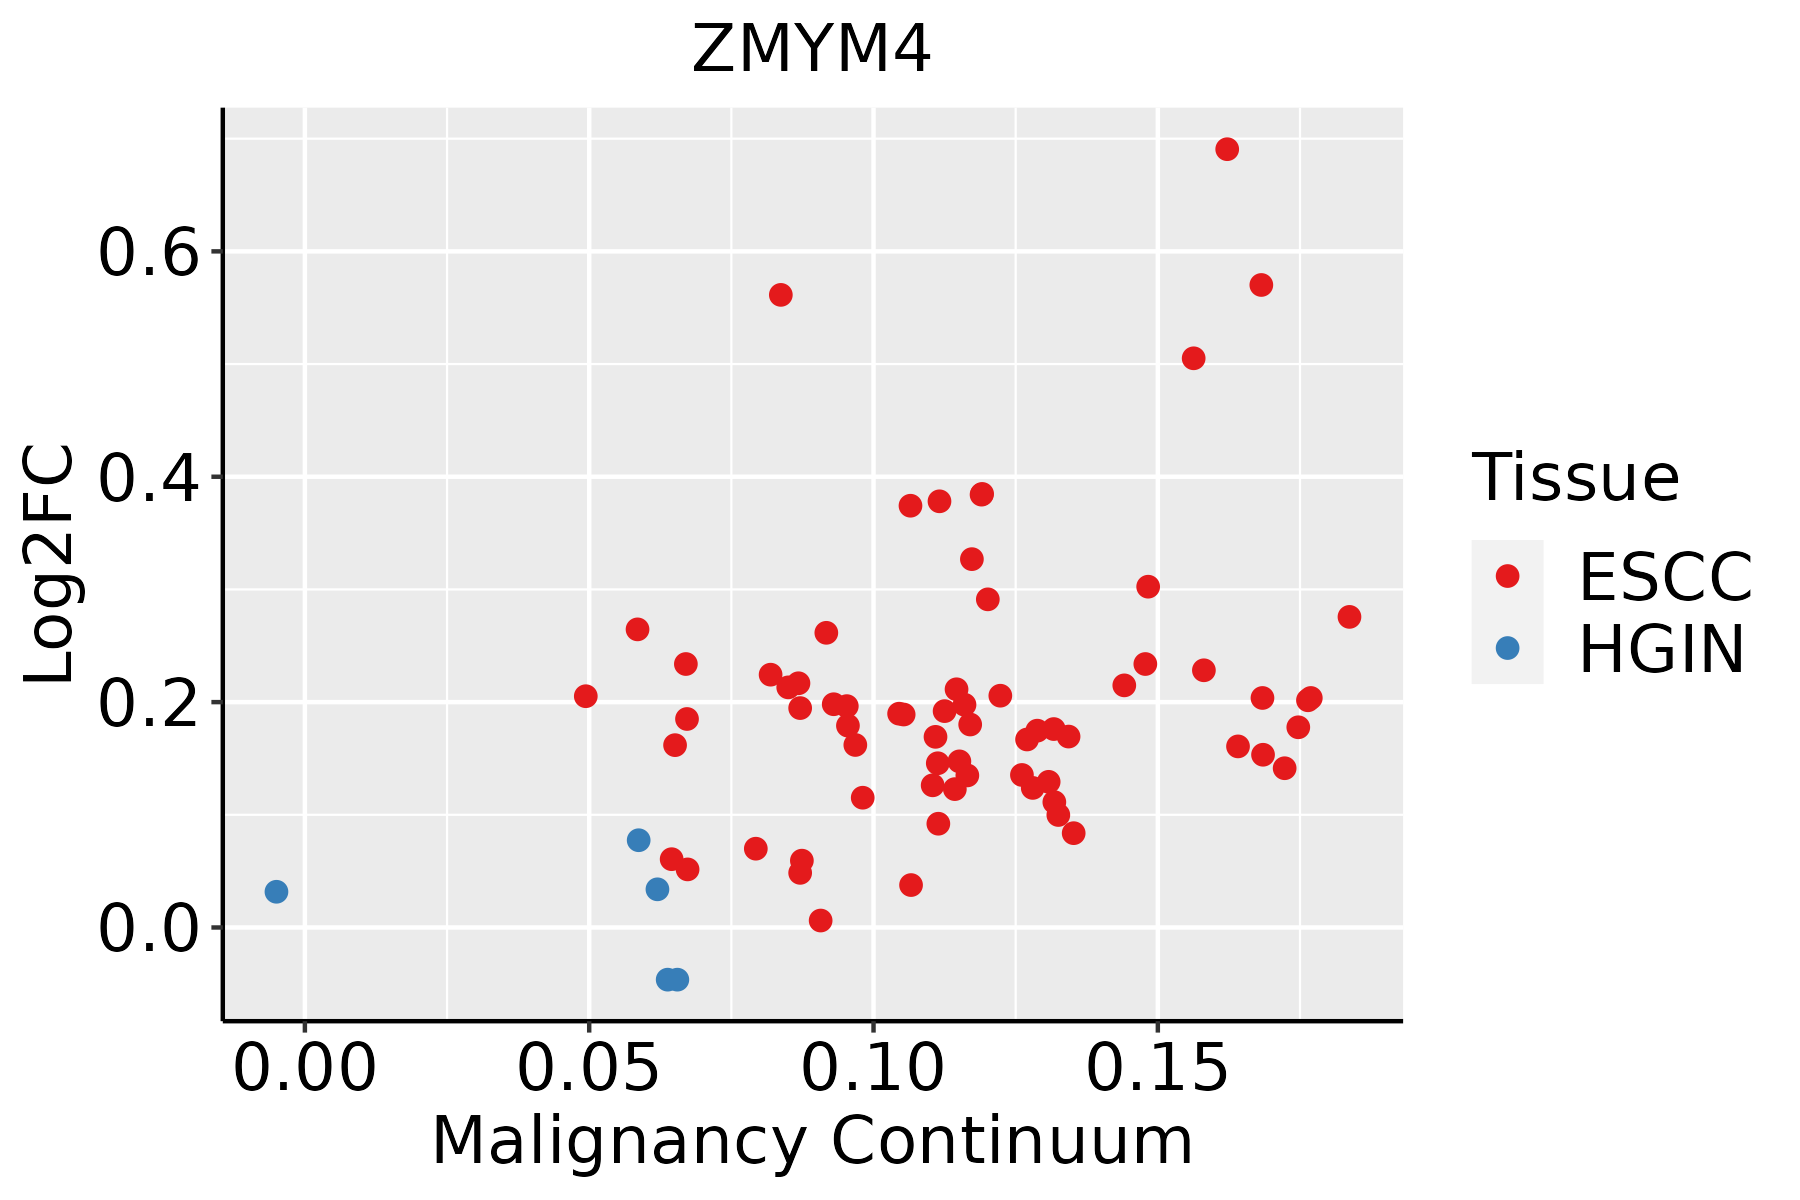 | ESCC: Esophageal squamous cell carcinoma |
| HGIN: High-grade intraepithelial neoplasias |
| LGIN: Low-grade intraepithelial neoplasias |
| Liver | 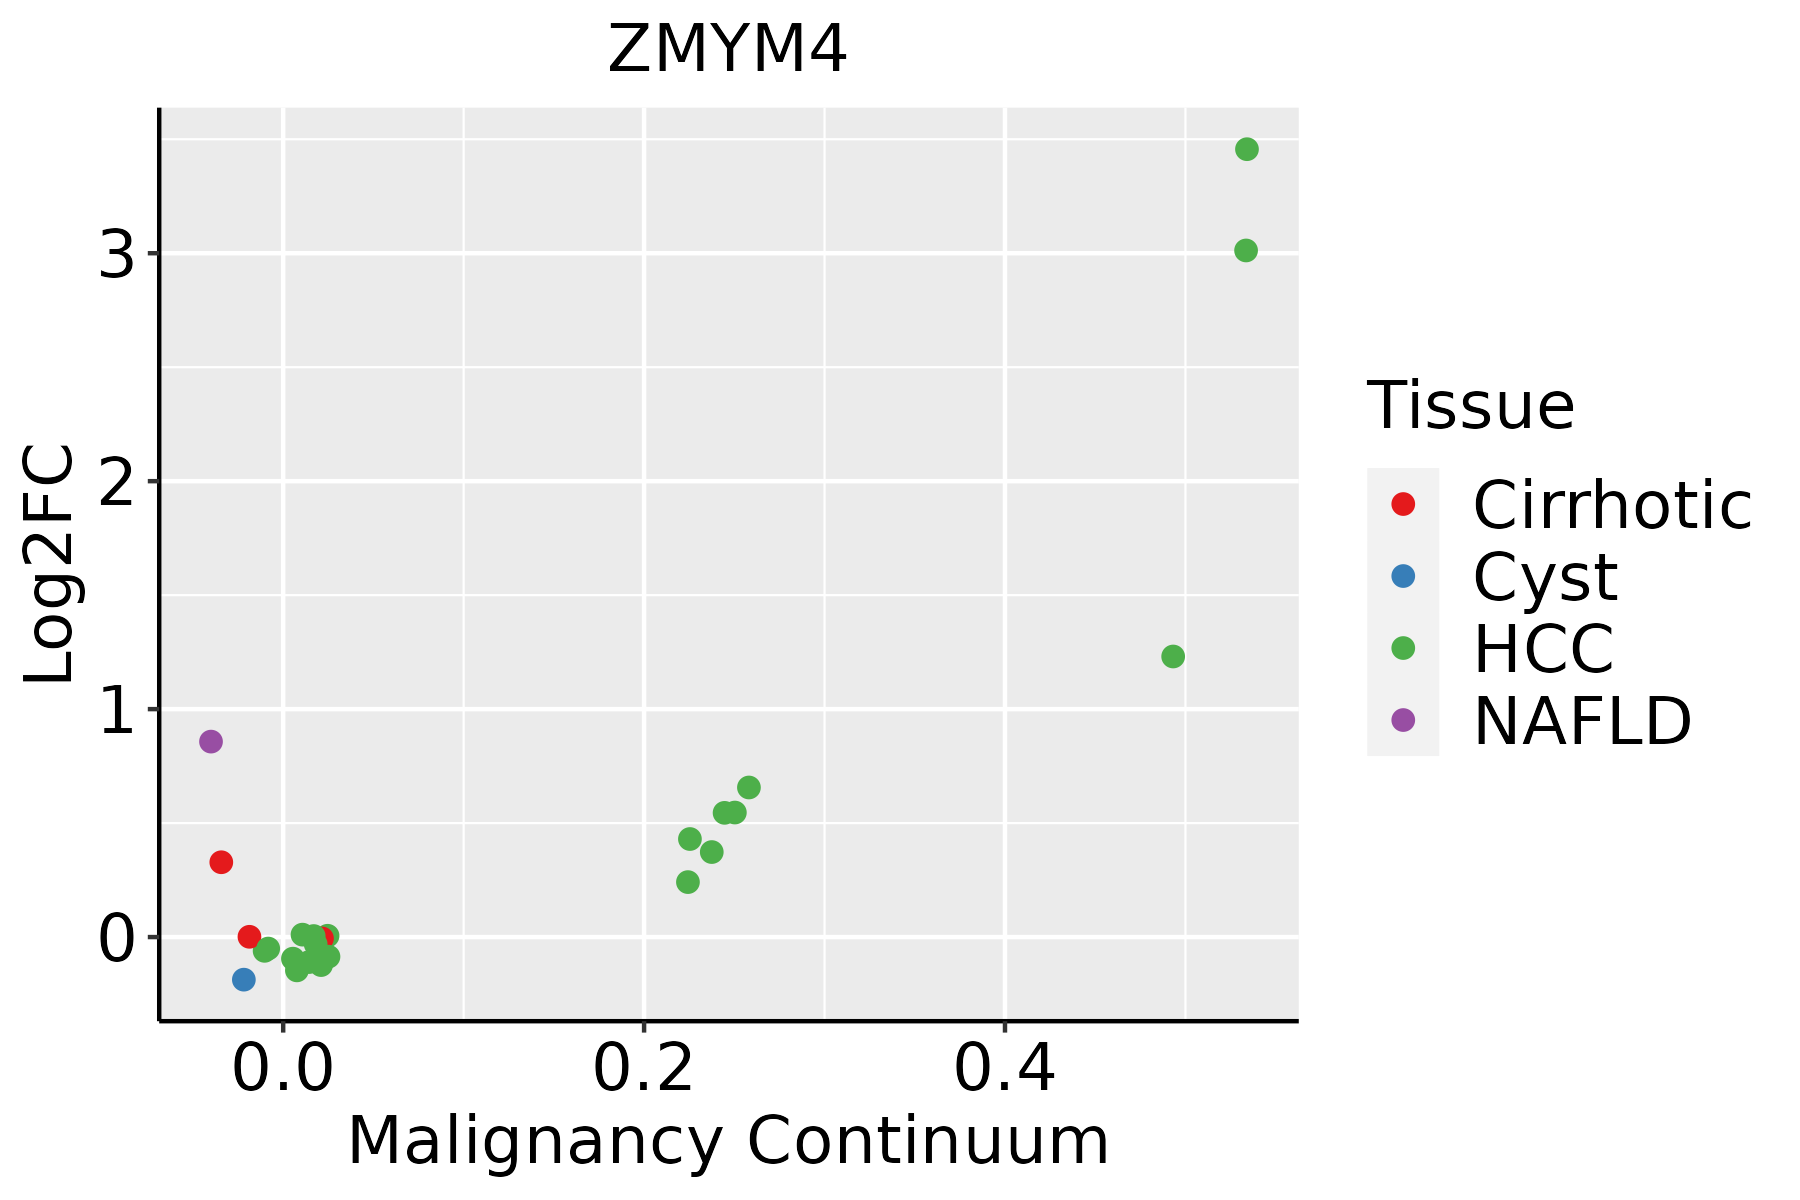 | HCC: Hepatocellular carcinoma |
| NAFLD: Non-alcoholic fatty liver disease |
| Lung | 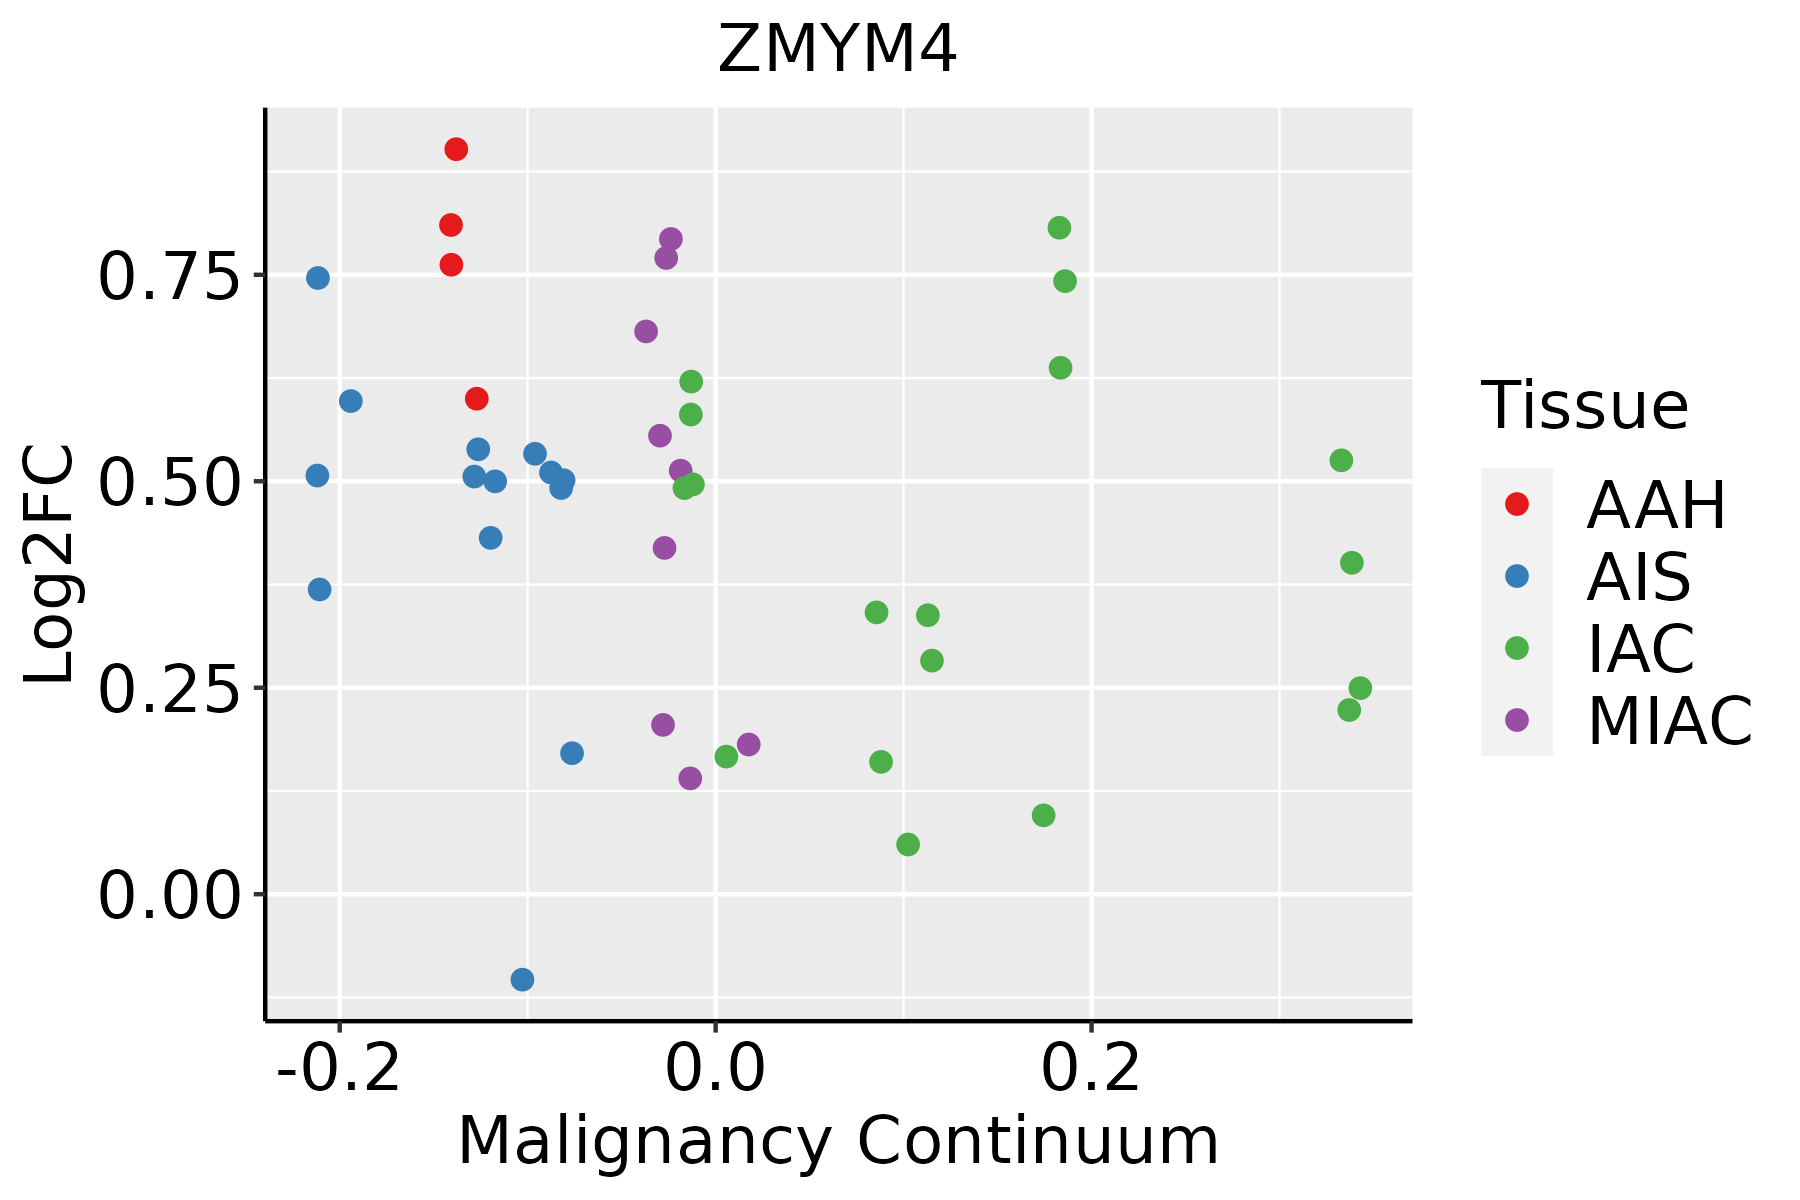 | AAH: Atypical adenomatous hyperplasia |
| AIS: Adenocarcinoma in situ |
| IAC: Invasive lung adenocarcinoma |
| MIA: Minimally invasive adenocarcinoma |
| Prostate | 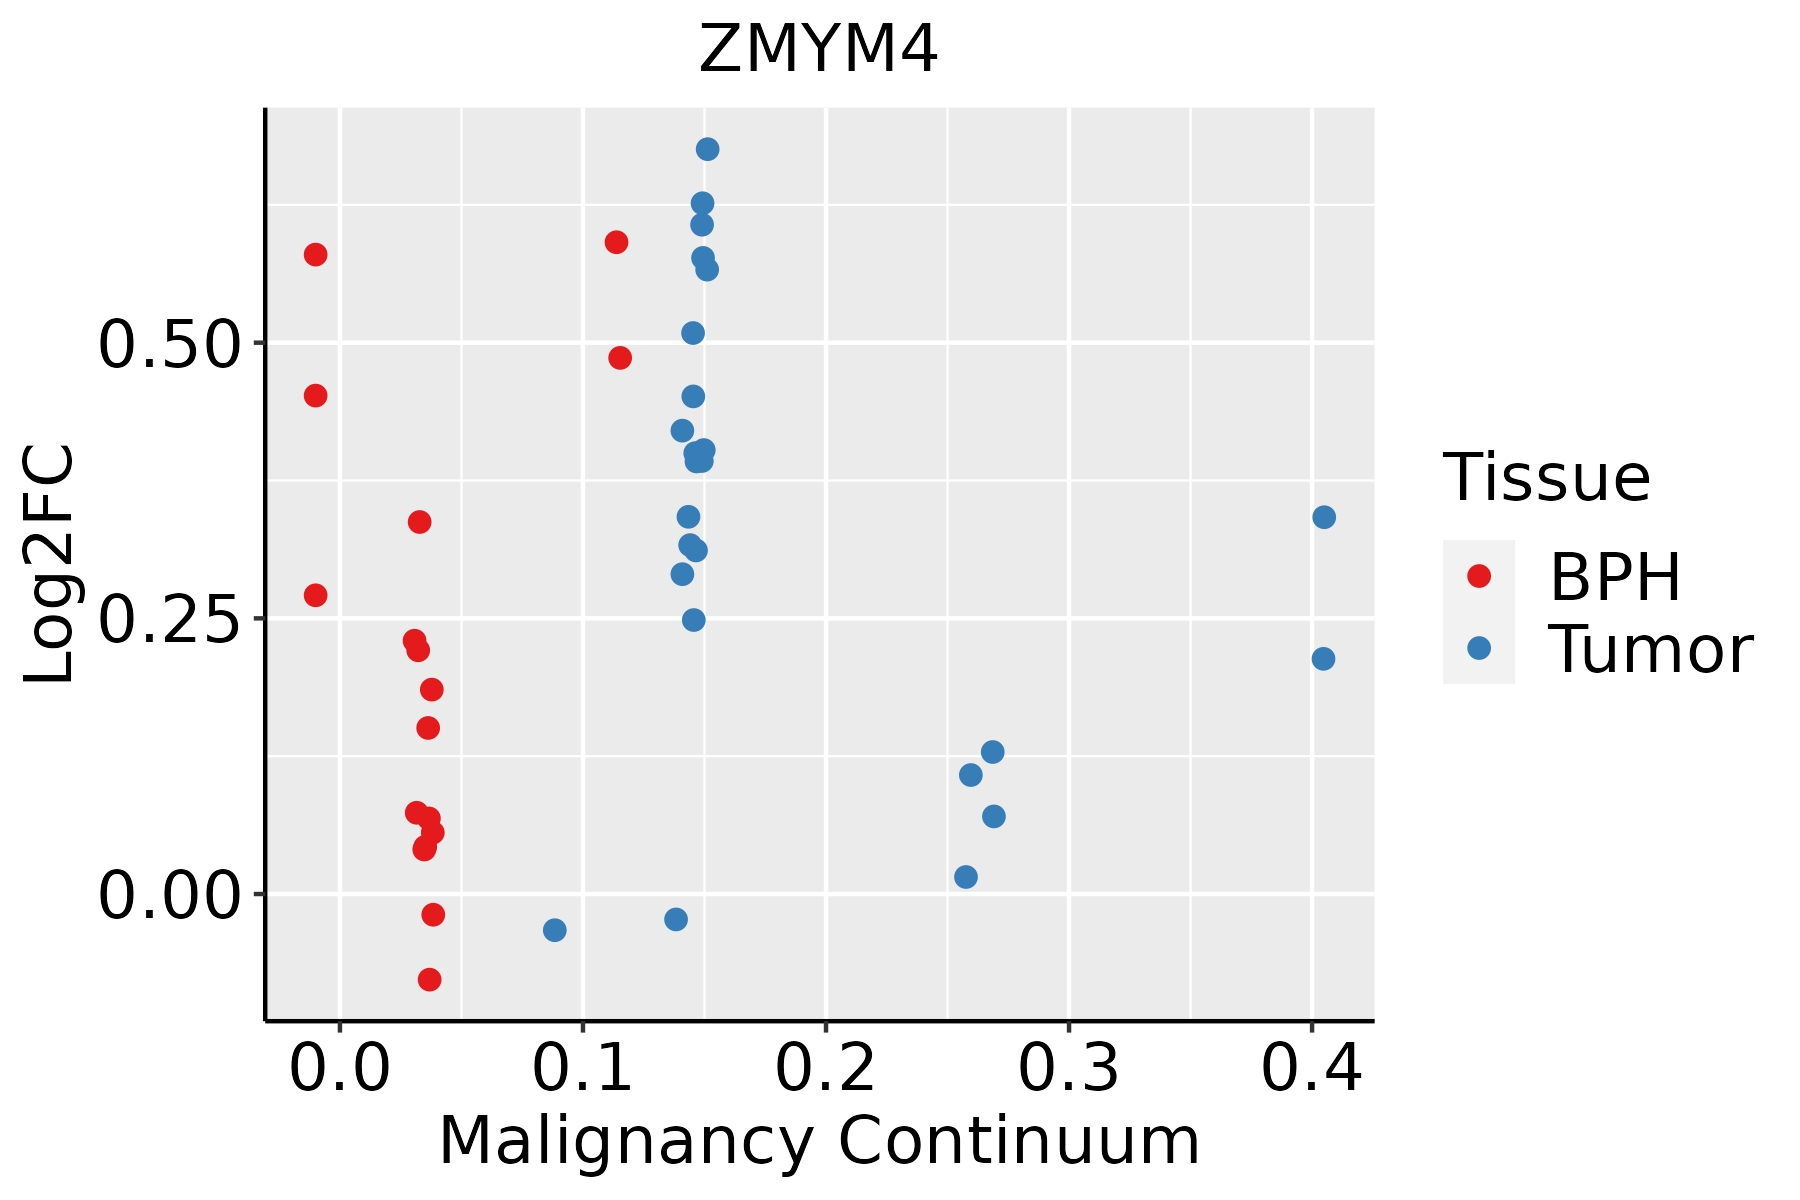 | BPH: Benign Prostatic Hyperplasia |
| Skin | 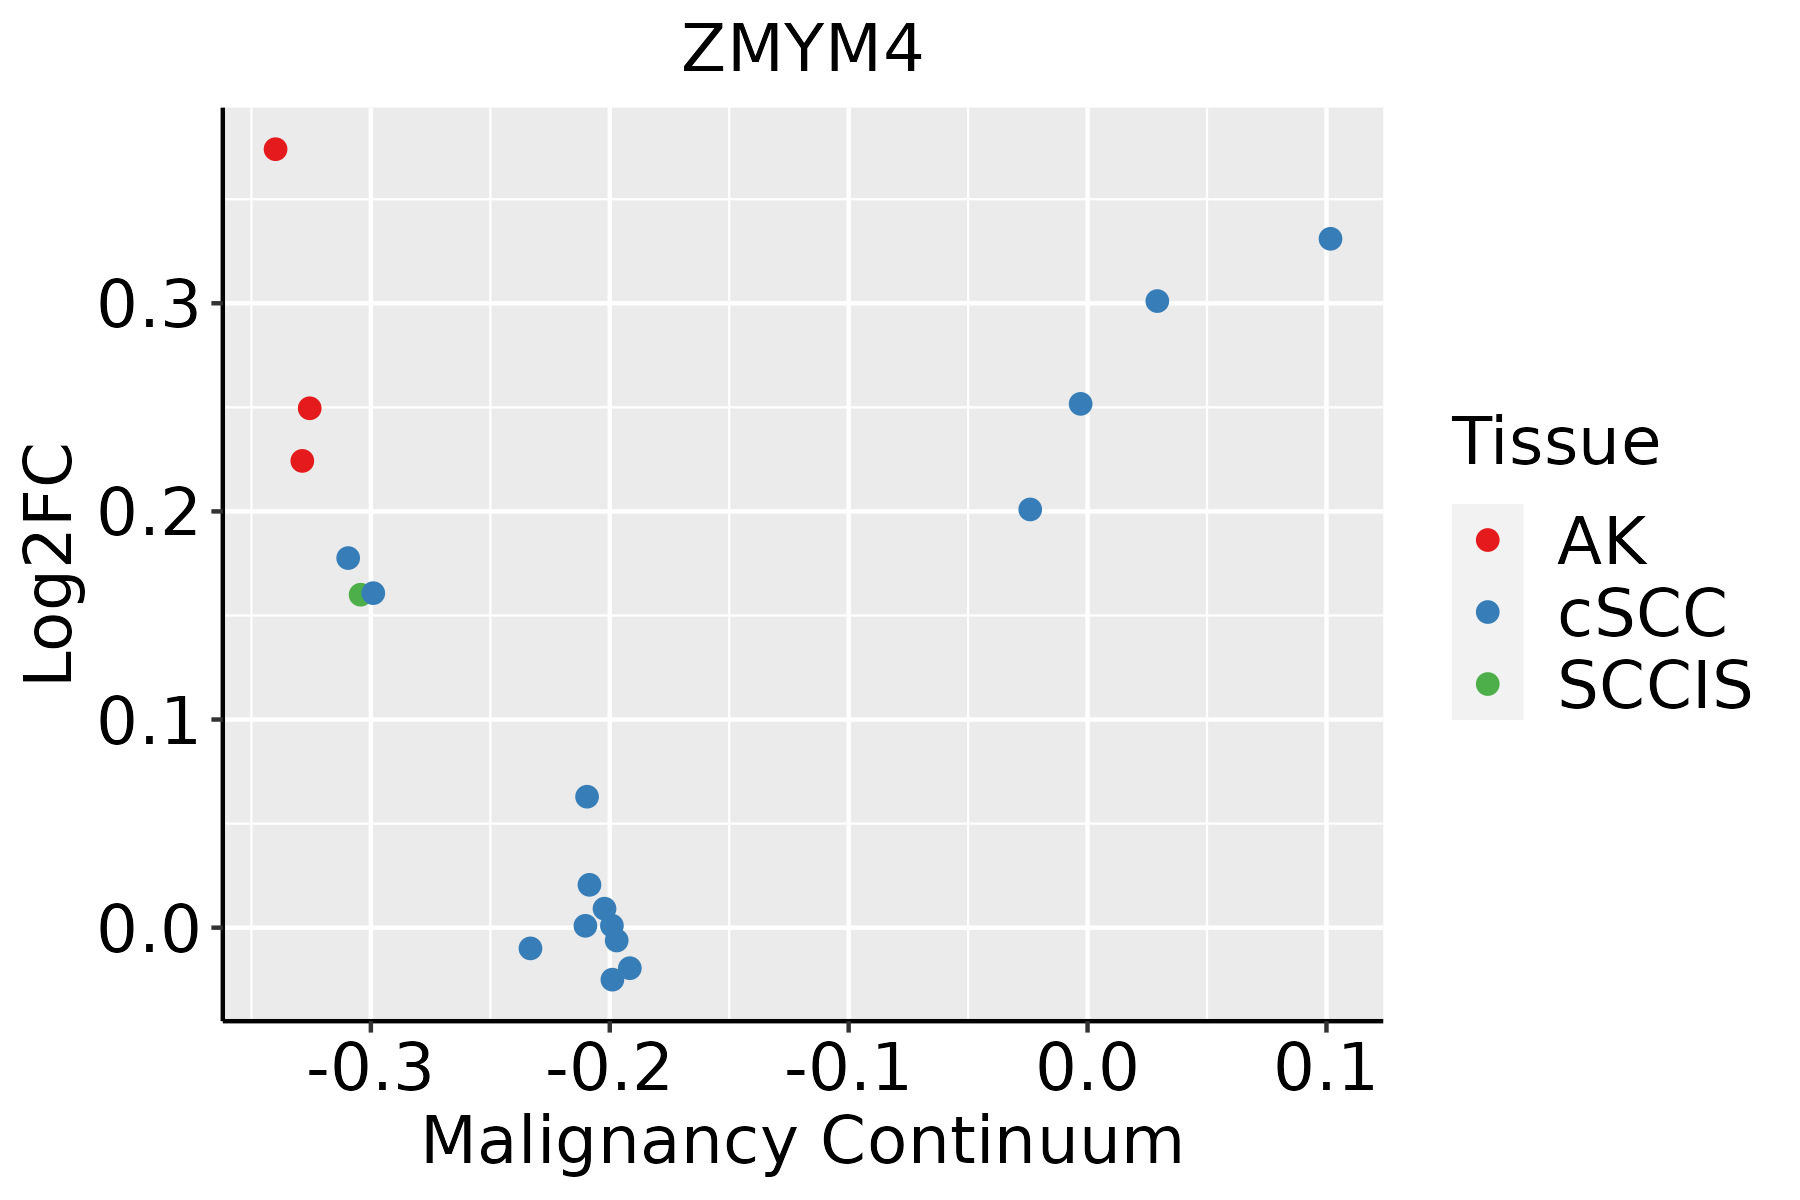 | AK: Actinic keratosis |
| cSCC: Cutaneous squamous cell carcinoma |
| SCCIS:squamous cell carcinoma in situ |
| Thyroid | 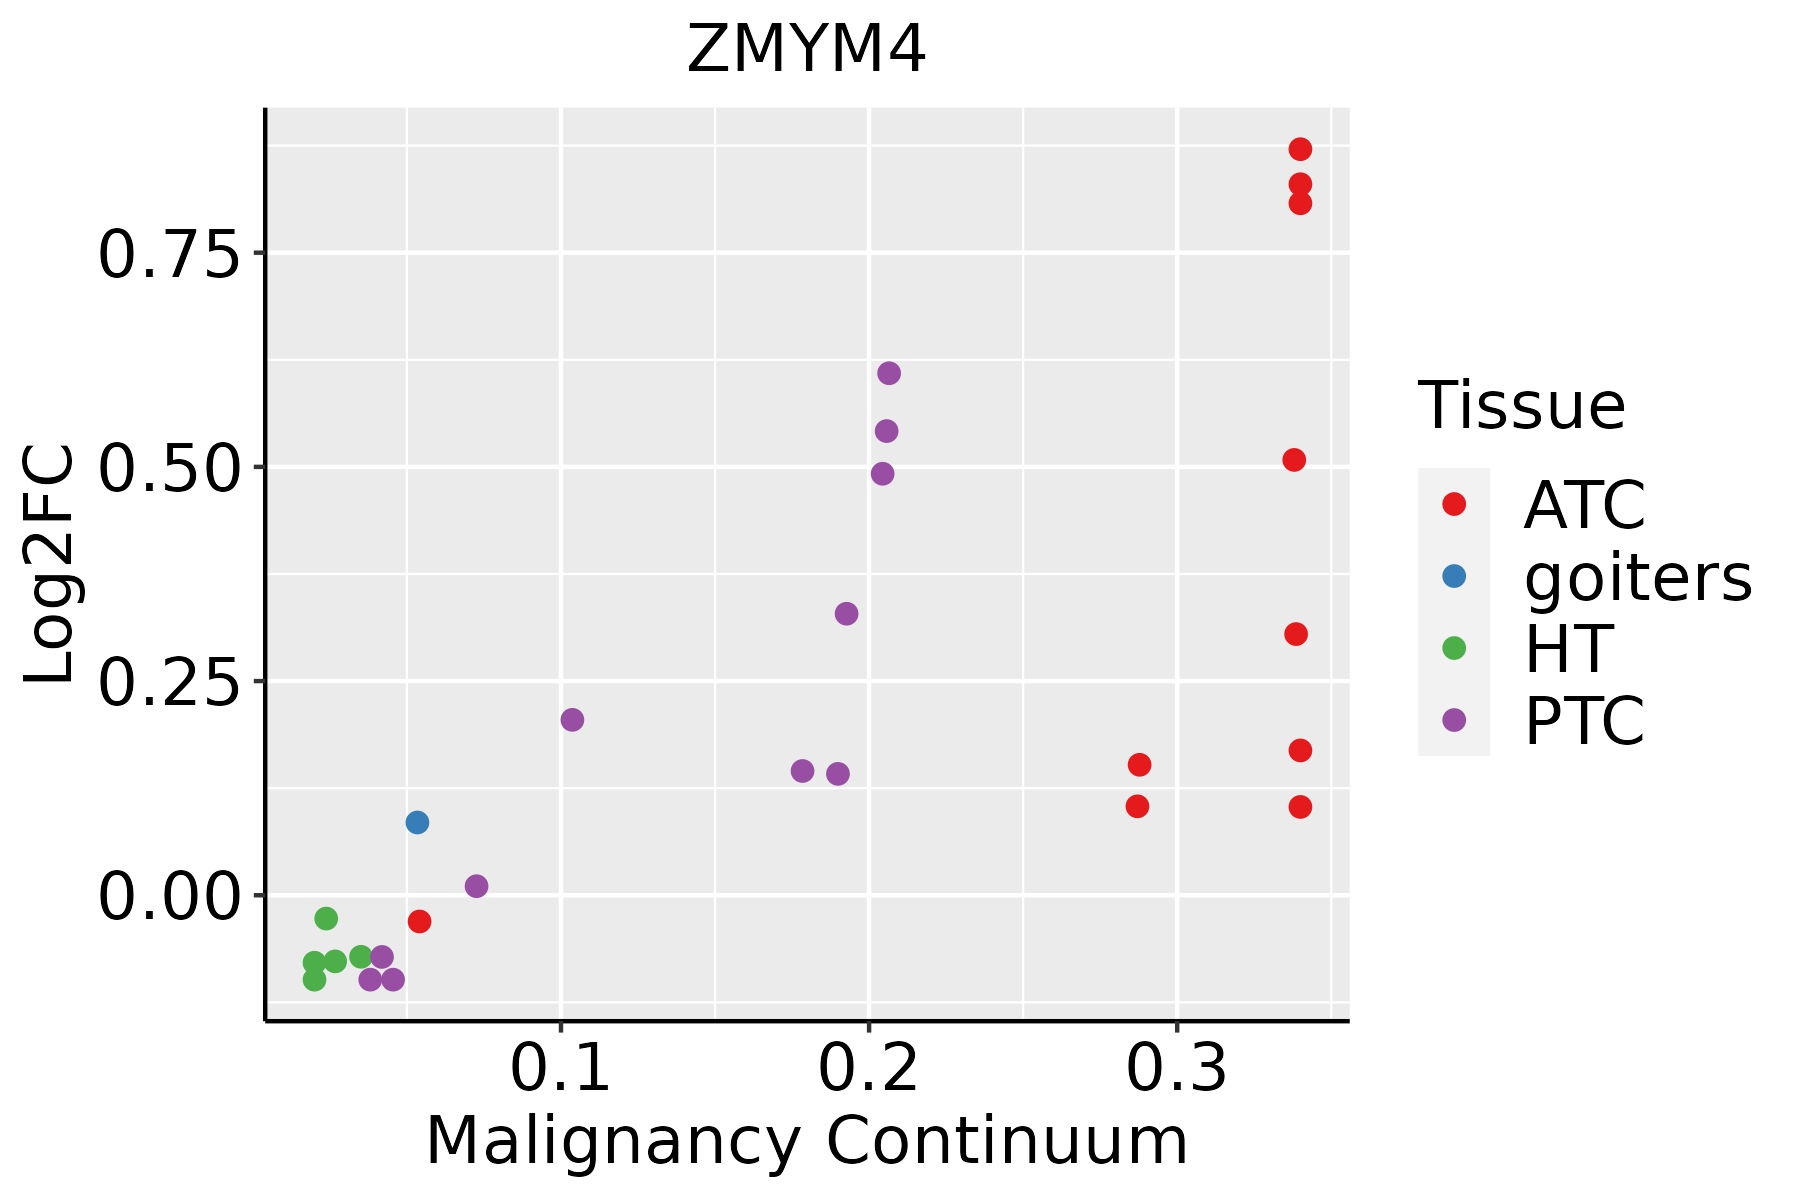 | ATC: Anaplastic thyroid cancer |
| HT: Hashimoto's thyroiditis |
| PTC: Papillary thyroid cancer |
| GO ID | Tissue | Disease Stage | Description | Gene Ratio | Bg Ratio | pvalue | p.adjust | Count |
| GO:002260410 | Cervix | CC | regulation of cell morphogenesis | 84/2311 | 309/18723 | 1.00e-12 | 4.29e-10 | 84 |
| GO:0022604 | Colorectum | AD | regulation of cell morphogenesis | 109/3918 | 309/18723 | 3.08e-09 | 2.07e-07 | 109 |
| GO:00226041 | Colorectum | SER | regulation of cell morphogenesis | 89/2897 | 309/18723 | 1.51e-09 | 1.52e-07 | 89 |
| GO:00226042 | Colorectum | MSS | regulation of cell morphogenesis | 103/3467 | 309/18723 | 2.70e-10 | 2.56e-08 | 103 |
| GO:00226044 | Colorectum | FAP | regulation of cell morphogenesis | 87/2622 | 309/18723 | 4.89e-11 | 1.87e-08 | 87 |
| GO:00226045 | Colorectum | CRC | regulation of cell morphogenesis | 74/2078 | 309/18723 | 9.25e-11 | 5.04e-08 | 74 |
| GO:002260415 | Endometrium | AEH | regulation of cell morphogenesis | 79/2100 | 309/18723 | 1.04e-12 | 2.24e-10 | 79 |
| GO:002260416 | Endometrium | EEC | regulation of cell morphogenesis | 78/2168 | 309/18723 | 1.45e-11 | 2.28e-09 | 78 |
| GO:002260420 | Esophagus | ESCC | regulation of cell morphogenesis | 180/8552 | 309/18723 | 5.19e-06 | 5.45e-05 | 180 |
| GO:00226047 | Liver | NAFLD | regulation of cell morphogenesis | 62/1882 | 309/18723 | 8.35e-08 | 7.09e-06 | 62 |
| GO:002260412 | Liver | Cirrhotic | regulation of cell morphogenesis | 127/4634 | 309/18723 | 1.45e-10 | 7.44e-09 | 127 |
| GO:002260422 | Liver | HCC | regulation of cell morphogenesis | 188/7958 | 309/18723 | 4.84e-11 | 1.82e-09 | 188 |
| GO:00226048 | Lung | IAC | regulation of cell morphogenesis | 74/2061 | 309/18723 | 6.31e-11 | 1.70e-08 | 74 |
| GO:002260413 | Lung | AIS | regulation of cell morphogenesis | 65/1849 | 309/18723 | 2.97e-09 | 5.09e-07 | 65 |
| GO:002260423 | Lung | AAH | regulation of cell morphogenesis | 30/613 | 309/18723 | 1.18e-07 | 6.77e-05 | 30 |
| GO:002260432 | Lung | MIAC | regulation of cell morphogenesis | 38/967 | 309/18723 | 6.47e-07 | 9.76e-05 | 38 |
| GO:002260417 | Prostate | BPH | regulation of cell morphogenesis | 99/3107 | 309/18723 | 1.30e-11 | 9.72e-10 | 99 |
| GO:002260418 | Prostate | Tumor | regulation of cell morphogenesis | 102/3246 | 309/18723 | 1.25e-11 | 9.49e-10 | 102 |
| GO:002260426 | Skin | AK | regulation of cell morphogenesis | 66/1910 | 309/18723 | 4.34e-09 | 3.30e-07 | 66 |
| GO:0022604111 | Skin | SCCIS | regulation of cell morphogenesis | 36/919 | 309/18723 | 1.41e-06 | 8.79e-05 | 36 |
| Hugo Symbol | Variant Class | Variant Classification | dbSNP RS | HGVSc | HGVSp | HGVSp Short | SWISSPROT | BIOTYPE | SIFT | PolyPhen | Tumor Sample Barcode | Tissue | Histology | Sex | Age | Stage | Therapy Types | Drugs | Outcome |
| ZMYM4 | SNV | Missense_Mutation | | c.883N>G | p.Leu295Val | p.L295V | Q5VZL5 | protein_coding | deleterious(0.01) | benign(0.217) | TCGA-AN-A0XN-01 | Breast | breast invasive carcinoma | Female | >=65 | III/IV | Unknown | Unknown | SD |
| ZMYM4 | SNV | Missense_Mutation | | c.1813N>G | p.Tyr605Asp | p.Y605D | Q5VZL5 | protein_coding | deleterious(0.02) | possibly_damaging(0.84) | TCGA-AO-A0J4-01 | Breast | breast invasive carcinoma | Female | <65 | I/II | Chemotherapy | doxorubicin | SD |
| ZMYM4 | SNV | Missense_Mutation | rs765573029 | c.1595N>T | p.Ala532Val | p.A532V | Q5VZL5 | protein_coding | tolerated(0.08) | benign(0.017) | TCGA-AO-A128-01 | Breast | breast invasive carcinoma | Female | <65 | I/II | Chemotherapy | doxorubicin | SD |
| ZMYM4 | SNV | Missense_Mutation | | c.949C>G | p.Gln317Glu | p.Q317E | Q5VZL5 | protein_coding | tolerated(1) | benign(0.119) | TCGA-AR-A0TX-01 | Breast | breast invasive carcinoma | Female | <65 | I/II | Unknown | Unknown | SD |
| ZMYM4 | SNV | Missense_Mutation | | c.3596C>T | p.Ser1199Leu | p.S1199L | Q5VZL5 | protein_coding | deleterious(0.01) | benign(0.092) | TCGA-B6-A0IK-01 | Breast | breast invasive carcinoma | Female | <65 | III/IV | Unknown | Unknown | PD |
| ZMYM4 | SNV | Missense_Mutation | novel | c.3703N>T | p.Val1235Phe | p.V1235F | Q5VZL5 | protein_coding | tolerated_low_confidence(0.36) | benign(0.027) | TCGA-BH-A0C7-01 | Breast | breast invasive carcinoma | Female | <65 | I/II | Chemotherapy | adriamycin | CR |
| ZMYM4 | SNV | Missense_Mutation | | c.3849N>C | p.Leu1283Phe | p.L1283F | Q5VZL5 | protein_coding | deleterious(0) | probably_damaging(0.95) | TCGA-E2-A159-01 | Breast | breast invasive carcinoma | Female | <65 | I/II | Chemotherapy | cyclophosphamide | SD |
| ZMYM4 | SNV | Missense_Mutation | | c.2001N>C | p.Gln667His | p.Q667H | Q5VZL5 | protein_coding | deleterious(0.01) | benign(0.062) | TCGA-E9-A22E-01 | Breast | breast invasive carcinoma | Female | <65 | III/IV | Chemotherapy | cyclophosphane | SD |
| ZMYM4 | SNV | Missense_Mutation | novel | c.1916C>A | p.Thr639Lys | p.T639K | Q5VZL5 | protein_coding | tolerated(0.94) | benign(0.003) | TCGA-E9-A54Y-01 | Breast | breast invasive carcinoma | Female | <65 | III/IV | Unknown | Unknown | SD |
| ZMYM4 | insertion | Nonsense_Mutation | novel | c.4629_4630insAGAATCCTTGAACCTGGGTGGAGGCTGCAGTGAGC | p.Val1544ArgfsTer11 | p.V1544Rfs*11 | Q5VZL5 | protein_coding | | | TCGA-A2-A0CP-01 | Breast | breast invasive carcinoma | Female | <65 | I/II | Chemotherapy | cytoxan | SD |


