
|
|||||
|
 | |
| |
| |
| |
| |
| |
|
Gene: ZMIZ2 |
Gene summary for ZMIZ2 |
| Gene information | Species | Human | Gene symbol | ZMIZ2 | Gene ID | 83637 |
| Gene name | zinc finger MIZ-type containing 2 | |
| Gene Alias | NET27 | |
| Cytomap | 7p13 | |
| Gene Type | protein-coding | GO ID | GO:0006139 | UniProtAcc | Q8NF64 |
Top |
Malignant transformation analysis |
| Identification of the aberrant gene expression in precancerous and cancerous lesions by comparing the gene expression of stem-like cells in diseased tissues with normal stem cells |
| Entrez ID | Symbol | Replicates | Species | Organ | Tissue | Adj P-value | Log2FC | Malignancy |
| 83637 | ZMIZ2 | HTA11_3410_2000001011 | Human | Colorectum | AD | 1.41e-05 | 2.35e-01 | 0.0155 |
| 83637 | ZMIZ2 | HTA11_1938_2000001011 | Human | Colorectum | AD | 6.46e-08 | 4.03e-01 | -0.0811 |
| 83637 | ZMIZ2 | HTA11_347_2000001011 | Human | Colorectum | AD | 6.42e-07 | 2.27e-01 | -0.1954 |
| 83637 | ZMIZ2 | HTA11_3361_2000001011 | Human | Colorectum | AD | 1.04e-02 | 2.99e-01 | -0.1207 |
| 83637 | ZMIZ2 | HTA11_696_2000001011 | Human | Colorectum | AD | 1.19e-05 | 4.31e-01 | -0.1464 |
| 83637 | ZMIZ2 | HTA11_866_2000001011 | Human | Colorectum | AD | 2.26e-02 | 2.36e-01 | -0.1001 |
| 83637 | ZMIZ2 | HTA11_1391_2000001011 | Human | Colorectum | AD | 3.67e-09 | 4.54e-01 | -0.059 |
| 83637 | ZMIZ2 | HTA11_866_3004761011 | Human | Colorectum | AD | 2.07e-02 | 2.33e-01 | 0.096 |
| 83637 | ZMIZ2 | HTA11_10711_2000001011 | Human | Colorectum | AD | 1.30e-04 | 4.83e-01 | 0.0338 |
| 83637 | ZMIZ2 | HTA11_7696_3000711011 | Human | Colorectum | AD | 1.19e-09 | 5.15e-01 | 0.0674 |
| 83637 | ZMIZ2 | HTA11_6818_2000001011 | Human | Colorectum | AD | 6.85e-05 | 5.99e-01 | 0.0112 |
| 83637 | ZMIZ2 | HTA11_6818_2000001021 | Human | Colorectum | AD | 7.04e-04 | 3.55e-01 | 0.0588 |
| 83637 | ZMIZ2 | HTA11_99999971662_82457 | Human | Colorectum | MSS | 9.79e-08 | 4.58e-01 | 0.3859 |
| 83637 | ZMIZ2 | HTA11_99999973899_84307 | Human | Colorectum | MSS | 4.06e-05 | 6.14e-01 | 0.2585 |
| 83637 | ZMIZ2 | HTA11_99999974143_84620 | Human | Colorectum | MSS | 1.69e-12 | 5.52e-01 | 0.3005 |
| 83637 | ZMIZ2 | A015-C-203 | Human | Colorectum | FAP | 1.78e-13 | 4.65e-01 | -0.1294 |
| 83637 | ZMIZ2 | A015-C-204 | Human | Colorectum | FAP | 5.05e-04 | 4.98e-01 | -0.0228 |
| 83637 | ZMIZ2 | A002-C-201 | Human | Colorectum | FAP | 3.21e-03 | 3.97e-01 | 0.0324 |
| 83637 | ZMIZ2 | A002-C-203 | Human | Colorectum | FAP | 4.85e-05 | 3.78e-01 | 0.2786 |
| 83637 | ZMIZ2 | A015-C-006 | Human | Colorectum | FAP | 7.71e-04 | 4.11e-01 | -0.0994 |
| Page: 1 2 3 4 5 |
| Tissue | Expression Dynamics | Abbreviation |
| Colorectum (GSE201348) |  | FAP: Familial adenomatous polyposis |
| CRC: Colorectal cancer | ||
| Colorectum (HTA11) |  | AD: Adenomas |
| SER: Sessile serrated lesions | ||
| MSI-H: Microsatellite-high colorectal cancer | ||
| MSS: Microsatellite stable colorectal cancer | ||
| Esophagus | 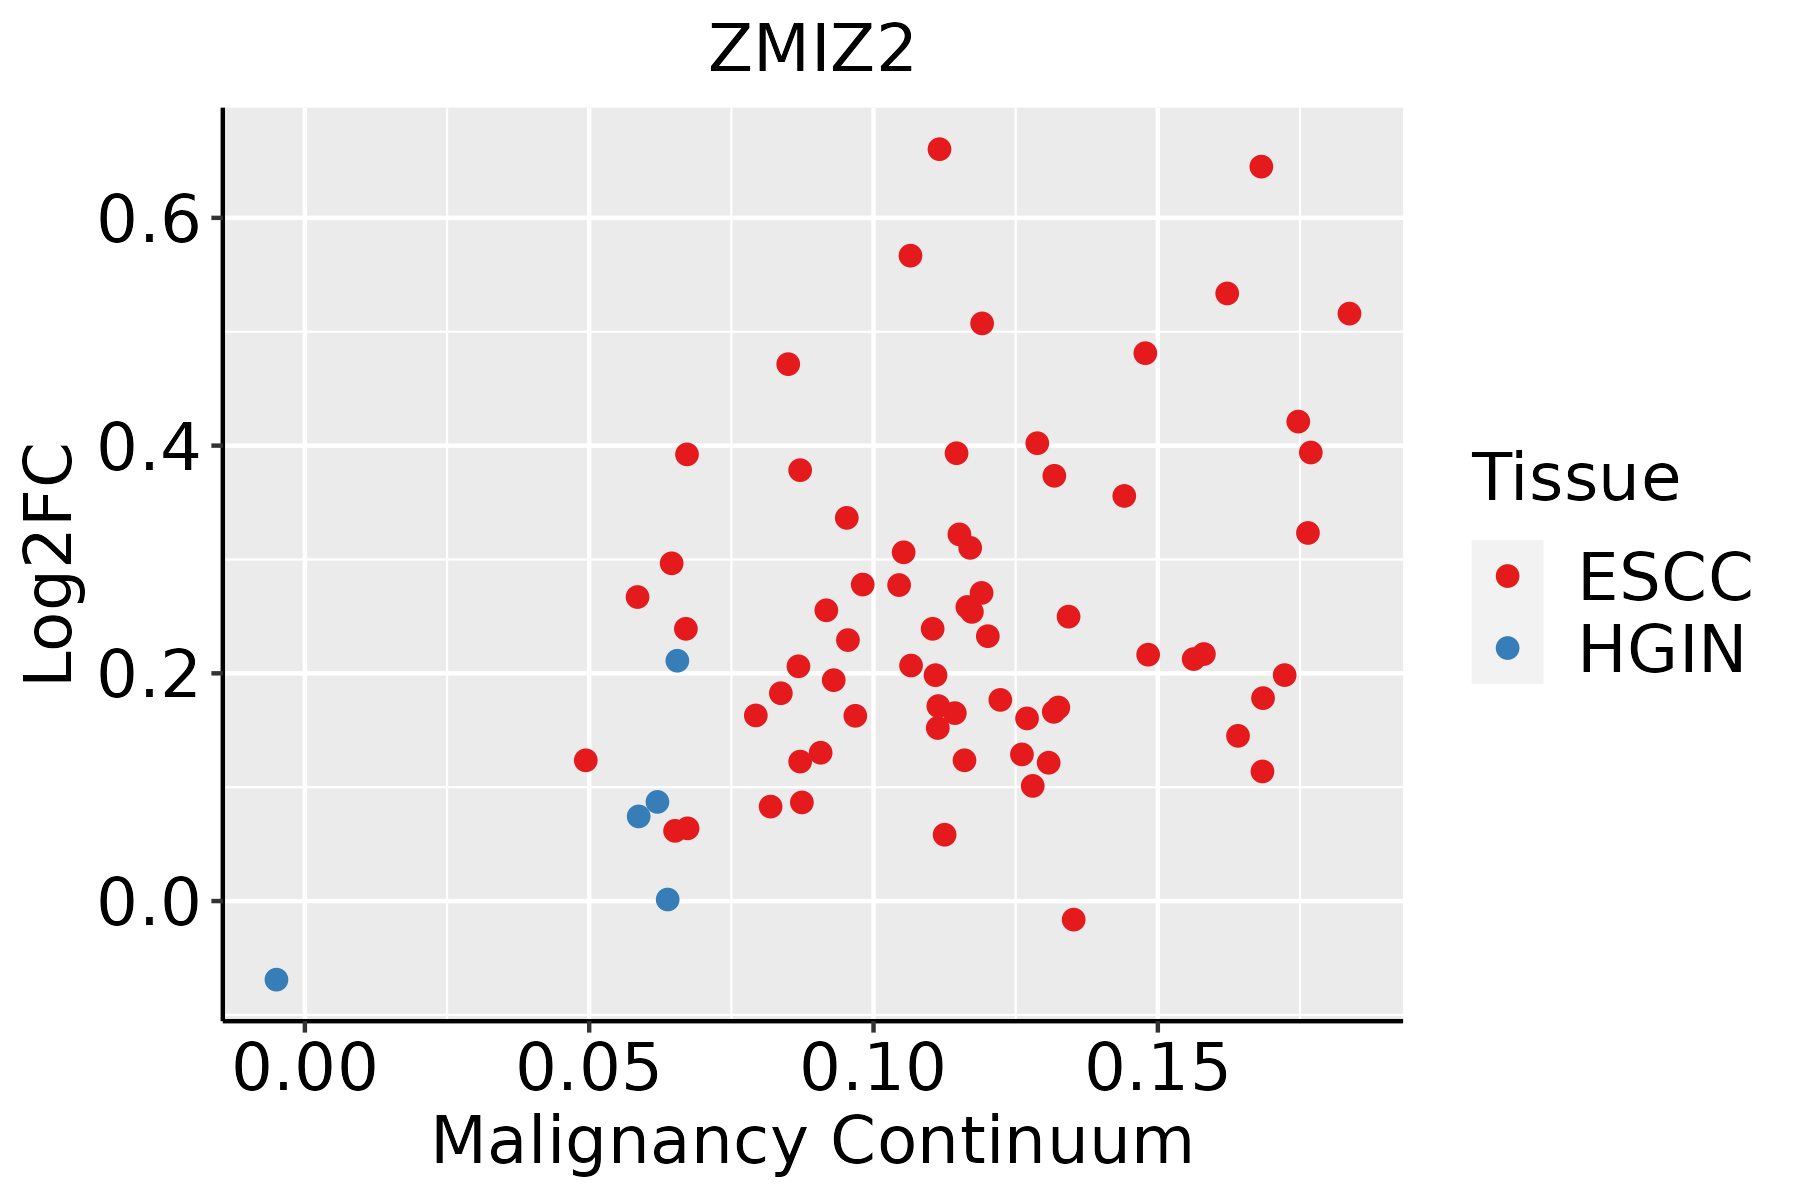 | ESCC: Esophageal squamous cell carcinoma |
| HGIN: High-grade intraepithelial neoplasias | ||
| LGIN: Low-grade intraepithelial neoplasias | ||
| Liver |  | HCC: Hepatocellular carcinoma |
| NAFLD: Non-alcoholic fatty liver disease |
| ∗log2FC in expression of this searched gene in stem-like cells from each diseased tissue sample relative to stem-like cells in normal samples in each tissue plotted against the malignancy continuum. Samples are colored based on if they are from different disease stage. |
Top |
Malignant transformation related pathway analysis |
| Find out the enriched GO biological processes and KEGG pathways involved in transition from healthy to precancer to cancer |
| Tissue | Disease Stage | Enriched GO biological Processes |
| Colorectum | AD |  |
| Colorectum | SER |  |
| Colorectum | MSS |  |
| Colorectum | MSI-H |  |
| Colorectum | FAP |  |
| ∗Top 15 enriched GO BP terms are showed in the bar plot of each disease state in each tissue. Each row represents a significant GO biological process which is colored according to the -log10(p.adjust). |
| Page: 1 2 3 4 5 6 7 8 9 |
| GO ID | Tissue | Disease Stage | Description | Gene Ratio | Bg Ratio | pvalue | p.adjust | Count |
| GO:0006354 | Colorectum | AD | DNA-templated transcription, elongation | 31/3918 | 91/18723 | 2.46e-03 | 1.90e-02 | 31 |
| GO:0006368 | Colorectum | AD | transcription elongation from RNA polymerase II promoter | 24/3918 | 69/18723 | 5.35e-03 | 3.52e-02 | 24 |
| GO:00063541 | Colorectum | MSS | DNA-templated transcription, elongation | 29/3467 | 91/18723 | 1.52e-03 | 1.39e-02 | 29 |
| GO:00063681 | Colorectum | MSS | transcription elongation from RNA polymerase II promoter | 22/3467 | 69/18723 | 5.31e-03 | 3.62e-02 | 22 |
| GO:00063682 | Colorectum | FAP | transcription elongation from RNA polymerase II promoter | 20/2622 | 69/18723 | 9.25e-04 | 9.26e-03 | 20 |
| GO:00063542 | Colorectum | FAP | DNA-templated transcription, elongation | 24/2622 | 91/18723 | 1.32e-03 | 1.22e-02 | 24 |
| GO:0048096 | Colorectum | CRC | chromatin-mediated maintenance of transcription | 5/2078 | 11/18723 | 4.35e-03 | 3.47e-02 | 5 |
| GO:00063543 | Colorectum | CRC | DNA-templated transcription, elongation | 19/2078 | 91/18723 | 4.74e-03 | 3.67e-02 | 19 |
| GO:000635414 | Esophagus | ESCC | DNA-templated transcription, elongation | 76/8552 | 91/18723 | 8.35e-14 | 4.11e-12 | 76 |
| GO:000636814 | Esophagus | ESCC | transcription elongation from RNA polymerase II promoter | 56/8552 | 69/18723 | 1.40e-09 | 3.30e-08 | 56 |
| GO:00400295 | Esophagus | ESCC | regulation of gene expression, epigenetic | 74/8552 | 105/18723 | 2.24e-07 | 3.42e-06 | 74 |
| GO:00480962 | Esophagus | ESCC | chromatin-mediated maintenance of transcription | 11/8552 | 11/18723 | 1.80e-04 | 1.16e-03 | 11 |
| GO:0045815 | Esophagus | ESCC | positive regulation of gene expression, epigenetic | 13/8552 | 17/18723 | 1.00e-02 | 3.42e-02 | 13 |
| GO:000635411 | Liver | HCC | DNA-templated transcription, elongation | 64/7958 | 91/18723 | 7.00e-08 | 1.44e-06 | 64 |
| GO:000636811 | Liver | HCC | transcription elongation from RNA polymerase II promoter | 50/7958 | 69/18723 | 4.32e-07 | 7.22e-06 | 50 |
| GO:0040029 | Liver | HCC | regulation of gene expression, epigenetic | 61/7958 | 105/18723 | 9.02e-04 | 5.31e-03 | 61 |
| Page: 1 |
| Pathway ID | Tissue | Disease Stage | Description | Gene Ratio | Bg Ratio | pvalue | p.adjust | qvalue | Count |
| Page: 1 |
Top |
Cell-cell communication analysis |
| Identification of potential cell-cell interactions between two cell types and their ligand-receptor pairs for different disease states |
| Ligand | Receptor | LRpair | Pathway | Tissue | Disease Stage |
| Page: 1 |
Top |
Single-cell gene regulatory network inference analysis |
| Find out the significant the regulons (TFs) and the target genes of each regulon across cell types for different disease states |
| TF | Cell Type | Tissue | Disease Stage | Target Gene | RSS | Regulon Activity |
| ∗The dot plots of a searched regulon are shown for all cell subpopulations in each disease state of each tissue based on the regulon specific score inferred using pySCENIC and by calculating the average expression. |
| Page: 1 |
Top |
Somatic mutation of malignant transformation related genes |
| Annotation of somatic variants for genes involved in malignant transformation |
| Hugo Symbol | Variant Class | Variant Classification | dbSNP RS | HGVSc | HGVSp | HGVSp Short | SWISSPROT | BIOTYPE | SIFT | PolyPhen | Tumor Sample Barcode | Tissue | Histology | Sex | Age | Stage | Therapy Types | Drugs | Outcome |
| ZMIZ2 | SNV | Missense_Mutation | c.1786N>A | p.Val596Met | p.V596M | Q8NF64 | protein_coding | tolerated(0.08) | possibly_damaging(0.823) | TCGA-A2-A0T4-01 | Breast | breast invasive carcinoma | Female | <65 | I/II | Hormone Therapy | femara | SD | |
| ZMIZ2 | SNV | Missense_Mutation | c.1723N>T | p.Gly575Cys | p.G575C | Q8NF64 | protein_coding | deleterious(0.03) | benign(0.03) | TCGA-E2-A1IN-01 | Breast | breast invasive carcinoma | Female | <65 | I/II | Hormone Therapy | arimidex | SD | |
| ZMIZ2 | insertion | Nonsense_Mutation | novel | c.2738_2739insCCCTGGACCATAATA | p.Leu913_Leu914insProGlyProTerTer | p.L913_L914insPGP** | Q8NF64 | protein_coding | TCGA-A7-A0CJ-01 | Breast | breast invasive carcinoma | Female | <65 | I/II | Chemotherapy | cytoxan | SD | ||
| ZMIZ2 | SNV | Missense_Mutation | rs201947872 | c.2176G>A | p.Gly726Ser | p.G726S | Q8NF64 | protein_coding | tolerated(0.22) | benign(0.021) | TCGA-2W-A8YY-01 | Cervix | cervical & endocervical cancer | Female | <65 | I/II | Chemotherapy | cisplatin | CR |
| ZMIZ2 | SNV | Missense_Mutation | novel | c.242N>T | p.Ser81Phe | p.S81F | Q8NF64 | protein_coding | tolerated(0.63) | benign(0.392) | TCGA-JW-A5VL-01 | Cervix | cervical & endocervical cancer | Female | <65 | I/II | Unknown | Unknown | SD |
| ZMIZ2 | SNV | Missense_Mutation | novel | c.509N>T | p.Ala170Val | p.A170V | Q8NF64 | protein_coding | deleterious(0) | benign(0.379) | TCGA-A6-2686-01 | Colorectum | colon adenocarcinoma | Female | >=65 | I/II | Unknown | Unknown | SD |
| ZMIZ2 | SNV | Missense_Mutation | rs759667830 | c.733C>T | p.Arg245Cys | p.R245C | Q8NF64 | protein_coding | deleterious(0) | probably_damaging(0.999) | TCGA-A6-5665-01 | Colorectum | colon adenocarcinoma | Female | >=65 | I/II | Unknown | Unknown | PD |
| ZMIZ2 | SNV | Missense_Mutation | novel | c.2170G>T | p.Gly724Cys | p.G724C | Q8NF64 | protein_coding | deleterious(0) | probably_damaging(1) | TCGA-A6-5665-01 | Colorectum | colon adenocarcinoma | Female | >=65 | I/II | Unknown | Unknown | PD |
| ZMIZ2 | SNV | Missense_Mutation | c.2486N>T | p.Ala829Val | p.A829V | Q8NF64 | protein_coding | tolerated(0.3) | benign(0.12) | TCGA-AD-5900-01 | Colorectum | colon adenocarcinoma | Male | >=65 | I/II | Unknown | Unknown | SD | |
| ZMIZ2 | SNV | Missense_Mutation | c.2545N>T | p.Gly849Cys | p.G849C | Q8NF64 | protein_coding | deleterious(0.01) | possibly_damaging(0.894) | TCGA-CK-4951-01 | Colorectum | colon adenocarcinoma | Female | >=65 | I/II | Unknown | Unknown | PD |
| Page: 1 2 3 4 5 6 7 |
Top |
Related drugs of malignant transformation related genes |
| Identification of chemicals and drugs interact with genes involved in malignant transfromation |
| (DGIdb 4.0) |
| Entrez ID | Symbol | Category | Interaction Types | Drug Claim Name | Drug Name | PMIDs |
| Page: 1 |

Copyright 2023-Present -The University of Texas Health Science Center at Houston |