
|
|||||
|
 | |
| |
| |
| |
| |
| |
|
Gene: ZMIZ1 |
Gene summary for ZMIZ1 |
| Gene information | Species | Human | Gene symbol | ZMIZ1 | Gene ID | 57178 |
| Gene name | zinc finger MIZ-type containing 1 | |
| Gene Alias | MIZ | |
| Cytomap | 10q22.3 | |
| Gene Type | protein-coding | GO ID | GO:0000003 | UniProtAcc | A0JLS3 |
Top |
Malignant transformation analysis |
| Identification of the aberrant gene expression in precancerous and cancerous lesions by comparing the gene expression of stem-like cells in diseased tissues with normal stem cells |
| Entrez ID | Symbol | Replicates | Species | Organ | Tissue | Adj P-value | Log2FC | Malignancy |
| 57178 | ZMIZ1 | HTA11_696_2000001011 | Human | Colorectum | AD | 1.10e-07 | 5.02e-01 | -0.1464 |
| 57178 | ZMIZ1 | HTA11_866_2000001011 | Human | Colorectum | AD | 3.38e-03 | 3.67e-01 | -0.1001 |
| 57178 | ZMIZ1 | A015-C-203 | Human | Colorectum | FAP | 7.20e-14 | -1.45e-01 | -0.1294 |
| 57178 | ZMIZ1 | A015-C-204 | Human | Colorectum | FAP | 2.10e-02 | -1.66e-01 | -0.0228 |
| 57178 | ZMIZ1 | A002-C-201 | Human | Colorectum | FAP | 4.61e-04 | -2.29e-02 | 0.0324 |
| 57178 | ZMIZ1 | A001-C-119 | Human | Colorectum | FAP | 1.34e-03 | -3.01e-01 | -0.1557 |
| 57178 | ZMIZ1 | A001-C-108 | Human | Colorectum | FAP | 4.68e-07 | -1.02e-01 | -0.0272 |
| 57178 | ZMIZ1 | A002-C-205 | Human | Colorectum | FAP | 4.12e-12 | -2.29e-01 | -0.1236 |
| 57178 | ZMIZ1 | A015-C-006 | Human | Colorectum | FAP | 2.83e-09 | -2.93e-01 | -0.0994 |
| 57178 | ZMIZ1 | A015-C-106 | Human | Colorectum | FAP | 2.19e-03 | 4.10e-03 | -0.0511 |
| 57178 | ZMIZ1 | A002-C-114 | Human | Colorectum | FAP | 9.12e-09 | -6.84e-02 | -0.1561 |
| 57178 | ZMIZ1 | A015-C-104 | Human | Colorectum | FAP | 5.91e-15 | -2.38e-01 | -0.1899 |
| 57178 | ZMIZ1 | A001-C-014 | Human | Colorectum | FAP | 3.18e-04 | -1.30e-01 | 0.0135 |
| 57178 | ZMIZ1 | A002-C-016 | Human | Colorectum | FAP | 2.43e-08 | -4.63e-02 | 0.0521 |
| 57178 | ZMIZ1 | A015-C-002 | Human | Colorectum | FAP | 1.63e-06 | -2.61e-01 | -0.0763 |
| 57178 | ZMIZ1 | A001-C-203 | Human | Colorectum | FAP | 2.09e-02 | -2.64e-02 | -0.0481 |
| 57178 | ZMIZ1 | A002-C-116 | Human | Colorectum | FAP | 1.91e-14 | -1.60e-01 | -0.0452 |
| 57178 | ZMIZ1 | A014-C-008 | Human | Colorectum | FAP | 1.83e-05 | -8.60e-02 | -0.191 |
| 57178 | ZMIZ1 | A018-E-020 | Human | Colorectum | FAP | 1.62e-09 | -1.93e-01 | -0.2034 |
| 57178 | ZMIZ1 | F034 | Human | Colorectum | FAP | 3.69e-07 | 7.15e-03 | -0.0665 |
| Page: 1 2 3 4 5 6 |
| Tissue | Expression Dynamics | Abbreviation |
| Colorectum (GSE201348) |  | FAP: Familial adenomatous polyposis |
| CRC: Colorectal cancer | ||
| Colorectum (HTA11) |  | AD: Adenomas |
| SER: Sessile serrated lesions | ||
| MSI-H: Microsatellite-high colorectal cancer | ||
| MSS: Microsatellite stable colorectal cancer | ||
| Esophagus | 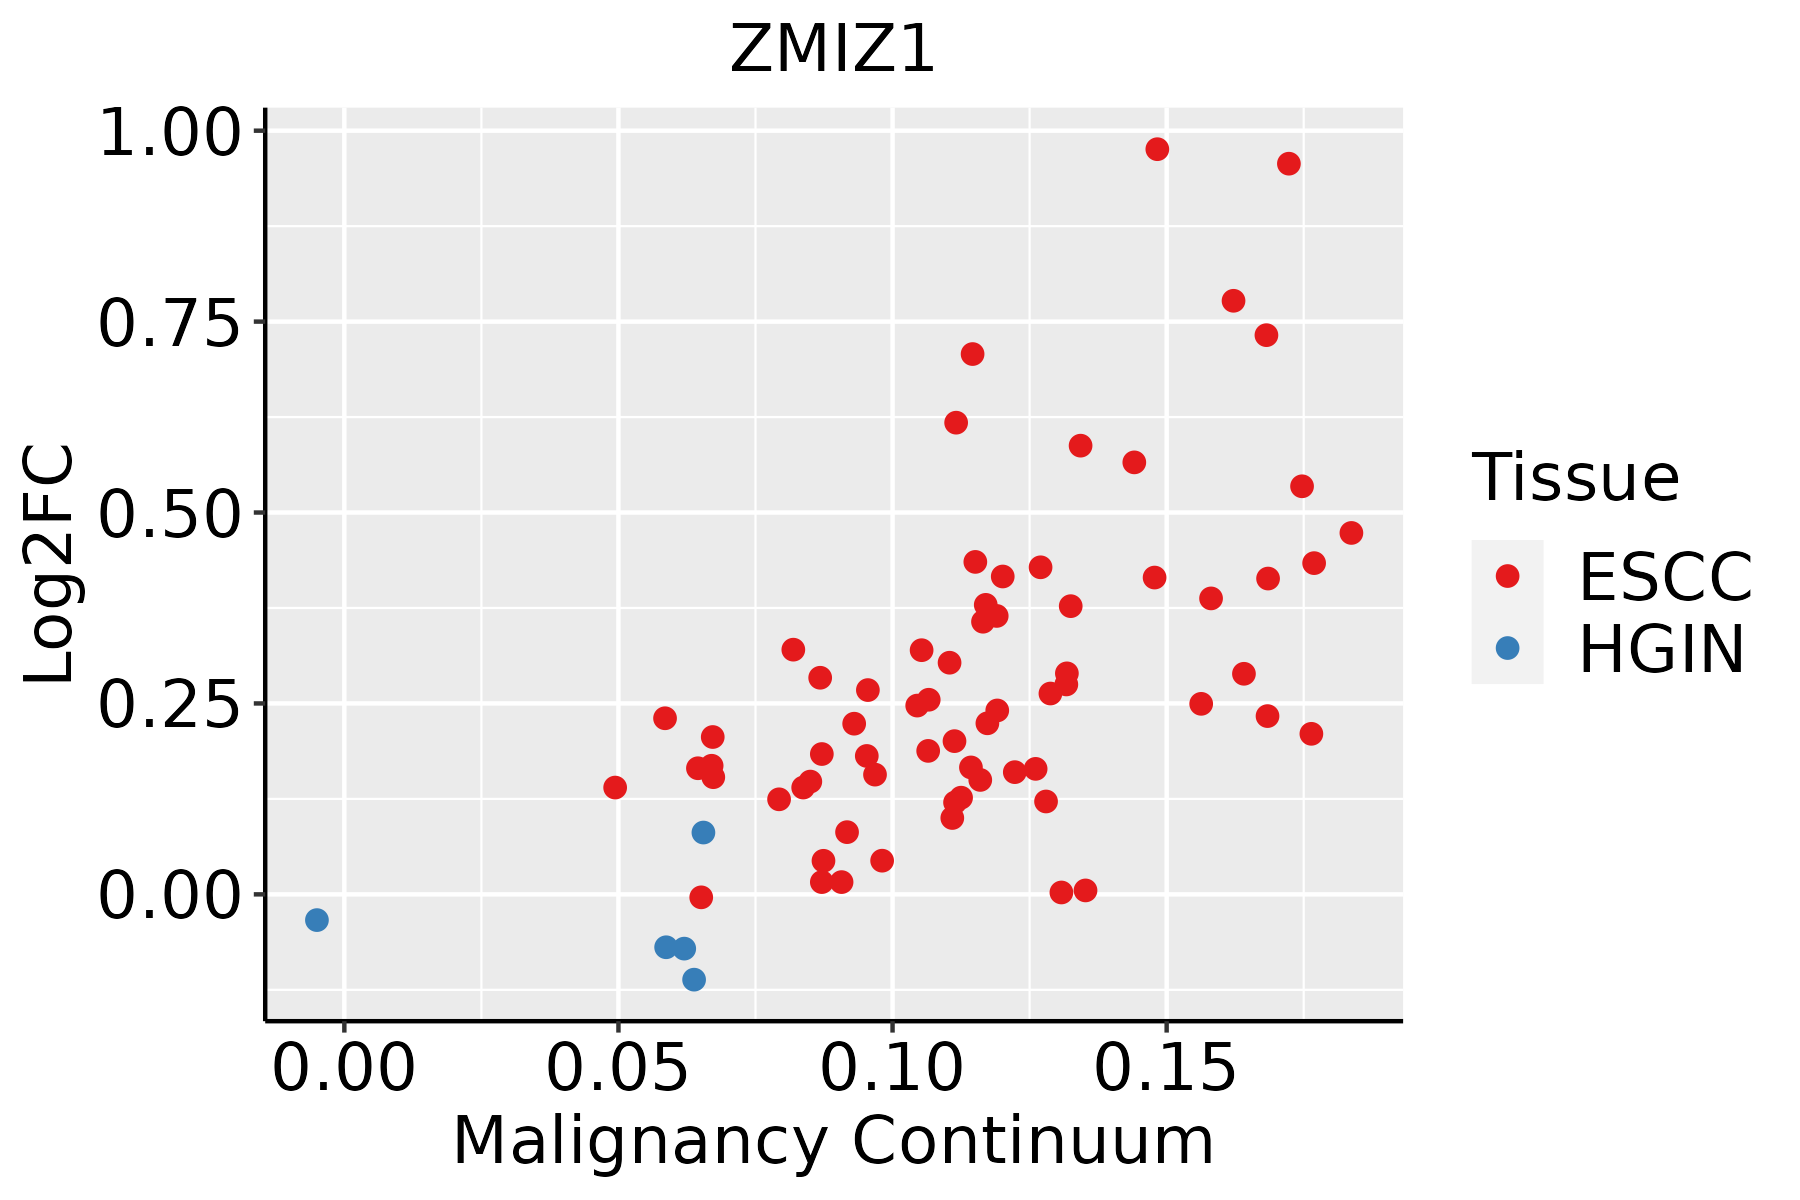 | ESCC: Esophageal squamous cell carcinoma |
| HGIN: High-grade intraepithelial neoplasias | ||
| LGIN: Low-grade intraepithelial neoplasias | ||
| Liver |  | HCC: Hepatocellular carcinoma |
| NAFLD: Non-alcoholic fatty liver disease | ||
| Thyroid | 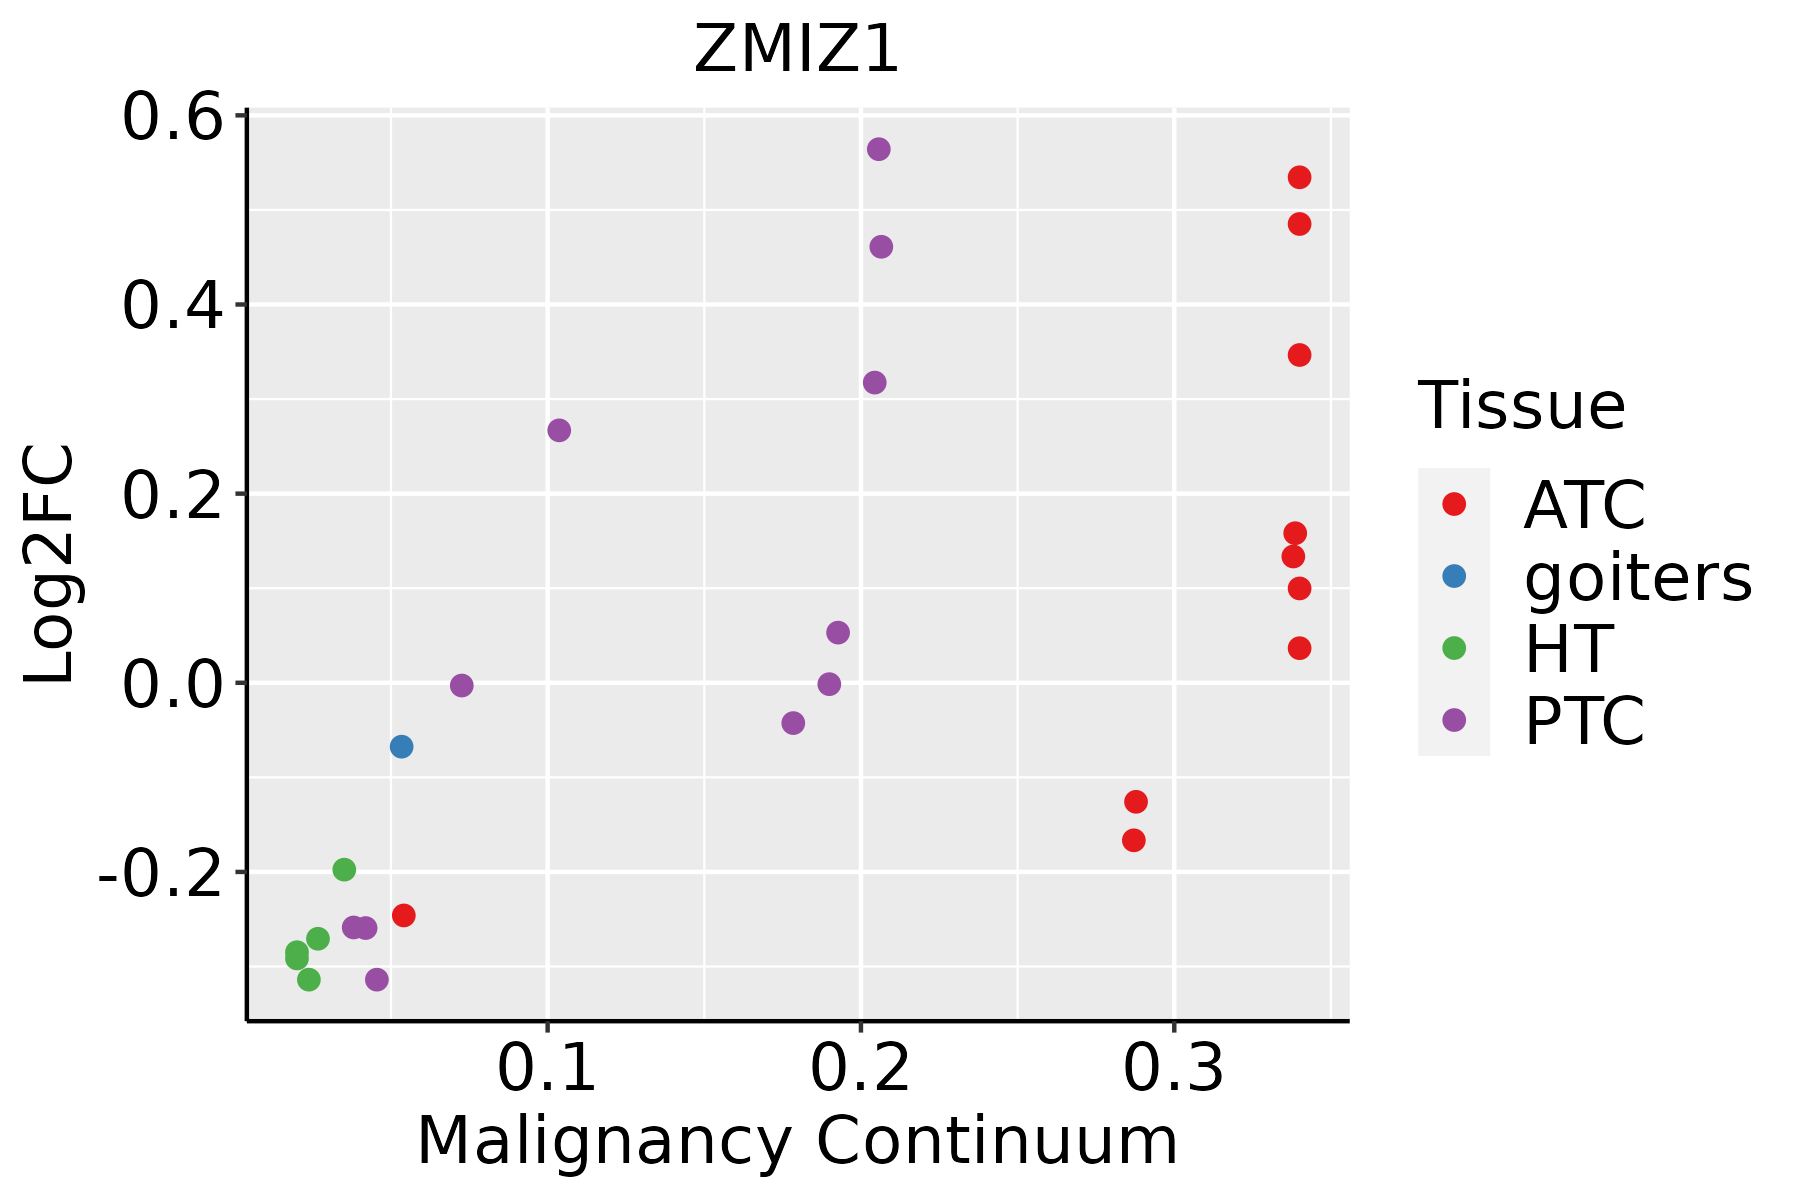 | ATC: Anaplastic thyroid cancer |
| HT: Hashimoto's thyroiditis | ||
| PTC: Papillary thyroid cancer |
| ∗log2FC in expression of this searched gene in stem-like cells from each diseased tissue sample relative to stem-like cells in normal samples in each tissue plotted against the malignancy continuum. Samples are colored based on if they are from different disease stage. |
Top |
Malignant transformation related pathway analysis |
| Find out the enriched GO biological processes and KEGG pathways involved in transition from healthy to precancer to cancer |
| Tissue | Disease Stage | Enriched GO biological Processes |
| Colorectum | AD |  |
| Colorectum | SER |  |
| Colorectum | MSS |  |
| Colorectum | MSI-H |  |
| Colorectum | FAP |  |
| ∗Top 15 enriched GO BP terms are showed in the bar plot of each disease state in each tissue. Each row represents a significant GO biological process which is colored according to the -log10(p.adjust). |
| Page: 1 2 3 4 5 6 7 8 9 |
| GO ID | Tissue | Disease Stage | Description | Gene Ratio | Bg Ratio | pvalue | p.adjust | Count |
| GO:1903320 | Colorectum | AD | regulation of protein modification by small protein conjugation or removal | 86/3918 | 242/18723 | 9.43e-08 | 4.65e-06 | 86 |
| GO:0071383 | Colorectum | AD | cellular response to steroid hormone stimulus | 73/3918 | 204/18723 | 6.31e-07 | 2.24e-05 | 73 |
| GO:0030522 | Colorectum | AD | intracellular receptor signaling pathway | 87/3918 | 265/18723 | 3.69e-06 | 1.03e-04 | 87 |
| GO:0043401 | Colorectum | AD | steroid hormone mediated signaling pathway | 51/3918 | 136/18723 | 6.52e-06 | 1.63e-04 | 51 |
| GO:0048545 | Colorectum | AD | response to steroid hormone | 104/3918 | 339/18723 | 1.33e-05 | 2.90e-04 | 104 |
| GO:0001701 | Colorectum | AD | in utero embryonic development | 110/3918 | 367/18723 | 2.36e-05 | 4.62e-04 | 110 |
| GO:0009755 | Colorectum | AD | hormone-mediated signaling pathway | 64/3918 | 190/18723 | 2.78e-05 | 5.24e-04 | 64 |
| GO:0030518 | Colorectum | AD | intracellular steroid hormone receptor signaling pathway | 43/3918 | 116/18723 | 4.61e-05 | 7.97e-04 | 43 |
| GO:0030521 | Colorectum | AD | androgen receptor signaling pathway | 20/3918 | 44/18723 | 2.26e-04 | 2.94e-03 | 20 |
| GO:0021859 | Colorectum | AD | pyramidal neuron differentiation | 9/3918 | 13/18723 | 2.38e-04 | 3.03e-03 | 9 |
| GO:0045785 | Colorectum | AD | positive regulation of cell adhesion | 122/3918 | 437/18723 | 2.65e-04 | 3.28e-03 | 122 |
| GO:0007568 | Colorectum | AD | aging | 98/3918 | 339/18723 | 2.77e-04 | 3.39e-03 | 98 |
| GO:0021860 | Colorectum | AD | pyramidal neuron development | 8/3918 | 11/18723 | 3.26e-04 | 3.85e-03 | 8 |
| GO:0007178 | Colorectum | AD | transmembrane receptor protein serine/threonine kinase signaling pathway | 99/3918 | 355/18723 | 9.92e-04 | 9.28e-03 | 99 |
| GO:0071559 | Colorectum | AD | response to transforming growth factor beta | 74/3918 | 256/18723 | 1.45e-03 | 1.23e-02 | 74 |
| GO:0071560 | Colorectum | AD | cellular response to transforming growth factor beta stimulus | 72/3918 | 250/18723 | 1.85e-03 | 1.52e-02 | 72 |
| GO:0007179 | Colorectum | AD | transforming growth factor beta receptor signaling pathway | 59/3918 | 198/18723 | 1.94e-03 | 1.58e-02 | 59 |
| GO:0006354 | Colorectum | AD | DNA-templated transcription, elongation | 31/3918 | 91/18723 | 2.46e-03 | 1.90e-02 | 31 |
| GO:1903706 | Colorectum | AD | regulation of hemopoiesis | 99/3918 | 367/18723 | 3.08e-03 | 2.28e-02 | 99 |
| GO:0060395 | Colorectum | AD | SMAD protein signal transduction | 28/3918 | 82/18723 | 3.73e-03 | 2.63e-02 | 28 |
| Page: 1 2 3 4 5 6 7 8 9 10 11 12 13 14 |
| Pathway ID | Tissue | Disease Stage | Description | Gene Ratio | Bg Ratio | pvalue | p.adjust | qvalue | Count |
| Page: 1 |
Top |
Cell-cell communication analysis |
| Identification of potential cell-cell interactions between two cell types and their ligand-receptor pairs for different disease states |
| Ligand | Receptor | LRpair | Pathway | Tissue | Disease Stage |
| Page: 1 |
Top |
Single-cell gene regulatory network inference analysis |
| Find out the significant the regulons (TFs) and the target genes of each regulon across cell types for different disease states |
| TF | Cell Type | Tissue | Disease Stage | Target Gene | RSS | Regulon Activity |
| ZMIZ1 | SMC | Cervix | Healthy | NAV2,HPCAL1,KCNMA1, etc. | 8.31e-01 |  |
| ZMIZ1 | STM | Thyroid | Healthy | NFAT5,NCOA3,HECA, etc. | 5.40e-01 |  |
| ZMIZ1 | STM | Thyroid | HT | KCNB1,RARRES1,AL359220.1, etc. | 6.94e-01 |  |
| ∗The dot plots of a searched regulon are shown for all cell subpopulations in each disease state of each tissue based on the regulon specific score inferred using pySCENIC and by calculating the average expression. |
| Page: 1 |
Top |
Somatic mutation of malignant transformation related genes |
| Annotation of somatic variants for genes involved in malignant transformation |
| Hugo Symbol | Variant Class | Variant Classification | dbSNP RS | HGVSc | HGVSp | HGVSp Short | SWISSPROT | BIOTYPE | SIFT | PolyPhen | Tumor Sample Barcode | Tissue | Histology | Sex | Age | Stage | Therapy Types | Drugs | Outcome |
| ZMIZ1 | SNV | Missense_Mutation | novel | c.1350N>A | p.Met450Ile | p.M450I | Q9ULJ6 | protein_coding | tolerated(0.06) | benign(0.003) | TCGA-A7-A6VY-01 | Breast | breast invasive carcinoma | Female | <65 | I/II | Chemotherapy | cyclophosphamide | CR |
| ZMIZ1 | SNV | Missense_Mutation | c.901N>A | p.Ala301Thr | p.A301T | Q9ULJ6 | protein_coding | tolerated_low_confidence(0.05) | possibly_damaging(0.824) | TCGA-AC-A4ZE-01 | Breast | breast invasive carcinoma | Female | <65 | I/II | Unknown | Unknown | SD | |
| ZMIZ1 | SNV | Missense_Mutation | novel | c.1882G>A | p.Val628Met | p.V628M | Q9ULJ6 | protein_coding | deleterious(0) | probably_damaging(0.999) | TCGA-AN-A0AK-01 | Breast | breast invasive carcinoma | Female | >=65 | I/II | Unknown | Unknown | SD |
| ZMIZ1 | SNV | Missense_Mutation | rs751935868 | c.1606G>A | p.Val536Ile | p.V536I | Q9ULJ6 | protein_coding | tolerated(0.11) | benign(0.27) | TCGA-AN-A0XU-01 | Breast | breast invasive carcinoma | Female | <65 | I/II | Unknown | Unknown | SD |
| ZMIZ1 | SNV | Missense_Mutation | novel | c.558G>T | p.Met186Ile | p.M186I | Q9ULJ6 | protein_coding | deleterious_low_confidence(0.03) | possibly_damaging(0.876) | TCGA-BH-A5IZ-01 | Breast | breast invasive carcinoma | Female | <65 | I/II | Chemotherapy | adriamycin | CR |
| ZMIZ1 | SNV | Missense_Mutation | c.2732N>G | p.Met911Arg | p.M911R | Q9ULJ6 | protein_coding | deleterious_low_confidence(0.03) | benign(0.391) | TCGA-C8-A134-01 | Breast | breast invasive carcinoma | Female | <65 | I/II | Chemotherapy | 5-fluorouracil | CR | |
| ZMIZ1 | SNV | Missense_Mutation | c.2191N>T | p.Val731Leu | p.V731L | Q9ULJ6 | protein_coding | deleterious(0.05) | benign(0.065) | TCGA-EW-A1J2-01 | Breast | breast invasive carcinoma | Female | <65 | I/II | Chemotherapy | taxotere | SD | |
| ZMIZ1 | SNV | Missense_Mutation | novel | c.1795N>G | p.Thr599Ala | p.T599A | Q9ULJ6 | protein_coding | deleterious(0.01) | probably_damaging(0.995) | TCGA-EW-A6SB-01 | Breast | breast invasive carcinoma | Female | <65 | I/II | Unknown | Unknown | SD |
| ZMIZ1 | insertion | Frame_Shift_Ins | novel | c.2737_2738insGGCTCACACCTGTAATCCCAGC | p.Asp913GlyfsTer48 | p.D913Gfs*48 | Q9ULJ6 | protein_coding | TCGA-AN-A0FX-01 | Breast | breast invasive carcinoma | Female | <65 | I/II | Unknown | Unknown | SD | ||
| ZMIZ1 | deletion | Frame_Shift_Del | c.608delG | p.Gly203AlafsTer2 | p.G203Afs*2 | Q9ULJ6 | protein_coding | TCGA-D8-A27V-01 | Breast | breast invasive carcinoma | Female | <65 | I/II | Hormone Therapy | tamoxiphen | SD |
| Page: 1 2 3 4 5 6 7 8 9 10 11 12 |
Top |
Related drugs of malignant transformation related genes |
| Identification of chemicals and drugs interact with genes involved in malignant transfromation |
| (DGIdb 4.0) |
| Entrez ID | Symbol | Category | Interaction Types | Drug Claim Name | Drug Name | PMIDs |
| Page: 1 |

Copyright 2023-Present -The University of Texas Health Science Center at Houston |