
|
|||||
|
 | |
| |
| |
| |
| |
| |
|
Gene: ZMAT1 |
Gene summary for ZMAT1 |
| Gene information | Species | Human | Gene symbol | ZMAT1 | Gene ID | 84460 |
| Gene name | zinc finger matrin-type 1 | |
| Gene Alias | ZMAT1 | |
| Cytomap | Xq22.1 | |
| Gene Type | protein-coding | GO ID | GO:0005575 | UniProtAcc | A7MD47 |
Top |
Malignant transformation analysis |
| Identification of the aberrant gene expression in precancerous and cancerous lesions by comparing the gene expression of stem-like cells in diseased tissues with normal stem cells |
| Entrez ID | Symbol | Replicates | Species | Organ | Tissue | Adj P-value | Log2FC | Malignancy |
| 84460 | ZMAT1 | NAFLD1 | Human | Liver | NAFLD | 3.20e-04 | 6.13e-01 | -0.04 |
| 84460 | ZMAT1 | S43 | Human | Liver | Cirrhotic | 4.78e-05 | -1.19e-01 | -0.0187 |
| 84460 | ZMAT1 | HCC1_Meng | Human | Liver | HCC | 1.78e-19 | -5.05e-02 | 0.0246 |
| 84460 | ZMAT1 | HCC2_Meng | Human | Liver | HCC | 7.65e-18 | 1.86e-01 | 0.0107 |
| 84460 | ZMAT1 | HCC1 | Human | Liver | HCC | 9.23e-04 | 3.23e+00 | 0.5336 |
| 84460 | ZMAT1 | HCC2 | Human | Liver | HCC | 1.23e-06 | 3.24e+00 | 0.5341 |
| 84460 | ZMAT1 | Pt13.a | Human | Liver | HCC | 3.29e-03 | -1.01e-01 | 0.021 |
| 84460 | ZMAT1 | S028 | Human | Liver | HCC | 5.32e-10 | 4.31e-01 | 0.2503 |
| 84460 | ZMAT1 | S029 | Human | Liver | HCC | 1.14e-05 | 3.32e-01 | 0.2581 |
| 84460 | ZMAT1 | HTA12-23-1 | Human | Pancreas | PDAC | 6.14e-06 | 5.74e-01 | 0.3405 |
| 84460 | ZMAT1 | HTA12-25-1 | Human | Pancreas | PDAC | 2.98e-02 | 3.12e-01 | 0.313 |
| 84460 | ZMAT1 | HTA12-26-1 | Human | Pancreas | PDAC | 2.46e-12 | 6.28e-01 | 0.3728 |
| 84460 | ZMAT1 | HTA12-29-1 | Human | Pancreas | PDAC | 6.63e-21 | 4.88e-01 | 0.3722 |
| 84460 | ZMAT1 | male-WTA | Human | Thyroid | PTC | 2.20e-22 | 9.22e-02 | 0.1037 |
| 84460 | ZMAT1 | PTC01 | Human | Thyroid | PTC | 4.82e-20 | 1.99e-01 | 0.1899 |
| 84460 | ZMAT1 | PTC03 | Human | Thyroid | PTC | 7.16e-12 | 3.01e-01 | 0.1784 |
| 84460 | ZMAT1 | PTC04 | Human | Thyroid | PTC | 1.29e-27 | 6.32e-01 | 0.1927 |
| 84460 | ZMAT1 | PTC05 | Human | Thyroid | PTC | 2.21e-17 | 8.60e-01 | 0.2065 |
| 84460 | ZMAT1 | PTC06 | Human | Thyroid | PTC | 4.57e-51 | 1.25e+00 | 0.2057 |
| 84460 | ZMAT1 | PTC07 | Human | Thyroid | PTC | 6.69e-47 | 7.86e-01 | 0.2044 |
| Page: 1 2 |
| Tissue | Expression Dynamics | Abbreviation |
| Liver | 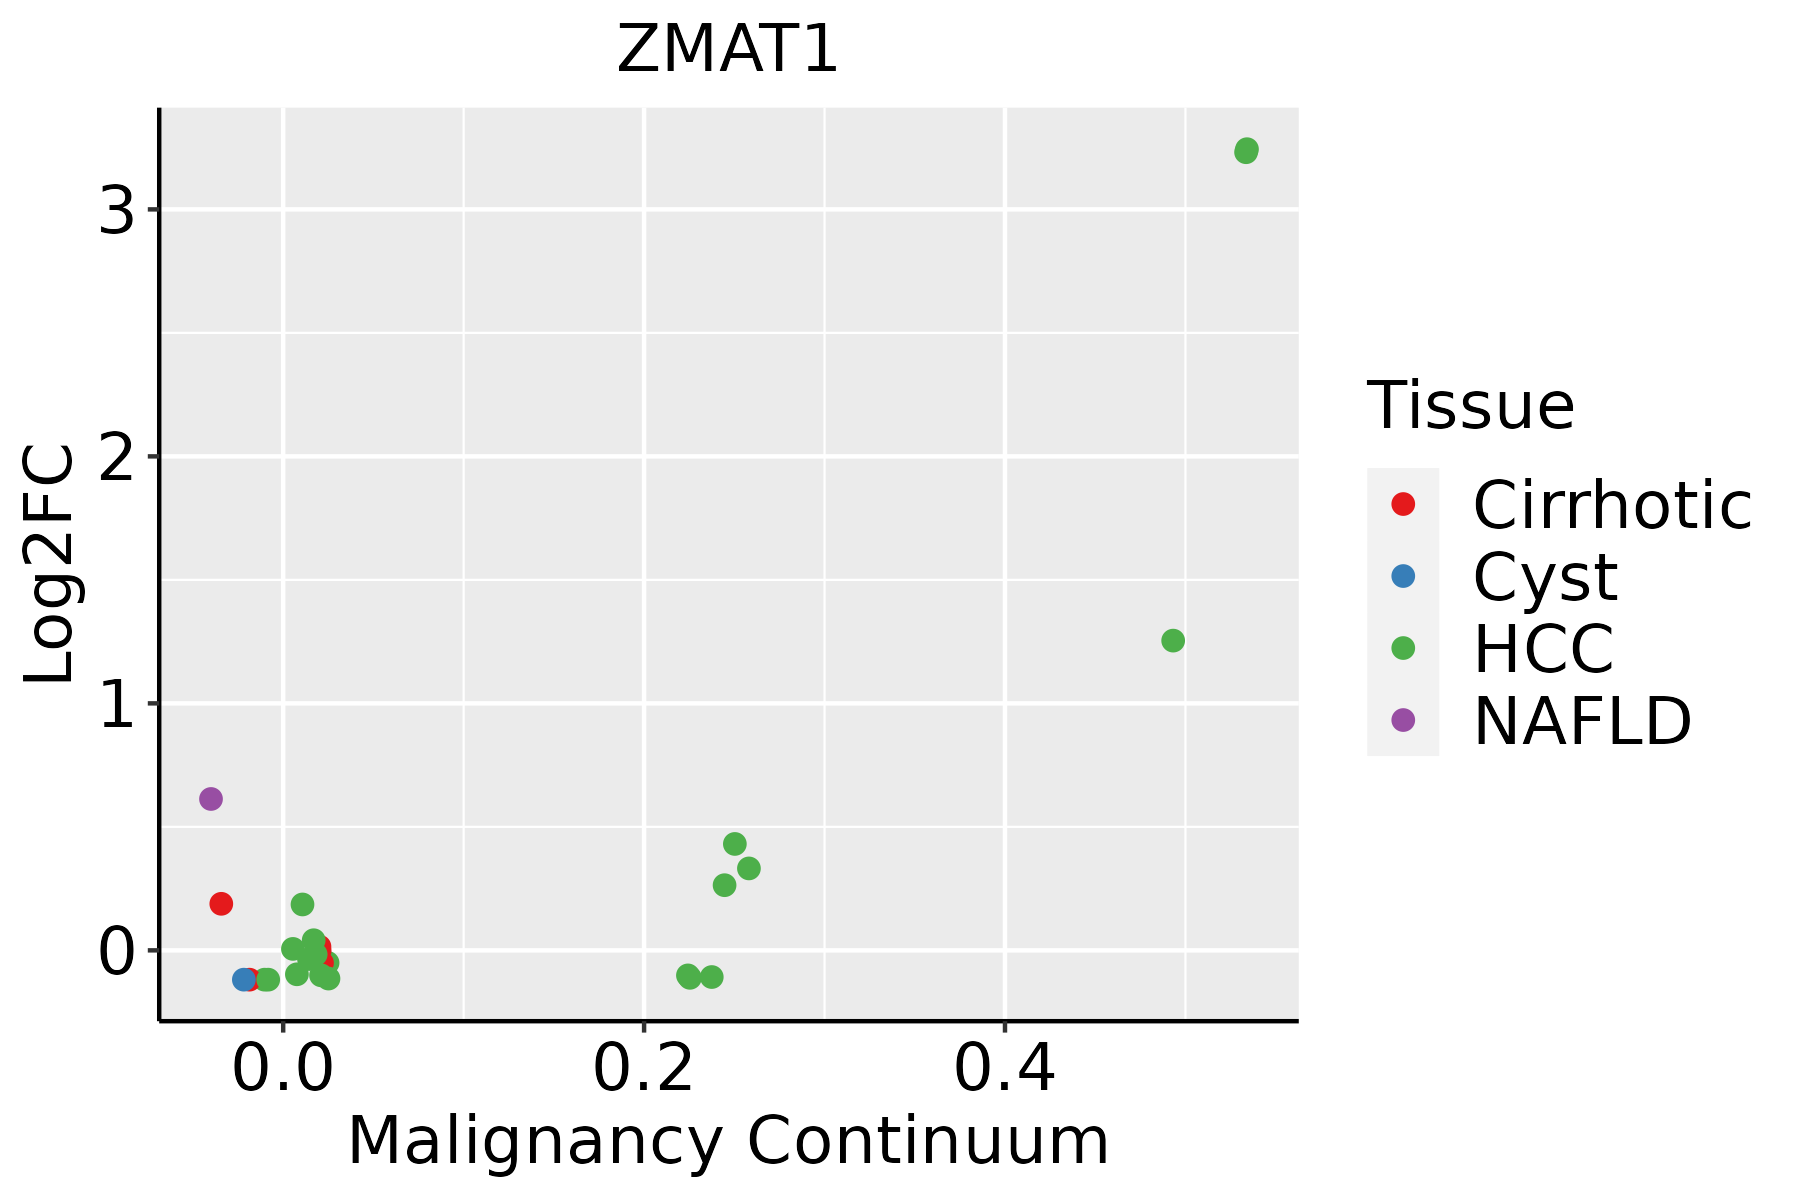 | HCC: Hepatocellular carcinoma |
| NAFLD: Non-alcoholic fatty liver disease | ||
| Thyroid | 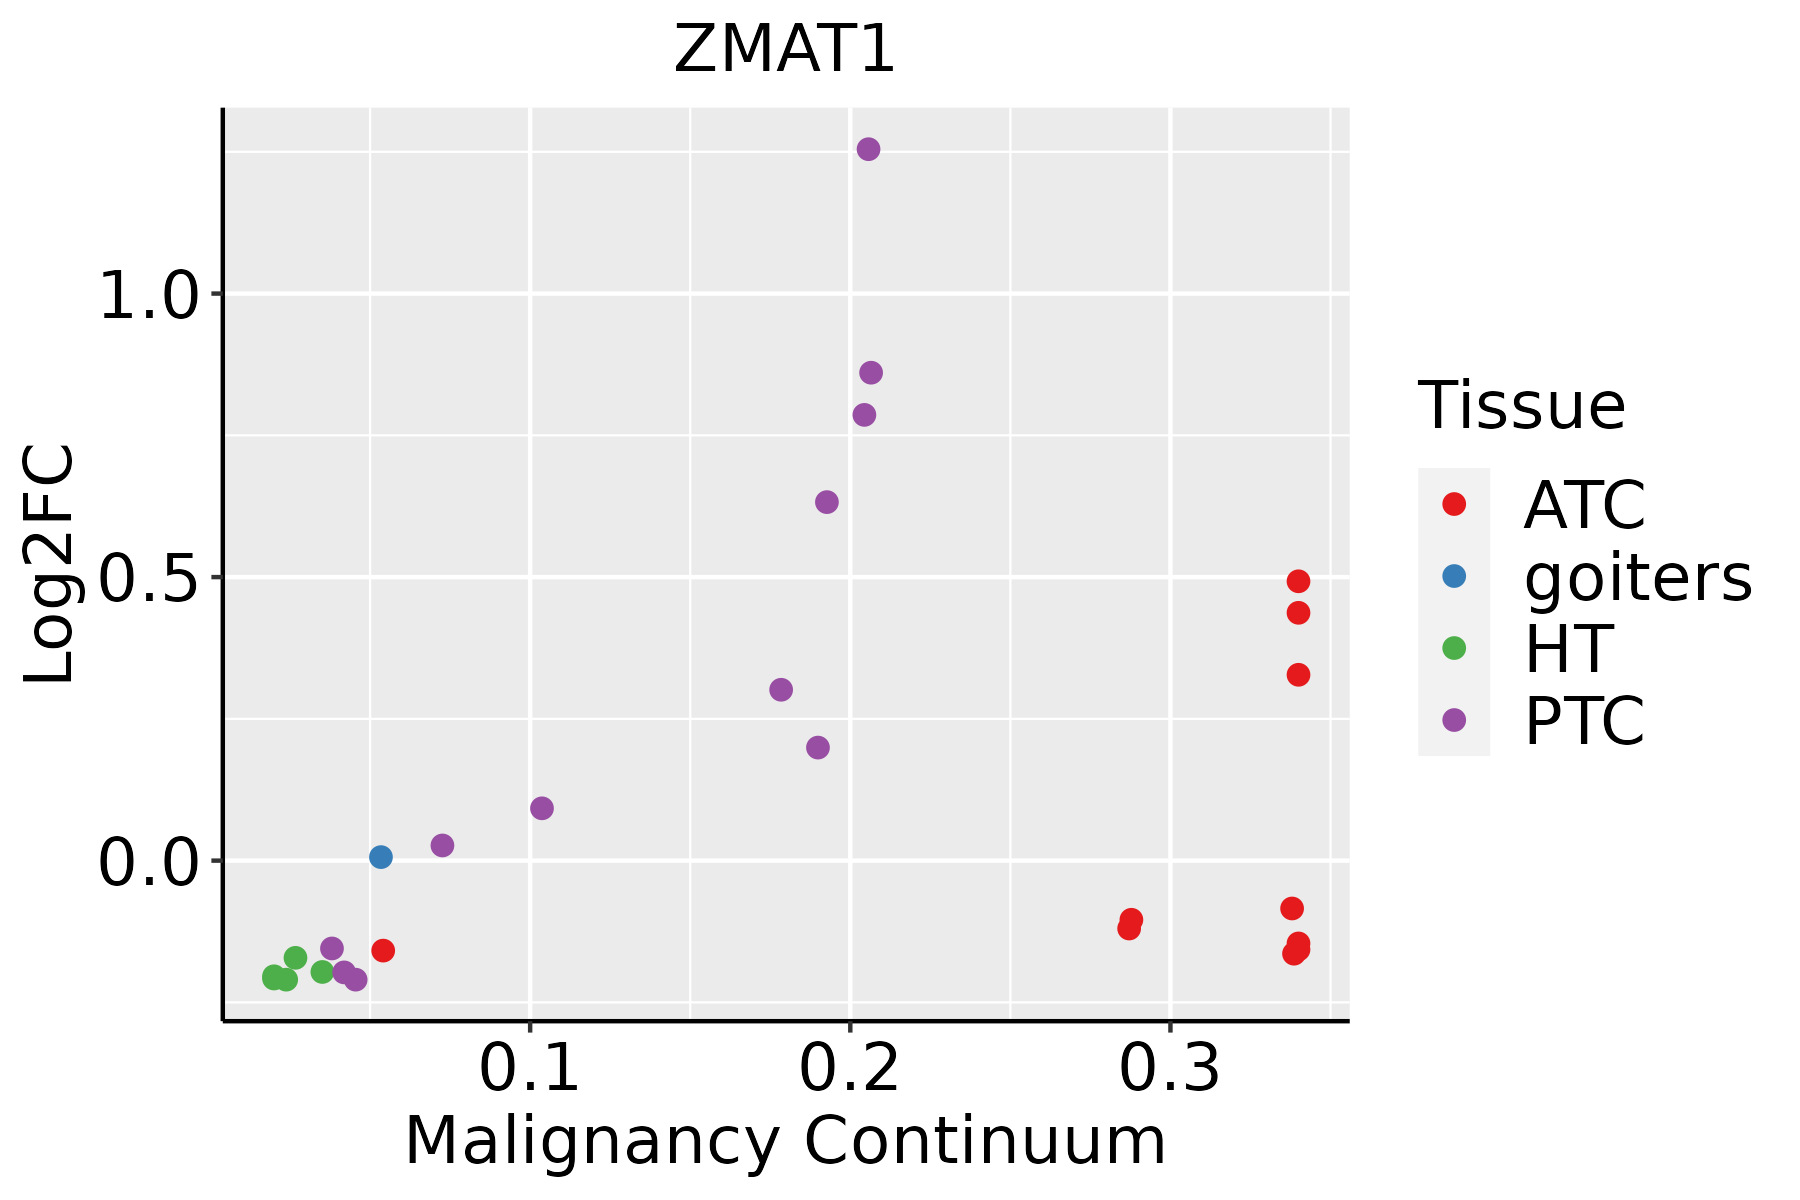 | ATC: Anaplastic thyroid cancer |
| HT: Hashimoto's thyroiditis | ||
| PTC: Papillary thyroid cancer |
| ∗log2FC in expression of this searched gene in stem-like cells from each diseased tissue sample relative to stem-like cells in normal samples in each tissue plotted against the malignancy continuum. Samples are colored based on if they are from different disease stage. |
Top |
Malignant transformation related pathway analysis |
| Find out the enriched GO biological processes and KEGG pathways involved in transition from healthy to precancer to cancer |
| Tissue | Disease Stage | Enriched GO biological Processes |
| Colorectum | AD |  |
| Colorectum | SER |  |
| Colorectum | MSS |  |
| Colorectum | MSI-H |  |
| Colorectum | FAP |  |
| ∗Top 15 enriched GO BP terms are showed in the bar plot of each disease state in each tissue. Each row represents a significant GO biological process which is colored according to the -log10(p.adjust). |
| Page: 1 2 3 4 5 6 7 8 9 |
| GO ID | Tissue | Disease Stage | Description | Gene Ratio | Bg Ratio | pvalue | p.adjust | Count |
| Page: 1 |
| Pathway ID | Tissue | Disease Stage | Description | Gene Ratio | Bg Ratio | pvalue | p.adjust | qvalue | Count |
| Page: 1 |
Top |
Cell-cell communication analysis |
| Identification of potential cell-cell interactions between two cell types and their ligand-receptor pairs for different disease states |
| Ligand | Receptor | LRpair | Pathway | Tissue | Disease Stage |
| Page: 1 |
Top |
Single-cell gene regulatory network inference analysis |
| Find out the significant the regulons (TFs) and the target genes of each regulon across cell types for different disease states |
| TF | Cell Type | Tissue | Disease Stage | Target Gene | RSS | Regulon Activity |
| ∗The dot plots of a searched regulon are shown for all cell subpopulations in each disease state of each tissue based on the regulon specific score inferred using pySCENIC and by calculating the average expression. |
| Page: 1 |
Top |
Somatic mutation of malignant transformation related genes |
| Annotation of somatic variants for genes involved in malignant transformation |
| Hugo Symbol | Variant Class | Variant Classification | dbSNP RS | HGVSc | HGVSp | HGVSp Short | SWISSPROT | BIOTYPE | SIFT | PolyPhen | Tumor Sample Barcode | Tissue | Histology | Sex | Age | Stage | Therapy Types | Drugs | Outcome |
| ZMAT1 | SNV | Missense_Mutation | c.476N>A | p.Ala159Glu | p.A159E | Q5H9K5 | protein_coding | deleterious(0.03) | benign(0.003) | TCGA-A8-A06Z-01 | Breast | breast invasive carcinoma | Female | >=65 | I/II | Unknown | Unknown | SD | |
| ZMAT1 | SNV | Missense_Mutation | c.717G>T | p.Lys239Asn | p.K239N | Q5H9K5 | protein_coding | tolerated(0.12) | benign(0.018) | TCGA-AN-A046-01 | Breast | breast invasive carcinoma | Female | >=65 | I/II | Unknown | Unknown | SD | |
| ZMAT1 | SNV | Missense_Mutation | c.916N>C | p.Asp306His | p.D306H | Q5H9K5 | protein_coding | deleterious(0) | probably_damaging(0.988) | TCGA-AO-A0JE-01 | Breast | breast invasive carcinoma | Female | <65 | III/IV | Chemotherapy | doxorubicin | SD | |
| ZMAT1 | SNV | Missense_Mutation | novel | c.1234N>G | p.Thr412Ala | p.T412A | Q5H9K5 | protein_coding | deleterious(0.01) | possibly_damaging(0.805) | TCGA-AR-A0U0-01 | Breast | breast invasive carcinoma | Female | >=65 | I/II | Unknown | Unknown | SD |
| ZMAT1 | SNV | Missense_Mutation | novel | c.1339G>C | p.Glu447Gln | p.E447Q | Q5H9K5 | protein_coding | tolerated(0.05) | probably_damaging(0.94) | TCGA-E2-A2P5-01 | Breast | breast invasive carcinoma | Female | >=65 | III/IV | Hormone Therapy | arimidex | PD |
| ZMAT1 | SNV | Missense_Mutation | novel | c.1387G>A | p.Glu463Lys | p.E463K | Q5H9K5 | protein_coding | tolerated(0.12) | benign(0.06) | TCGA-XX-A89A-01 | Breast | breast invasive carcinoma | Female | >=65 | I/II | Unknown | Unknown | SD |
| ZMAT1 | insertion | Frame_Shift_Ins | novel | c.1235_1236insAGTA | p.Cys413ValfsTer9 | p.C413Vfs*9 | Q5H9K5 | protein_coding | TCGA-AR-A0U0-01 | Breast | breast invasive carcinoma | Female | >=65 | I/II | Unknown | Unknown | SD | ||
| ZMAT1 | SNV | Missense_Mutation | rs367645895 | c.154N>T | p.Leu52Phe | p.L52F | Q5H9K5 | protein_coding | tolerated(0.13) | benign(0.02) | TCGA-C5-A1ME-01 | Cervix | cervical & endocervical cancer | Female | <65 | I/II | Unknown | Unknown | SD |
| ZMAT1 | SNV | Missense_Mutation | novel | c.762N>T | p.Arg254Ser | p.R254S | Q5H9K5 | protein_coding | tolerated(0.13) | benign(0.015) | TCGA-DS-A7WH-01 | Cervix | cervical & endocervical cancer | Female | <65 | I/II | Chemotherapy | cisplatin | CR |
| ZMAT1 | SNV | Missense_Mutation | novel | c.1658N>G | p.Glu553Gly | p.E553G | Q5H9K5 | protein_coding | deleterious(0.02) | possibly_damaging(0.525) | TCGA-EA-A3HU-01 | Cervix | cervical & endocervical cancer | Female | <65 | I/II | Unknown | Unknown | SD |
| Page: 1 2 3 4 5 6 7 8 9 10 11 12 13 |
Top |
Related drugs of malignant transformation related genes |
| Identification of chemicals and drugs interact with genes involved in malignant transfromation |
| (DGIdb 4.0) |
| Entrez ID | Symbol | Category | Interaction Types | Drug Claim Name | Drug Name | PMIDs |
| Page: 1 |

Copyright 2023-Present -The University of Texas Health Science Center at Houston |