
|
|||||
|
 | |
| |
| |
| |
| |
| |
|
Gene: ZKSCAN8 |
Gene summary for ZKSCAN8 |
| Gene information | Species | Human | Gene symbol | ZKSCAN8 | Gene ID | 7745 |
| Gene name | zinc finger with KRAB and SCAN domains 8 | |
| Gene Alias | LD5-1 | |
| Cytomap | 6p22.1 | |
| Gene Type | protein-coding | GO ID | GO:0006139 | UniProtAcc | A0A024RCK7 |
Top |
Malignant transformation analysis |
| Identification of the aberrant gene expression in precancerous and cancerous lesions by comparing the gene expression of stem-like cells in diseased tissues with normal stem cells |
| Entrez ID | Symbol | Replicates | Species | Organ | Tissue | Adj P-value | Log2FC | Malignancy |
| 7745 | ZKSCAN8 | HCC1_Meng | Human | Liver | HCC | 8.55e-27 | 1.70e-02 | 0.0246 |
| 7745 | ZKSCAN8 | HCC1 | Human | Liver | HCC | 1.45e-04 | 2.25e+00 | 0.5336 |
| 7745 | ZKSCAN8 | HCC2 | Human | Liver | HCC | 3.00e-03 | 1.28e+00 | 0.5341 |
| 7745 | ZKSCAN8 | S014 | Human | Liver | HCC | 1.57e-02 | 1.99e-01 | 0.2254 |
| 7745 | ZKSCAN8 | S016 | Human | Liver | HCC | 4.93e-03 | 1.92e-01 | 0.2243 |
| 7745 | ZKSCAN8 | S028 | Human | Liver | HCC | 2.66e-05 | 2.77e-01 | 0.2503 |
| 7745 | ZKSCAN8 | S029 | Human | Liver | HCC | 1.37e-05 | 3.03e-01 | 0.2581 |
| Page: 1 |
| Tissue | Expression Dynamics | Abbreviation |
| Liver | 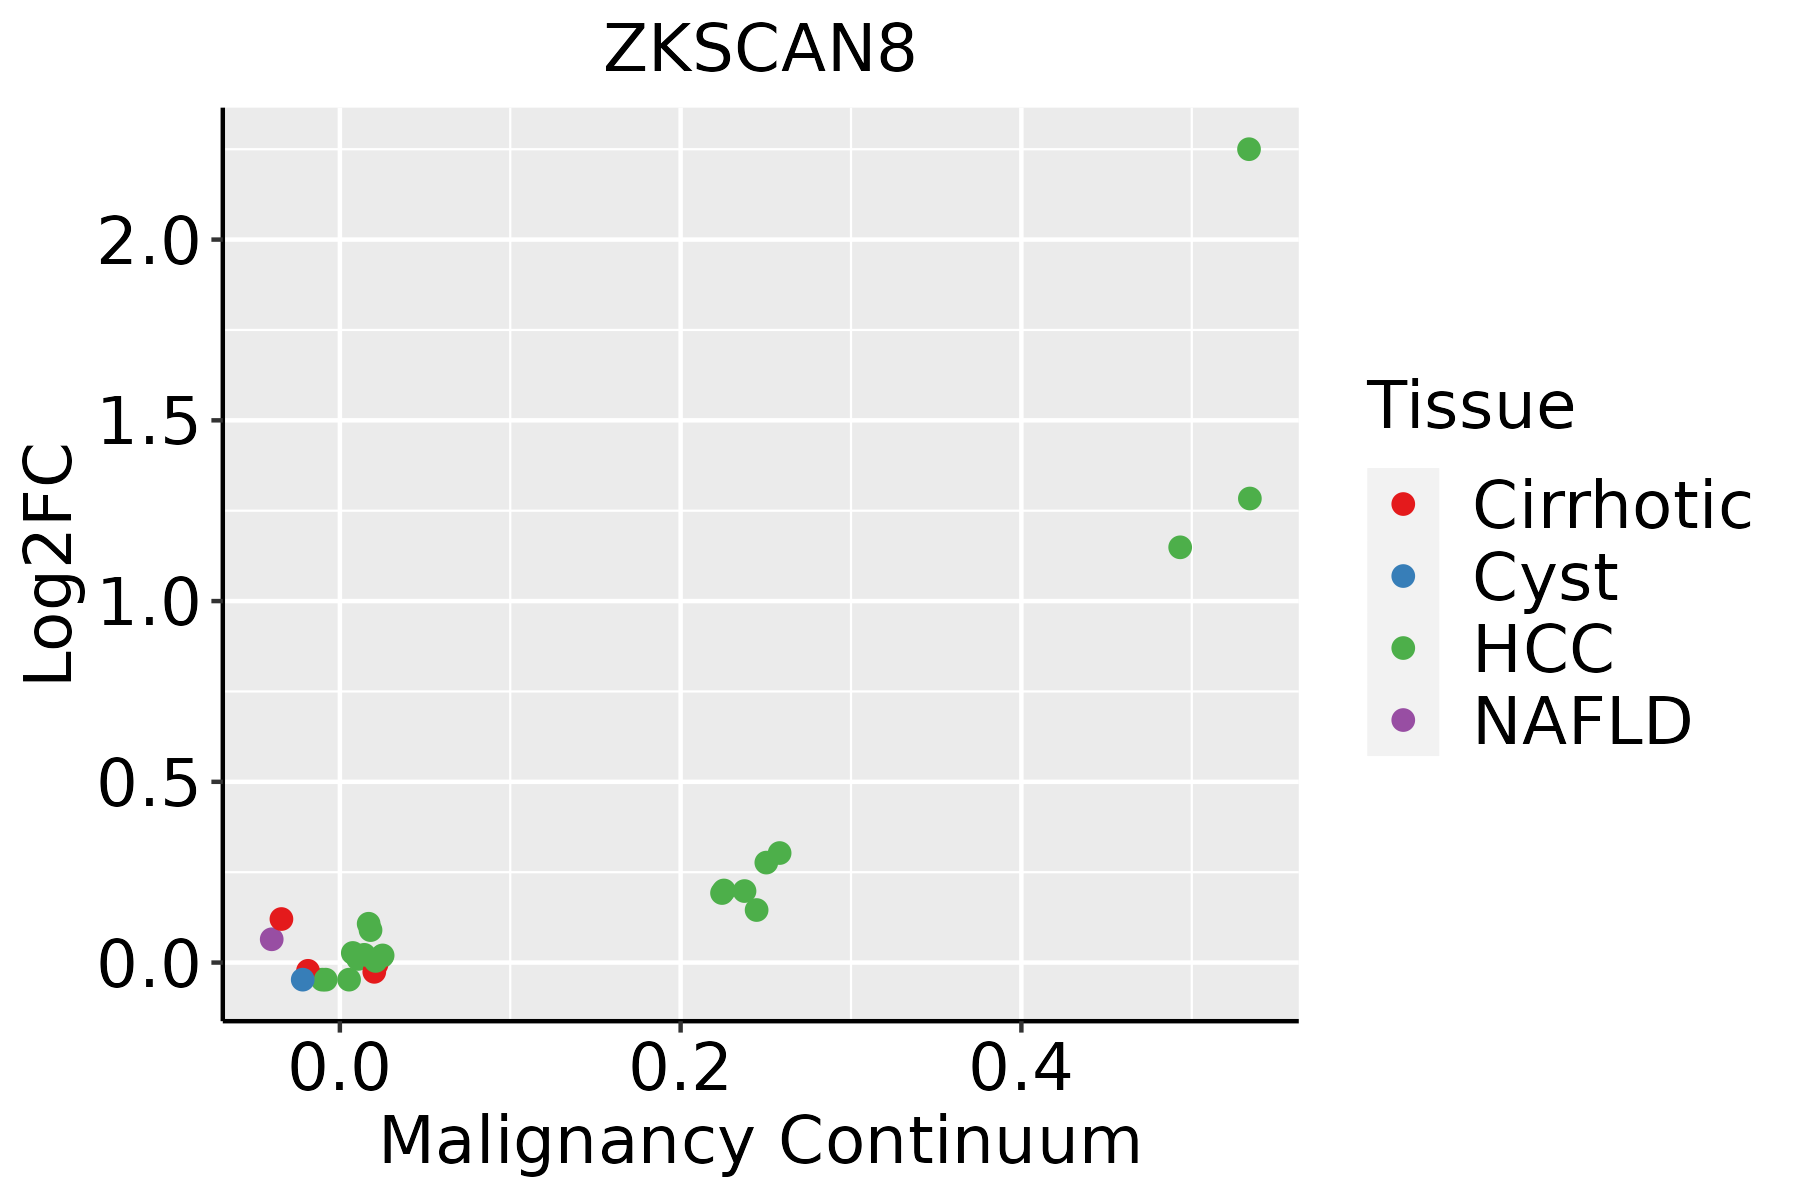 | HCC: Hepatocellular carcinoma |
| NAFLD: Non-alcoholic fatty liver disease |
| ∗log2FC in expression of this searched gene in stem-like cells from each diseased tissue sample relative to stem-like cells in normal samples in each tissue plotted against the malignancy continuum. Samples are colored based on if they are from different disease stage. |
Top |
Malignant transformation related pathway analysis |
| Find out the enriched GO biological processes and KEGG pathways involved in transition from healthy to precancer to cancer |
| Tissue | Disease Stage | Enriched GO biological Processes |
| Colorectum | AD |  |
| Colorectum | SER |  |
| Colorectum | MSS |  |
| Colorectum | MSI-H |  |
| Colorectum | FAP |  |
| ∗Top 15 enriched GO BP terms are showed in the bar plot of each disease state in each tissue. Each row represents a significant GO biological process which is colored according to the -log10(p.adjust). |
| Page: 1 2 3 4 5 6 7 8 9 |
| GO ID | Tissue | Disease Stage | Description | Gene Ratio | Bg Ratio | pvalue | p.adjust | Count |
| Page: 1 |
| Pathway ID | Tissue | Disease Stage | Description | Gene Ratio | Bg Ratio | pvalue | p.adjust | qvalue | Count |
| Page: 1 |
Top |
Cell-cell communication analysis |
| Identification of potential cell-cell interactions between two cell types and their ligand-receptor pairs for different disease states |
| Ligand | Receptor | LRpair | Pathway | Tissue | Disease Stage |
| Page: 1 |
Top |
Single-cell gene regulatory network inference analysis |
| Find out the significant the regulons (TFs) and the target genes of each regulon across cell types for different disease states |
| TF | Cell Type | Tissue | Disease Stage | Target Gene | RSS | Regulon Activity |
| ZKSCAN8 | MSC | Stomach | CAG with IM | TYW1B,ZNF524,REV1, etc. | 1.38e-01 |  |
| ZKSCAN8 | MVA | Stomach | SIM | TYW1B,ZNF524,REV1, etc. | 1.43e-01 |  |
| ∗The dot plots of a searched regulon are shown for all cell subpopulations in each disease state of each tissue based on the regulon specific score inferred using pySCENIC and by calculating the average expression. |
| Page: 1 |
Top |
Somatic mutation of malignant transformation related genes |
| Annotation of somatic variants for genes involved in malignant transformation |
| Hugo Symbol | Variant Class | Variant Classification | dbSNP RS | HGVSc | HGVSp | HGVSp Short | SWISSPROT | BIOTYPE | SIFT | PolyPhen | Tumor Sample Barcode | Tissue | Histology | Sex | Age | Stage | Therapy Types | Drugs | Outcome |
| ZKSCAN8 | SNV | Missense_Mutation | novel | c.194N>A | p.Pro65His | p.P65H | Q15776 | protein_coding | deleterious(0) | probably_damaging(0.999) | TCGA-A2-A0CX-01 | Breast | breast invasive carcinoma | Female | <65 | I/II | Chemotherapy | adriamycin | SD |
| ZKSCAN8 | SNV | Missense_Mutation | novel | c.1193N>A | p.Arg398Lys | p.R398K | Q15776 | protein_coding | deleterious(0.04) | possibly_damaging(0.531) | TCGA-A7-A4SA-01 | Breast | breast invasive carcinoma | Female | <65 | I/II | Chemotherapy | doxorubicin | CR |
| ZKSCAN8 | SNV | Missense_Mutation | rs202039260 | c.197G>A | p.Arg66Gln | p.R66Q | Q15776 | protein_coding | tolerated(0.65) | probably_damaging(0.992) | TCGA-AC-A23H-01 | Breast | breast invasive carcinoma | Female | >=65 | I/II | Unknown | Unknown | PD |
| ZKSCAN8 | SNV | Missense_Mutation | novel | c.793G>A | p.Glu265Lys | p.E265K | Q15776 | protein_coding | tolerated(0.16) | probably_damaging(0.98) | TCGA-AC-A23H-01 | Breast | breast invasive carcinoma | Female | >=65 | I/II | Unknown | Unknown | PD |
| ZKSCAN8 | SNV | Missense_Mutation | c.839A>T | p.Gln280Leu | p.Q280L | Q15776 | protein_coding | tolerated(0.3) | benign(0.107) | TCGA-BH-A18J-01 | Breast | breast invasive carcinoma | Female | <65 | III/IV | Unknown | Unknown | PD | |
| ZKSCAN8 | SNV | Missense_Mutation | rs149099230 | c.938G>A | p.Arg313Gln | p.R313Q | Q15776 | protein_coding | tolerated(1) | benign(0.001) | TCGA-D8-A142-01 | Breast | breast invasive carcinoma | Female | >=65 | I/II | Chemotherapy | cyclophosphamid | SD |
| ZKSCAN8 | insertion | Nonsense_Mutation | novel | c.196_197insATAGTTAGTTACAATGACTTTTGACTT | p.Arg66delinsHisSerTerLeuGlnTerLeuLeuThrTer | p.R66delinsHS*LQ*LLT* | Q15776 | protein_coding | TCGA-A2-A0CX-01 | Breast | breast invasive carcinoma | Female | <65 | I/II | Chemotherapy | adriamycin | SD | ||
| ZKSCAN8 | SNV | Missense_Mutation | c.928G>C | p.Glu310Gln | p.E310Q | Q15776 | protein_coding | tolerated(0.1) | possibly_damaging(0.549) | TCGA-IR-A3LK-01 | Cervix | cervical & endocervical cancer | Female | >=65 | I/II | Chemotherapy | cisplatin | PD | |
| ZKSCAN8 | SNV | Missense_Mutation | c.1522C>A | p.His508Asn | p.H508N | Q15776 | protein_coding | deleterious(0) | probably_damaging(0.999) | TCGA-AA-A00O-01 | Colorectum | colon adenocarcinoma | Female | >=65 | III/IV | Unknown | Unknown | SD | |
| ZKSCAN8 | SNV | Missense_Mutation | c.1423N>C | p.Ser475Pro | p.S475P | Q15776 | protein_coding | deleterious(0.04) | probably_damaging(0.948) | TCGA-CM-5861-01 | Colorectum | colon adenocarcinoma | Female | <65 | I/II | Unknown | Unknown | PD |
| Page: 1 2 3 4 5 6 |
Top |
Related drugs of malignant transformation related genes |
| Identification of chemicals and drugs interact with genes involved in malignant transfromation |
| (DGIdb 4.0) |
| Entrez ID | Symbol | Category | Interaction Types | Drug Claim Name | Drug Name | PMIDs |
| Page: 1 |

Copyright 2023-Present -The University of Texas Health Science Center at Houston |