
|
|||||
|
 | |
| |
| |
| |
| |
| |
|
Gene: ZKSCAN1 |
Gene summary for ZKSCAN1 |
| Gene information | Species | Human | Gene symbol | ZKSCAN1 | Gene ID | 7586 |
| Gene name | zinc finger with KRAB and SCAN domains 1 | |
| Gene Alias | KOX18 | |
| Cytomap | 7q22.1 | |
| Gene Type | protein-coding | GO ID | GO:0006139 | UniProtAcc | B3KNP9 |
Top |
Malignant transformation analysis |
| Identification of the aberrant gene expression in precancerous and cancerous lesions by comparing the gene expression of stem-like cells in diseased tissues with normal stem cells |
| Entrez ID | Symbol | Replicates | Species | Organ | Tissue | Adj P-value | Log2FC | Malignancy |
| 7586 | ZKSCAN1 | HTA11_1938_2000001011 | Human | Colorectum | AD | 3.27e-04 | 5.67e-01 | -0.0811 |
| 7586 | ZKSCAN1 | HTA11_78_2000001011 | Human | Colorectum | AD | 1.28e-05 | 6.25e-01 | -0.1088 |
| 7586 | ZKSCAN1 | HTA11_347_2000001011 | Human | Colorectum | AD | 1.29e-23 | 1.01e+00 | -0.1954 |
| 7586 | ZKSCAN1 | HTA11_696_2000001011 | Human | Colorectum | AD | 1.94e-04 | 4.85e-01 | -0.1464 |
| 7586 | ZKSCAN1 | HTA11_1391_2000001011 | Human | Colorectum | AD | 8.08e-04 | 5.80e-01 | -0.059 |
| 7586 | ZKSCAN1 | HTA11_546_2000001011 | Human | Colorectum | AD | 6.71e-05 | 6.89e-01 | -0.0842 |
| 7586 | ZKSCAN1 | HTA11_7663_2000001011 | Human | Colorectum | SER | 2.67e-02 | 6.20e-01 | 0.0131 |
| 7586 | ZKSCAN1 | HTA11_10623_2000001011 | Human | Colorectum | AD | 1.06e-03 | 6.17e-01 | -0.0177 |
| 7586 | ZKSCAN1 | HTA11_7696_3000711011 | Human | Colorectum | AD | 1.06e-07 | 5.52e-01 | 0.0674 |
| 7586 | ZKSCAN1 | HTA11_6818_2000001011 | Human | Colorectum | AD | 9.35e-07 | 7.84e-01 | 0.0112 |
| 7586 | ZKSCAN1 | HTA11_99999965062_69753 | Human | Colorectum | MSI-H | 4.88e-15 | 1.22e+00 | 0.3487 |
| 7586 | ZKSCAN1 | HTA11_99999965104_69814 | Human | Colorectum | MSS | 9.45e-22 | 1.13e+00 | 0.281 |
| 7586 | ZKSCAN1 | HTA11_99999971662_82457 | Human | Colorectum | MSS | 4.45e-05 | 7.76e-01 | 0.3859 |
| 7586 | ZKSCAN1 | F007 | Human | Colorectum | FAP | 1.33e-03 | 1.20e-01 | 0.1176 |
| 7586 | ZKSCAN1 | A001-C-207 | Human | Colorectum | FAP | 3.76e-03 | -1.43e-01 | 0.1278 |
| 7586 | ZKSCAN1 | A015-C-203 | Human | Colorectum | FAP | 1.24e-26 | 2.39e-02 | -0.1294 |
| 7586 | ZKSCAN1 | A015-C-204 | Human | Colorectum | FAP | 2.38e-05 | -1.46e-01 | -0.0228 |
| 7586 | ZKSCAN1 | A014-C-040 | Human | Colorectum | FAP | 1.40e-06 | 6.04e-02 | -0.1184 |
| 7586 | ZKSCAN1 | A002-C-201 | Human | Colorectum | FAP | 1.74e-13 | -9.03e-02 | 0.0324 |
| 7586 | ZKSCAN1 | A002-C-203 | Human | Colorectum | FAP | 8.92e-03 | 2.09e-01 | 0.2786 |
| Page: 1 2 3 4 5 6 7 8 9 10 11 12 |
| Tissue | Expression Dynamics | Abbreviation |
| Colorectum (GSE201348) |  | FAP: Familial adenomatous polyposis |
| CRC: Colorectal cancer | ||
| Colorectum (HTA11) |  | AD: Adenomas |
| SER: Sessile serrated lesions | ||
| MSI-H: Microsatellite-high colorectal cancer | ||
| MSS: Microsatellite stable colorectal cancer | ||
| Endometrium |  | AEH: Atypical endometrial hyperplasia |
| EEC: Endometrioid Cancer | ||
| Esophagus | 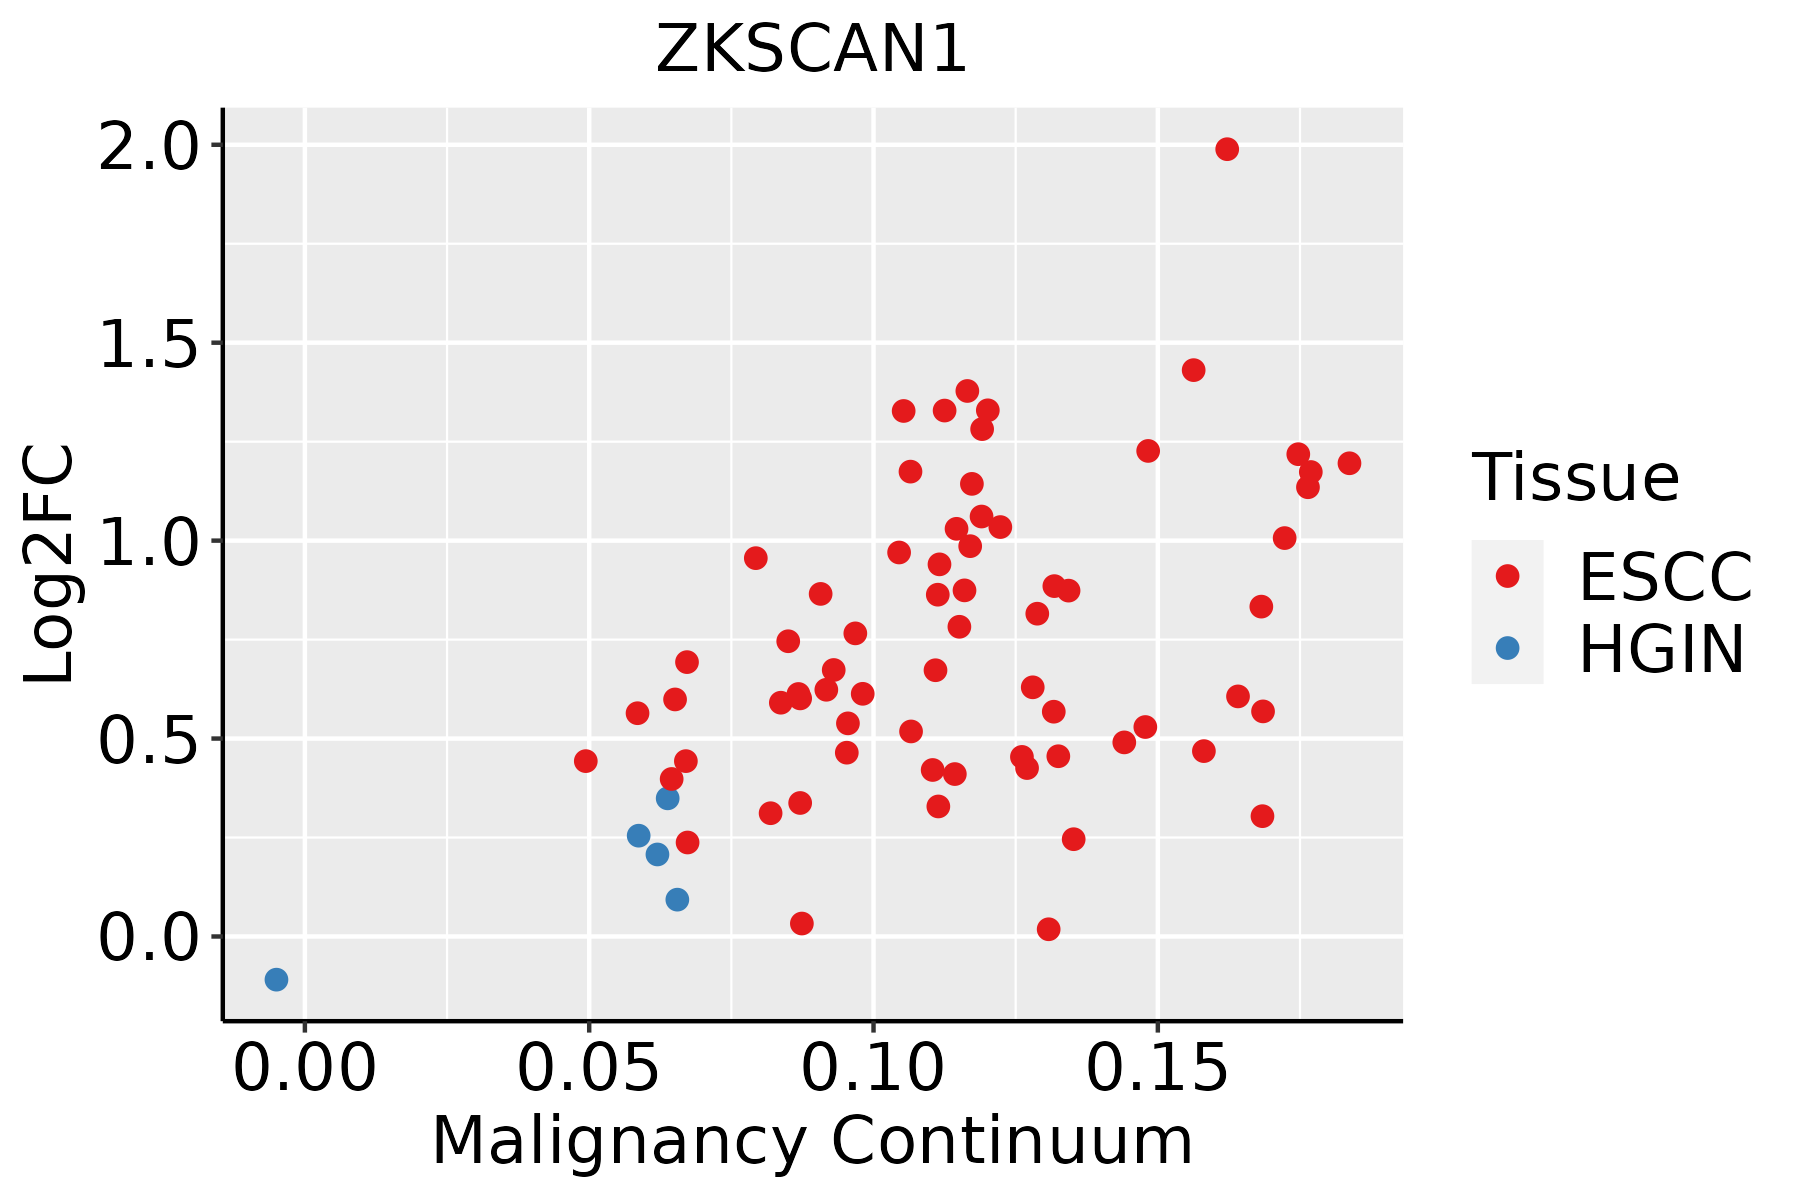 | ESCC: Esophageal squamous cell carcinoma |
| HGIN: High-grade intraepithelial neoplasias | ||
| LGIN: Low-grade intraepithelial neoplasias | ||
| Liver | 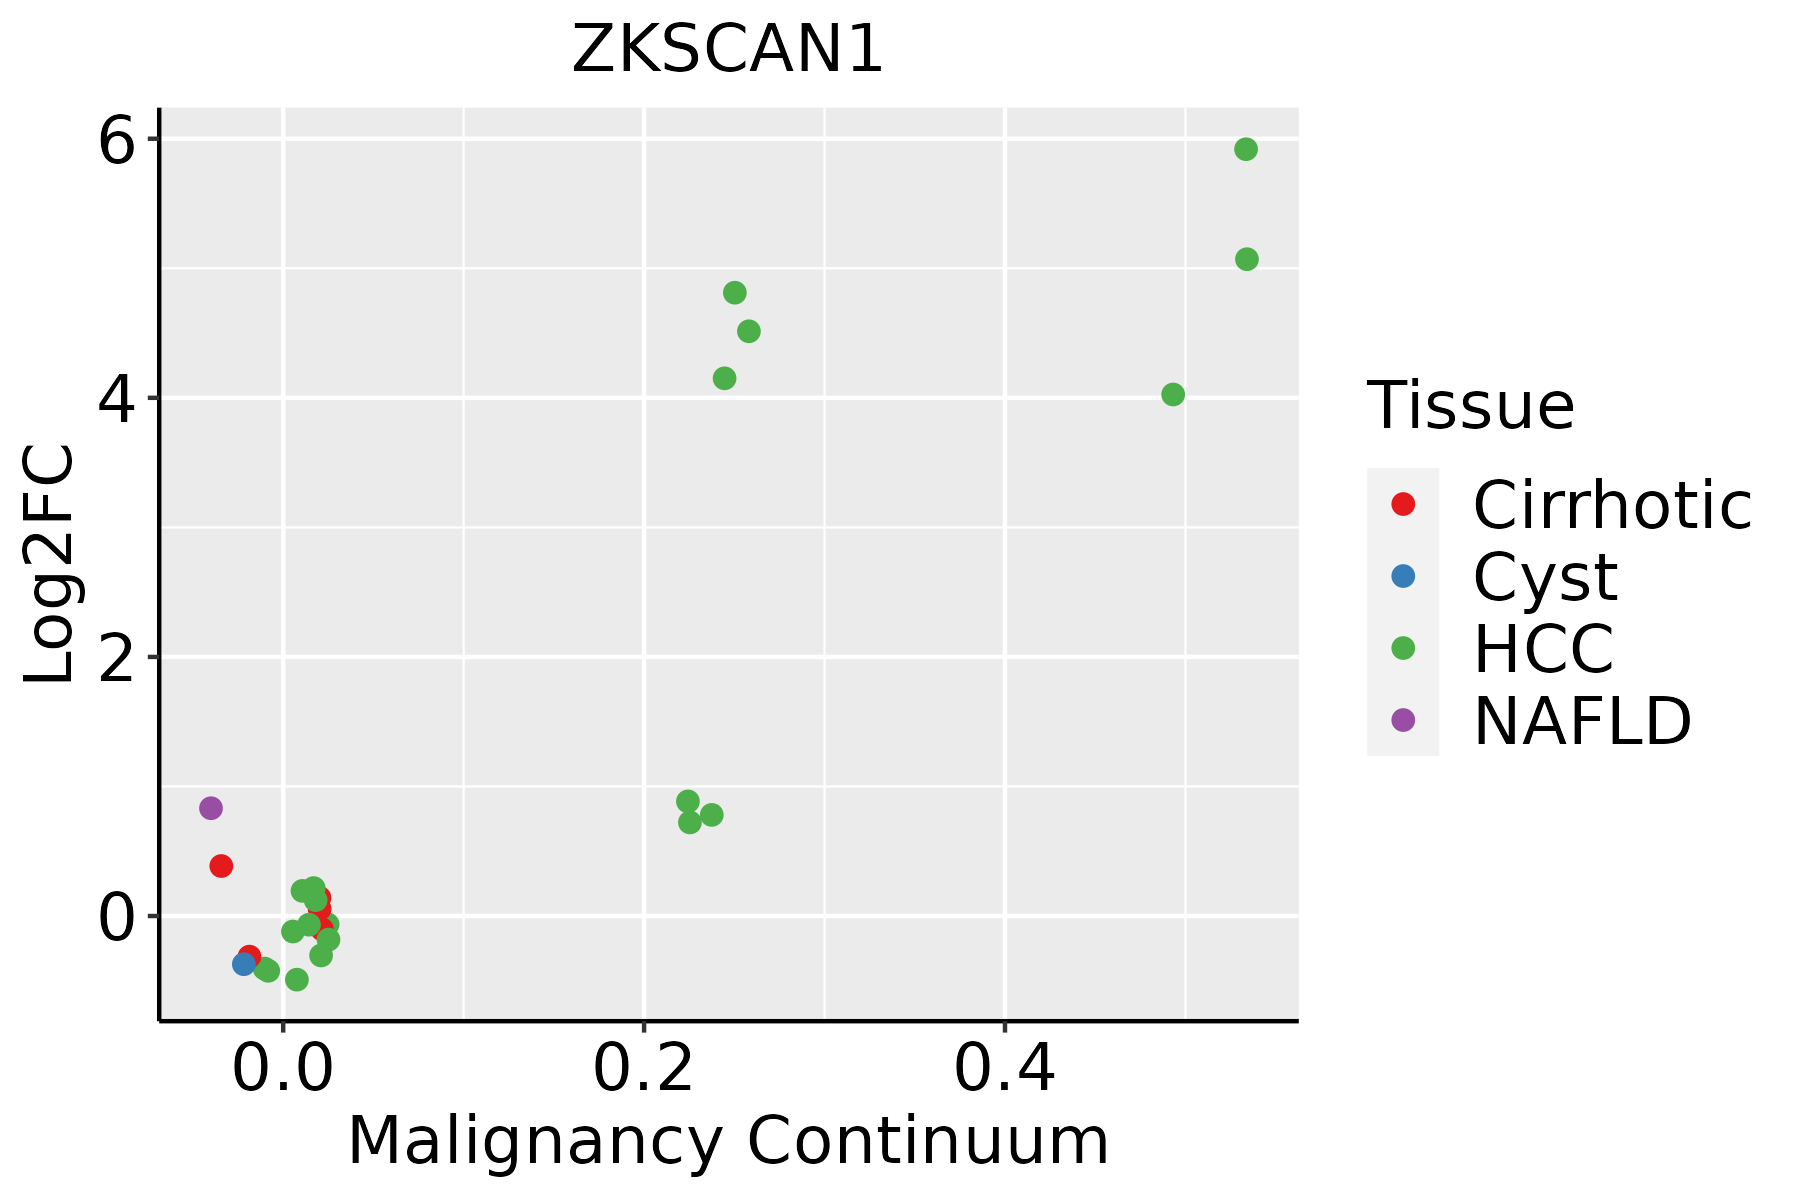 | HCC: Hepatocellular carcinoma |
| NAFLD: Non-alcoholic fatty liver disease | ||
| Lung |  | AAH: Atypical adenomatous hyperplasia |
| AIS: Adenocarcinoma in situ | ||
| IAC: Invasive lung adenocarcinoma | ||
| MIA: Minimally invasive adenocarcinoma | ||
| Oral Cavity | 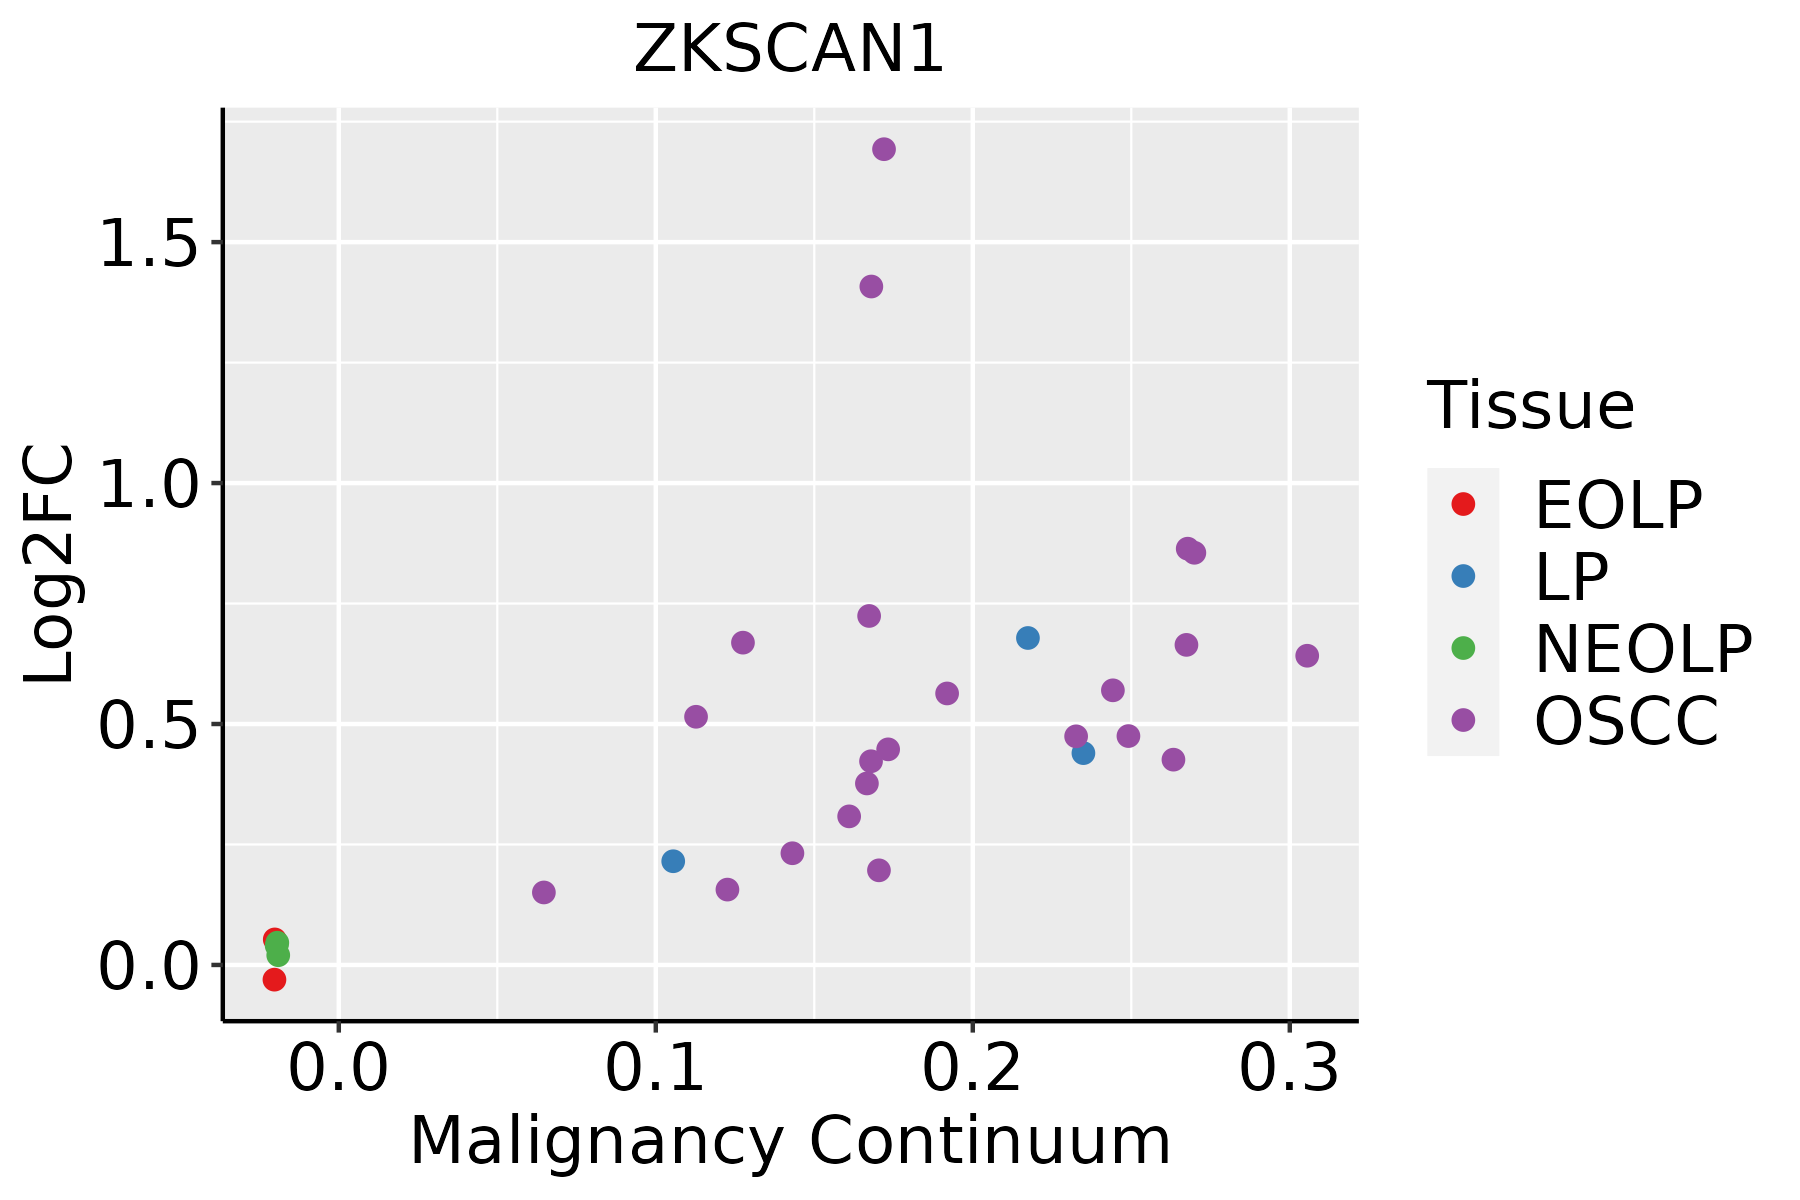 | EOLP: Erosive Oral lichen planus |
| LP: leukoplakia | ||
| NEOLP: Non-erosive oral lichen planus | ||
| OSCC: Oral squamous cell carcinoma | ||
| Prostate | 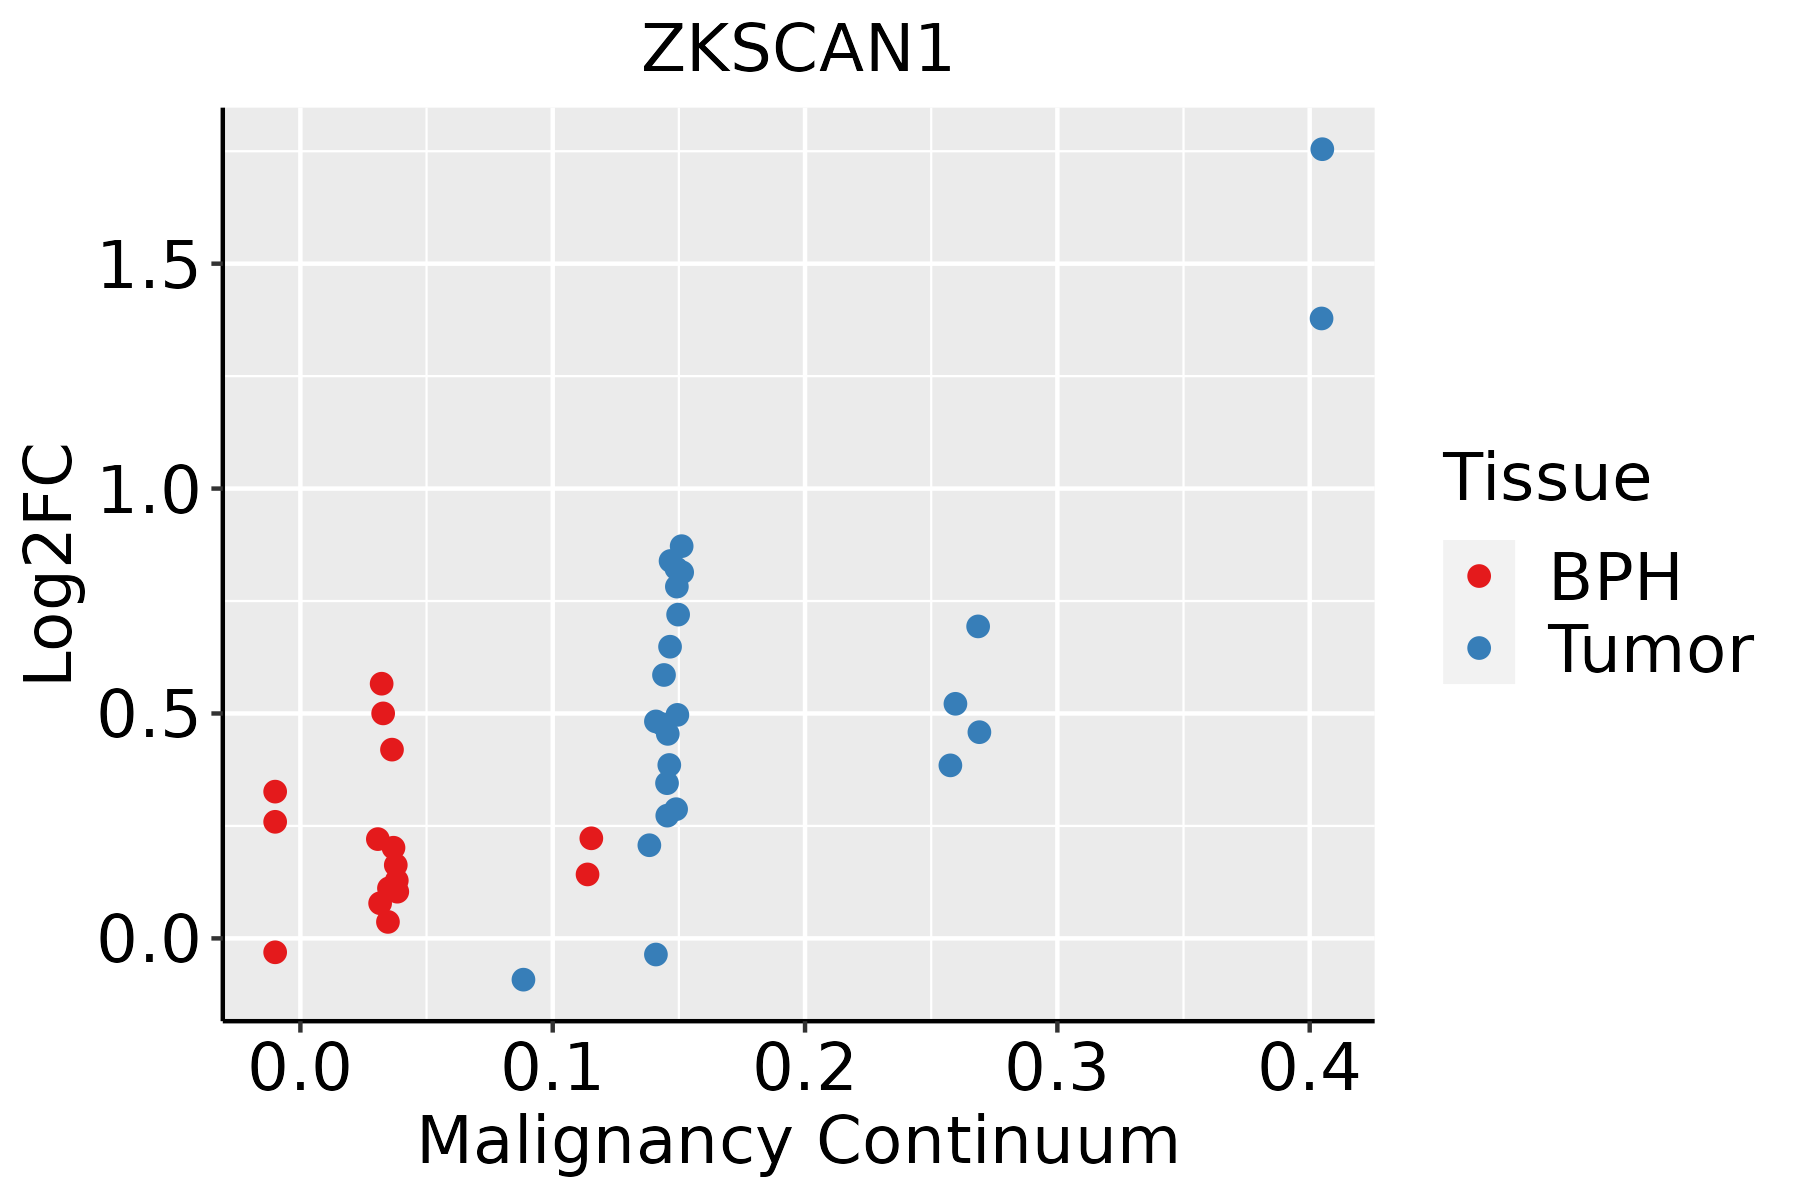 | BPH: Benign Prostatic Hyperplasia |
| Skin | 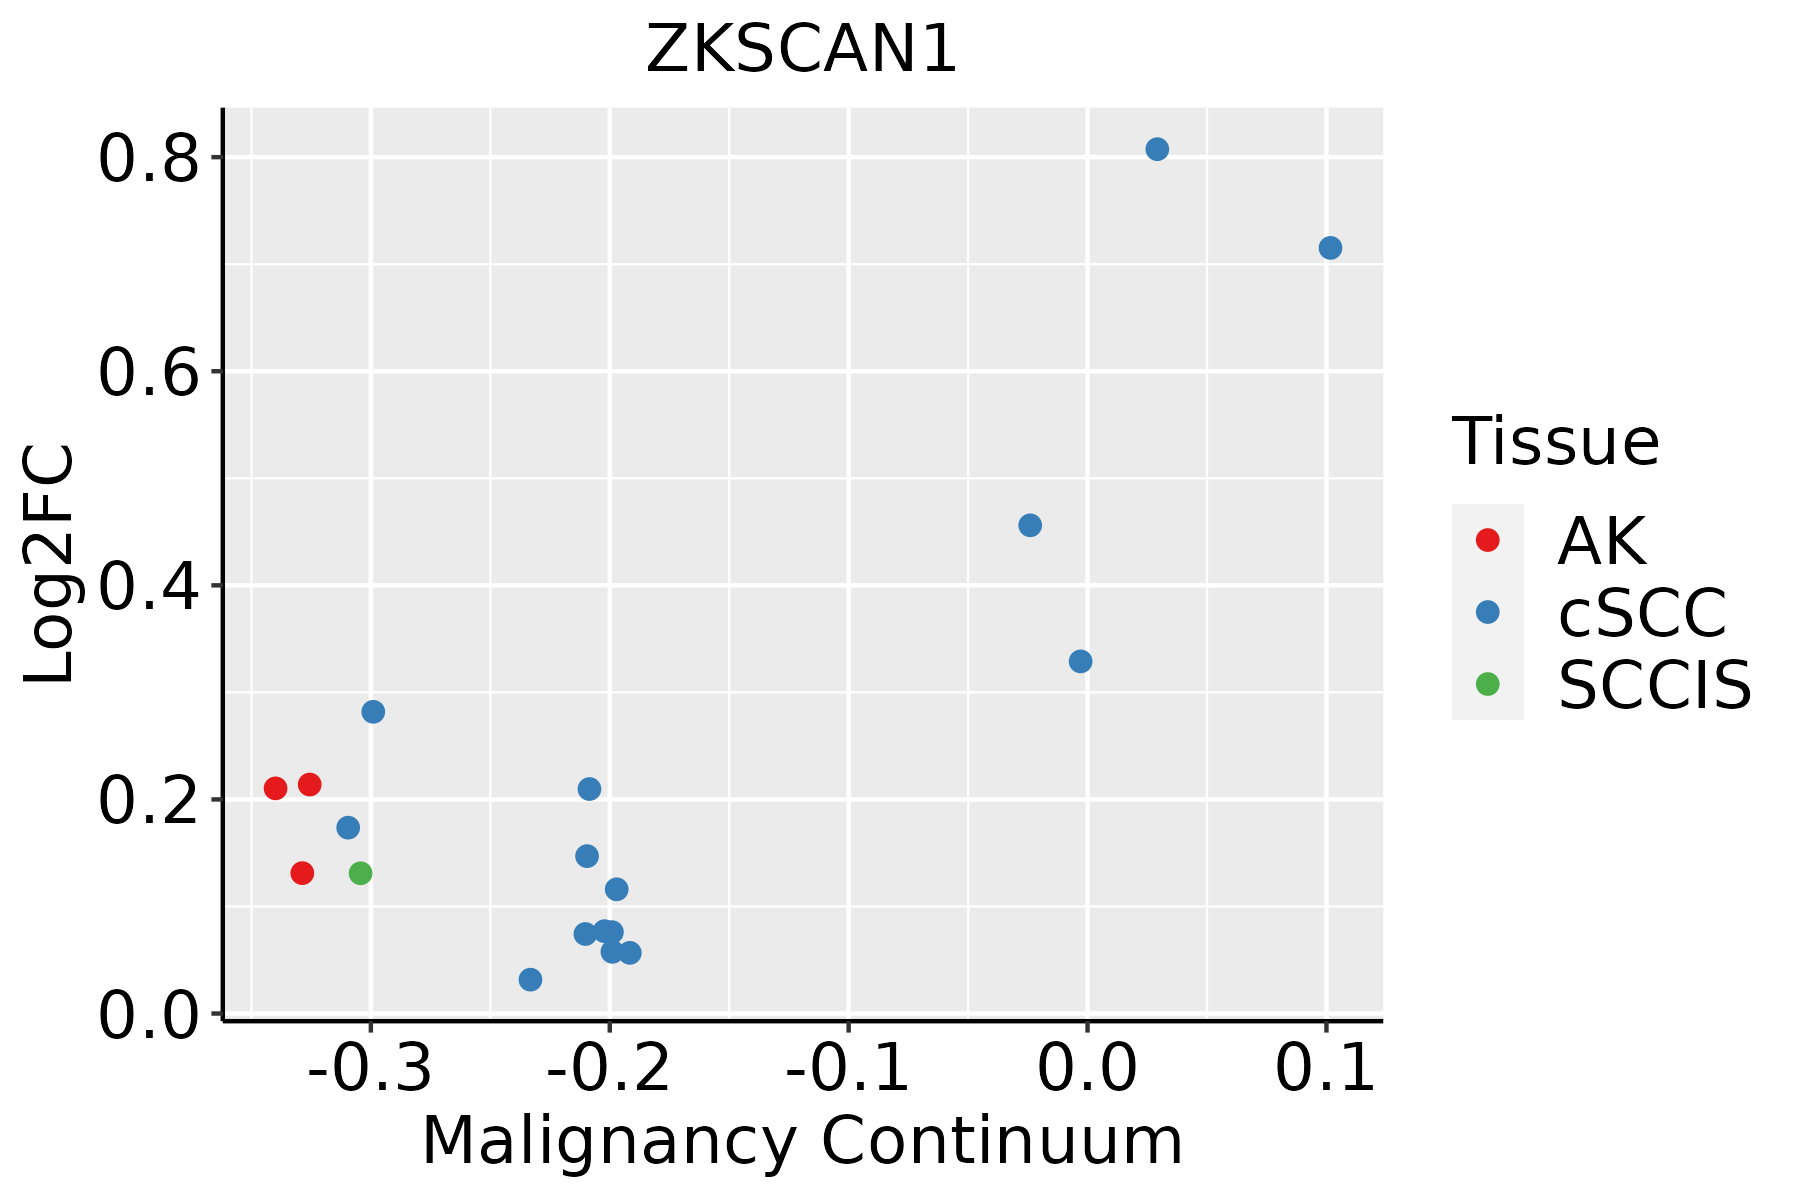 | AK: Actinic keratosis |
| cSCC: Cutaneous squamous cell carcinoma | ||
| SCCIS:squamous cell carcinoma in situ | ||
| Thyroid | 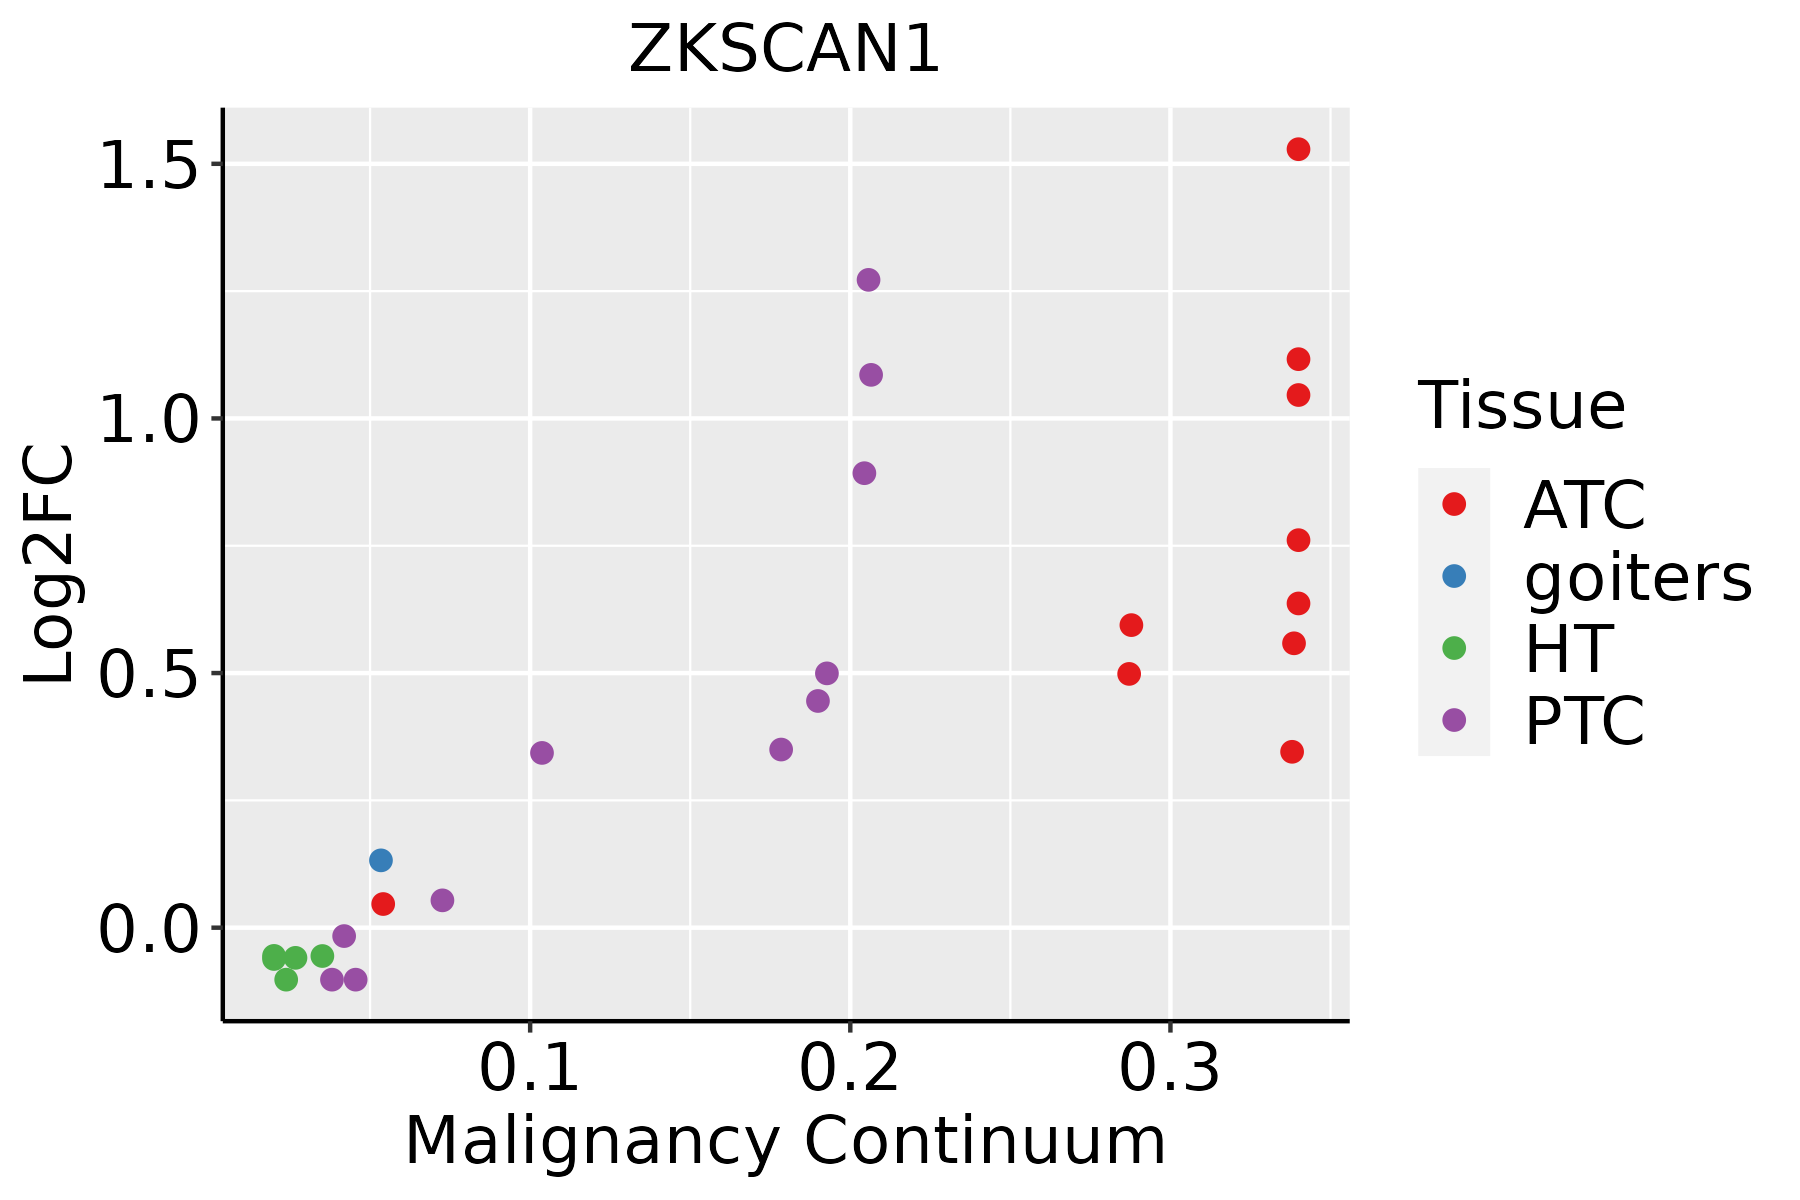 | ATC: Anaplastic thyroid cancer |
| HT: Hashimoto's thyroiditis | ||
| PTC: Papillary thyroid cancer |
| ∗log2FC in expression of this searched gene in stem-like cells from each diseased tissue sample relative to stem-like cells in normal samples in each tissue plotted against the malignancy continuum. Samples are colored based on if they are from different disease stage. |
Top |
Malignant transformation related pathway analysis |
| Find out the enriched GO biological processes and KEGG pathways involved in transition from healthy to precancer to cancer |
| Tissue | Disease Stage | Enriched GO biological Processes |
| Colorectum | AD |  |
| Colorectum | SER |  |
| Colorectum | MSS |  |
| Colorectum | MSI-H |  |
| Colorectum | FAP |  |
| ∗Top 15 enriched GO BP terms are showed in the bar plot of each disease state in each tissue. Each row represents a significant GO biological process which is colored according to the -log10(p.adjust). |
| Page: 1 2 3 4 5 6 7 8 9 |
| GO ID | Tissue | Disease Stage | Description | Gene Ratio | Bg Ratio | pvalue | p.adjust | Count |
| Page: 1 |
| Pathway ID | Tissue | Disease Stage | Description | Gene Ratio | Bg Ratio | pvalue | p.adjust | qvalue | Count |
| Page: 1 |
Top |
Cell-cell communication analysis |
| Identification of potential cell-cell interactions between two cell types and their ligand-receptor pairs for different disease states |
| Ligand | Receptor | LRpair | Pathway | Tissue | Disease Stage |
| Page: 1 |
Top |
Single-cell gene regulatory network inference analysis |
| Find out the significant the regulons (TFs) and the target genes of each regulon across cell types for different disease states |
| TF | Cell Type | Tissue | Disease Stage | Target Gene | RSS | Regulon Activity |
| ZKSCAN1 | TH1 | Colorectum | FAP | SORBS2,S100A16,POF1B, etc. | 8.35e-02 |  |
| ZKSCAN1 | LYMEND | Liver | HCC | RGN,CREB3L3,AFMID, etc. | 1.39e-02 |  |
| ZKSCAN1 | LYMEND | Liver | Healthy | RGN,CREB3L3,AFMID, etc. | 2.33e-01 |  |
| ∗The dot plots of a searched regulon are shown for all cell subpopulations in each disease state of each tissue based on the regulon specific score inferred using pySCENIC and by calculating the average expression. |
| Page: 1 |
Top |
Somatic mutation of malignant transformation related genes |
| Annotation of somatic variants for genes involved in malignant transformation |
| Hugo Symbol | Variant Class | Variant Classification | dbSNP RS | HGVSc | HGVSp | HGVSp Short | SWISSPROT | BIOTYPE | SIFT | PolyPhen | Tumor Sample Barcode | Tissue | Histology | Sex | Age | Stage | Therapy Types | Drugs | Outcome |
| ZKSCAN1 | SNV | Missense_Mutation | c.229C>G | p.Leu77Val | p.L77V | P17029 | protein_coding | deleterious(0) | possibly_damaging(0.744) | TCGA-A2-A04T-01 | Breast | breast invasive carcinoma | Female | <65 | I/II | Chemotherapy | cyclophosphamide | SD | |
| ZKSCAN1 | SNV | Missense_Mutation | rs772572650 | c.1523G>A | p.Arg508Gln | p.R508Q | P17029 | protein_coding | tolerated(1) | benign(0.117) | TCGA-AN-A046-01 | Breast | breast invasive carcinoma | Female | >=65 | I/II | Unknown | Unknown | SD |
| ZKSCAN1 | SNV | Missense_Mutation | c.1589N>G | p.Ser530Cys | p.S530C | P17029 | protein_coding | deleterious(0) | possibly_damaging(0.785) | TCGA-BH-A0W3-01 | Breast | breast invasive carcinoma | Female | <65 | I/II | Unknown | Unknown | SD | |
| ZKSCAN1 | SNV | Missense_Mutation | novel | c.1307N>G | p.Asn436Ser | p.N436S | P17029 | protein_coding | deleterious(0.05) | benign(0.024) | TCGA-E9-A1ND-01 | Breast | breast invasive carcinoma | Female | >=65 | I/II | Hormone Therapy | aromasin | SD |
| ZKSCAN1 | insertion | Nonsense_Mutation | novel | c.551_552insCTCCAAGCAAACACCCTGAGGGTGGAGTCGGCCTGTTTGAGGTT | p.Arg185SerfsTer6 | p.R185Sfs*6 | P17029 | protein_coding | TCGA-BH-A0HK-01 | Breast | breast invasive carcinoma | Female | >=65 | I/II | Hormone Therapy | arimidex | SD | ||
| ZKSCAN1 | insertion | Frame_Shift_Ins | novel | c.19_20insG | p.Glu8GlyfsTer26 | p.E8Gfs*26 | P17029 | protein_coding | TCGA-BH-A1EN-01 | Breast | breast invasive carcinoma | Female | >=65 | I/II | Unknown | Unknown | SD | ||
| ZKSCAN1 | SNV | Missense_Mutation | novel | c.1358N>A | p.Arg453His | p.R453H | P17029 | protein_coding | deleterious(0) | probably_damaging(0.982) | TCGA-AA-3864-01 | Colorectum | colon adenocarcinoma | Male | >=65 | I/II | Unknown | Unknown | SD |
| ZKSCAN1 | SNV | Missense_Mutation | novel | c.523G>A | p.Ala175Thr | p.A175T | P17029 | protein_coding | tolerated(0.62) | benign(0) | TCGA-AA-3947-01 | Colorectum | colon adenocarcinoma | Female | <65 | I/II | Unknown | Unknown | SD |
| ZKSCAN1 | SNV | Missense_Mutation | c.883N>A | p.Gly295Arg | p.G295R | P17029 | protein_coding | deleterious(0.04) | benign(0.044) | TCGA-AG-3878-01 | Colorectum | rectum adenocarcinoma | Male | <65 | I/II | Unknown | Unknown | SD | |
| ZKSCAN1 | deletion | Frame_Shift_Del | c.1012delN | p.Thr340ProfsTer21 | p.T340Pfs*21 | P17029 | protein_coding | TCGA-AD-5900-01 | Colorectum | colon adenocarcinoma | Male | >=65 | I/II | Unknown | Unknown | SD |
| Page: 1 2 3 4 5 6 |
Top |
Related drugs of malignant transformation related genes |
| Identification of chemicals and drugs interact with genes involved in malignant transfromation |
| (DGIdb 4.0) |
| Entrez ID | Symbol | Category | Interaction Types | Drug Claim Name | Drug Name | PMIDs |
| Page: 1 |

Copyright 2023-Present -The University of Texas Health Science Center at Houston |