
|
|||||
|
 | |
| |
| |
| |
| |
| |
|
Gene: ZIC1 |
Gene summary for ZIC1 |
| Gene information | Species | Human | Gene symbol | ZIC1 | Gene ID | 7545 |
| Gene name | Zic family member 1 | |
| Gene Alias | BAIDCS | |
| Cytomap | 3q24 | |
| Gene Type | protein-coding | GO ID | GO:0006139 | UniProtAcc | Q15915 |
Top |
Malignant transformation analysis |
| Identification of the aberrant gene expression in precancerous and cancerous lesions by comparing the gene expression of stem-like cells in diseased tissues with normal stem cells |
| Entrez ID | Symbol | Replicates | Species | Organ | Tissue | Adj P-value | Log2FC | Malignancy |
| 7545 | ZIC1 | LZE4T | Human | Esophagus | ESCC | 8.22e-34 | 7.51e-01 | 0.0811 |
| 7545 | ZIC1 | LZE8T | Human | Esophagus | ESCC | 5.45e-16 | 4.06e-01 | 0.067 |
| 7545 | ZIC1 | P1T-E | Human | Esophagus | ESCC | 2.97e-02 | 2.04e-01 | 0.0875 |
| 7545 | ZIC1 | P5T-E | Human | Esophagus | ESCC | 1.51e-34 | 5.81e-01 | 0.1327 |
| 7545 | ZIC1 | P10T-E | Human | Esophagus | ESCC | 2.07e-74 | 1.16e+00 | 0.116 |
| 7545 | ZIC1 | P11T-E | Human | Esophagus | ESCC | 2.05e-22 | 7.06e-01 | 0.1426 |
| 7545 | ZIC1 | P16T-E | Human | Esophagus | ESCC | 3.90e-42 | 6.96e-01 | 0.1153 |
| 7545 | ZIC1 | P20T-E | Human | Esophagus | ESCC | 1.38e-55 | 1.01e+00 | 0.1124 |
| 7545 | ZIC1 | P21T-E | Human | Esophagus | ESCC | 4.44e-08 | 2.12e-01 | 0.1617 |
| 7545 | ZIC1 | P26T-E | Human | Esophagus | ESCC | 1.59e-30 | 4.82e-01 | 0.1276 |
| 7545 | ZIC1 | P27T-E | Human | Esophagus | ESCC | 5.12e-47 | 8.17e-01 | 0.1055 |
| 7545 | ZIC1 | P31T-E | Human | Esophagus | ESCC | 2.49e-44 | 7.64e-01 | 0.1251 |
| 7545 | ZIC1 | P32T-E | Human | Esophagus | ESCC | 2.08e-40 | 8.01e-01 | 0.1666 |
| 7545 | ZIC1 | P36T-E | Human | Esophagus | ESCC | 4.85e-17 | 4.73e-01 | 0.1187 |
| 7545 | ZIC1 | P39T-E | Human | Esophagus | ESCC | 3.87e-34 | 5.75e-01 | 0.0894 |
| 7545 | ZIC1 | P40T-E | Human | Esophagus | ESCC | 4.43e-16 | 5.23e-01 | 0.109 |
| 7545 | ZIC1 | P42T-E | Human | Esophagus | ESCC | 4.49e-48 | 1.07e+00 | 0.1175 |
| 7545 | ZIC1 | P52T-E | Human | Esophagus | ESCC | 9.56e-08 | 2.11e-01 | 0.1555 |
| 7545 | ZIC1 | P56T-E | Human | Esophagus | ESCC | 5.84e-10 | 1.08e+00 | 0.1613 |
| 7545 | ZIC1 | P57T-E | Human | Esophagus | ESCC | 9.53e-09 | 2.39e-01 | 0.0926 |
| Page: 1 2 |
| Tissue | Expression Dynamics | Abbreviation |
| Esophagus | 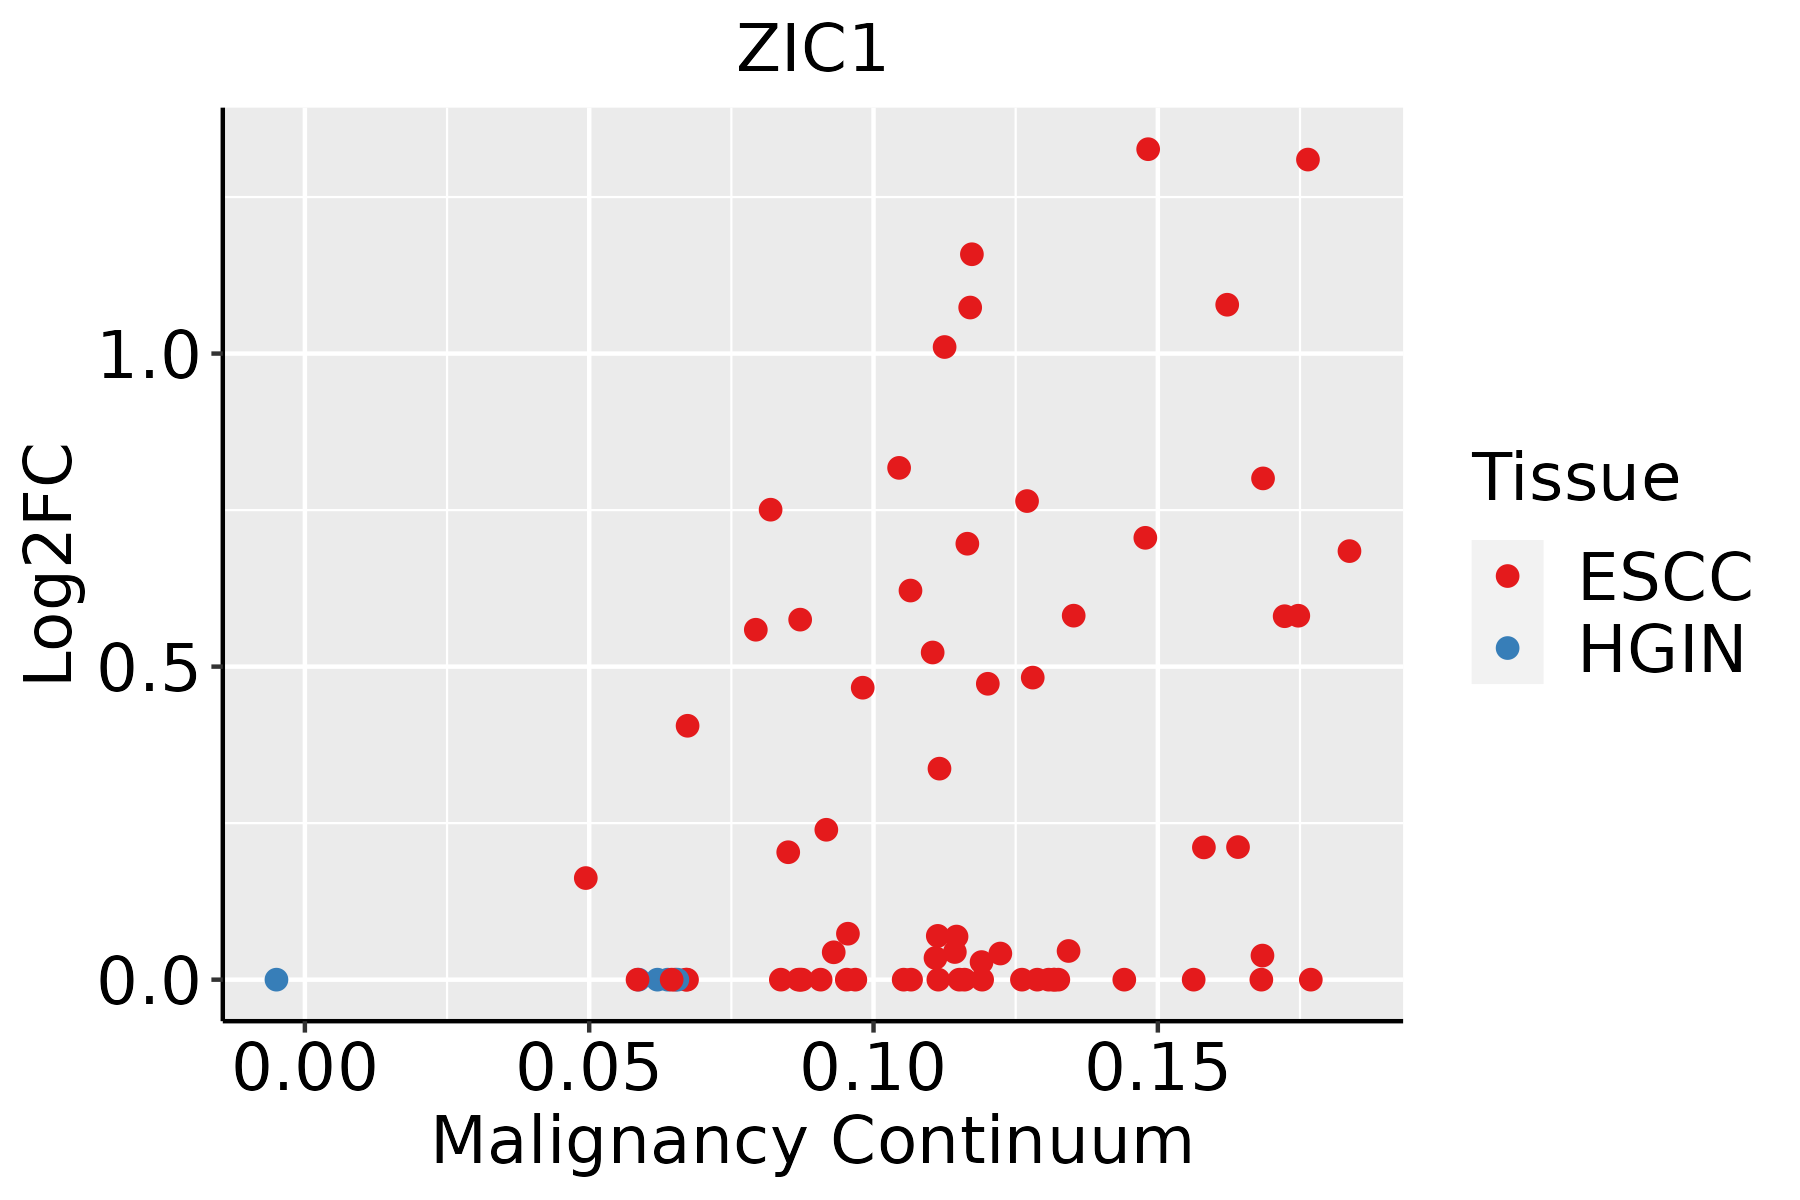 | ESCC: Esophageal squamous cell carcinoma |
| HGIN: High-grade intraepithelial neoplasias | ||
| LGIN: Low-grade intraepithelial neoplasias | ||
| Liver | 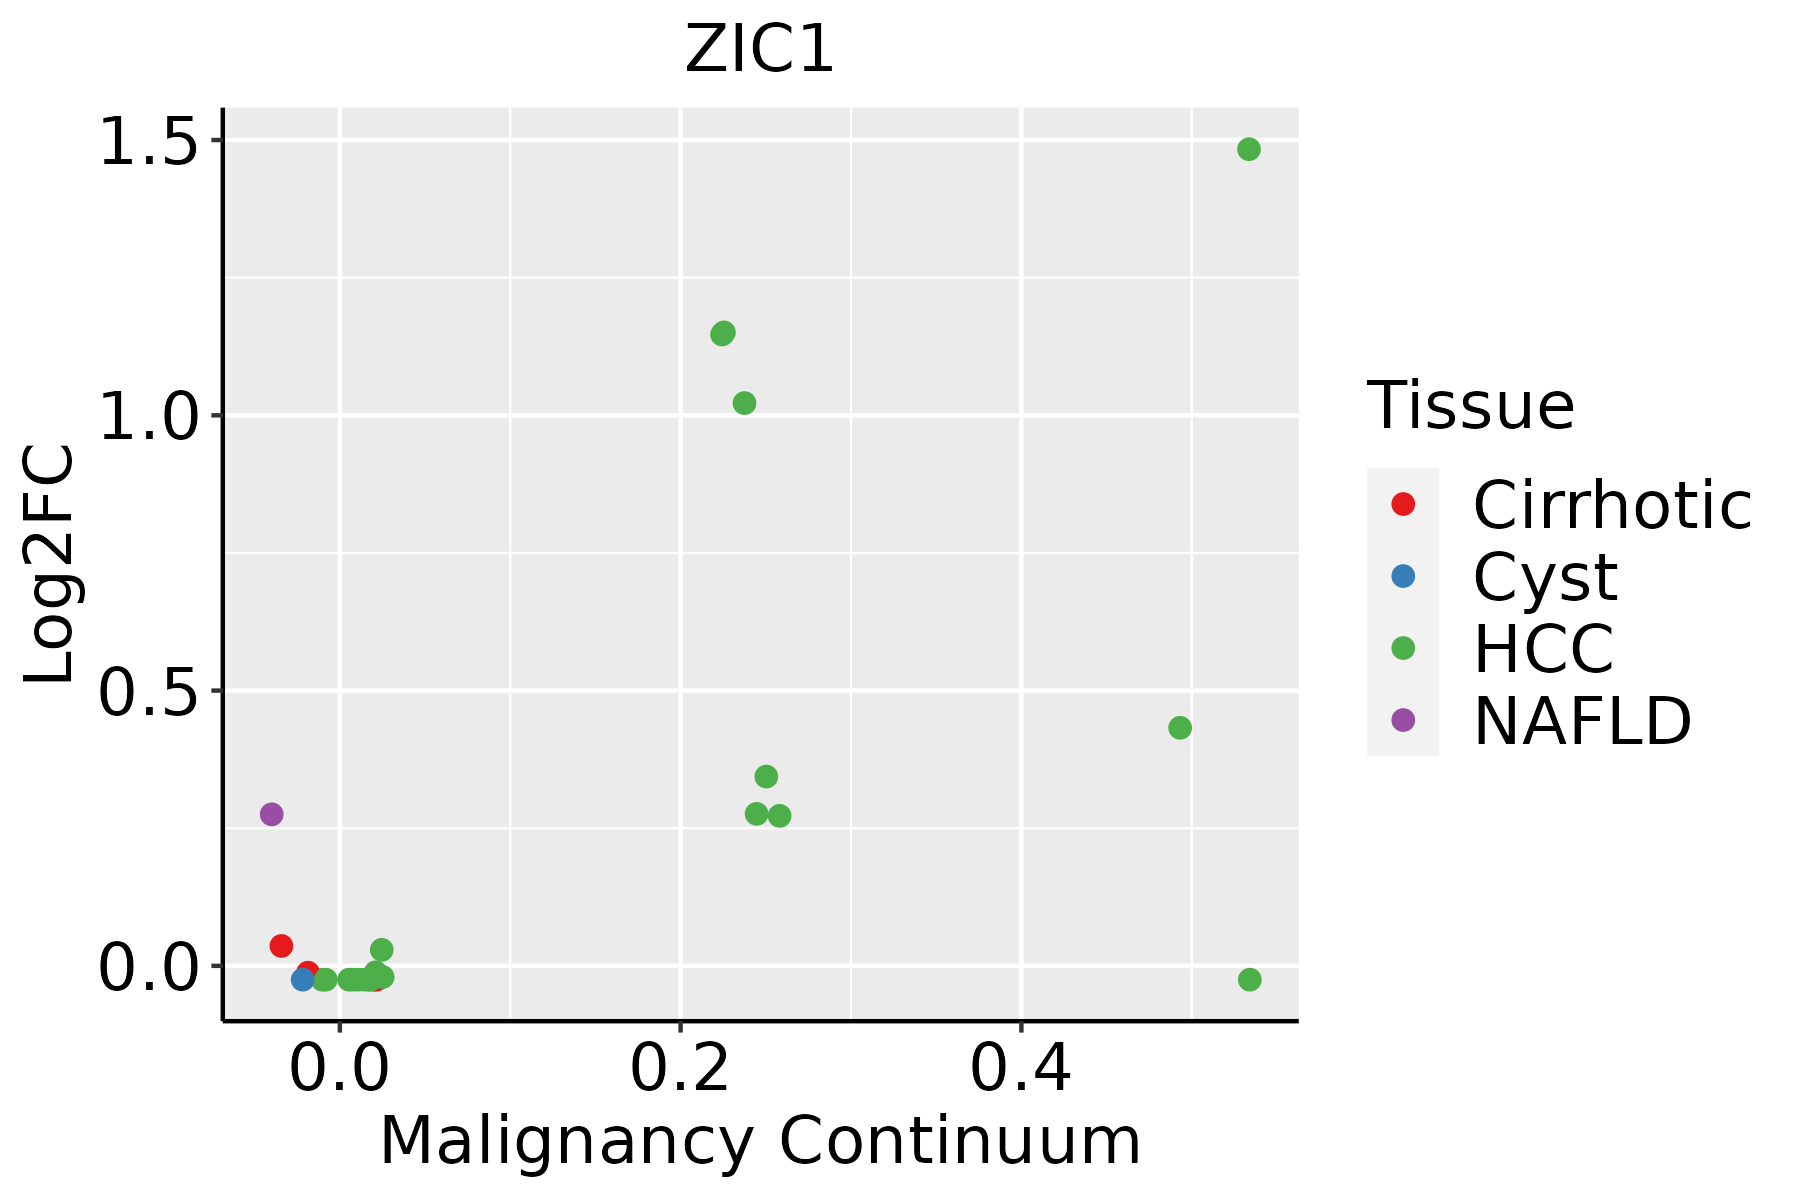 | HCC: Hepatocellular carcinoma |
| NAFLD: Non-alcoholic fatty liver disease |
| ∗log2FC in expression of this searched gene in stem-like cells from each diseased tissue sample relative to stem-like cells in normal samples in each tissue plotted against the malignancy continuum. Samples are colored based on if they are from different disease stage. |
Top |
Malignant transformation related pathway analysis |
| Find out the enriched GO biological processes and KEGG pathways involved in transition from healthy to precancer to cancer |
| Tissue | Disease Stage | Enriched GO biological Processes |
| Colorectum | AD |  |
| Colorectum | SER |  |
| Colorectum | MSS |  |
| Colorectum | MSI-H |  |
| Colorectum | FAP |  |
| ∗Top 15 enriched GO BP terms are showed in the bar plot of each disease state in each tissue. Each row represents a significant GO biological process which is colored according to the -log10(p.adjust). |
| Page: 1 2 3 4 5 6 7 8 9 |
| GO ID | Tissue | Disease Stage | Description | Gene Ratio | Bg Ratio | pvalue | p.adjust | Count |
| GO:0072594110 | Esophagus | ESCC | establishment of protein localization to organelle | 311/8552 | 422/18723 | 3.02e-32 | 2.13e-29 | 311 |
| GO:0006913110 | Esophagus | ESCC | nucleocytoplasmic transport | 230/8552 | 301/18723 | 6.04e-28 | 2.02e-25 | 230 |
| GO:0051169110 | Esophagus | ESCC | nuclear transport | 230/8552 | 301/18723 | 6.04e-28 | 2.02e-25 | 230 |
| GO:003238618 | Esophagus | ESCC | regulation of intracellular transport | 243/8552 | 337/18723 | 3.20e-23 | 7.25e-21 | 243 |
| GO:003450418 | Esophagus | ESCC | protein localization to nucleus | 211/8552 | 290/18723 | 4.06e-21 | 6.60e-19 | 211 |
| GO:1903829111 | Esophagus | ESCC | positive regulation of cellular protein localization | 199/8552 | 276/18723 | 2.99e-19 | 3.45e-17 | 199 |
| GO:0033157110 | Esophagus | ESCC | regulation of intracellular protein transport | 169/8552 | 229/18723 | 3.31e-18 | 3.23e-16 | 169 |
| GO:0032388110 | Esophagus | ESCC | positive regulation of intracellular transport | 152/8552 | 202/18723 | 7.89e-18 | 7.36e-16 | 152 |
| GO:1904951111 | Esophagus | ESCC | positive regulation of establishment of protein localization | 216/8552 | 319/18723 | 1.01e-15 | 6.86e-14 | 216 |
| GO:0046822110 | Esophagus | ESCC | regulation of nucleocytoplasmic transport | 88/8552 | 106/18723 | 1.88e-15 | 1.19e-13 | 88 |
| GO:009031617 | Esophagus | ESCC | positive regulation of intracellular protein transport | 122/8552 | 160/18723 | 2.45e-15 | 1.49e-13 | 122 |
| GO:001703818 | Esophagus | ESCC | protein import | 149/8552 | 206/18723 | 5.90e-15 | 3.31e-13 | 149 |
| GO:0051222111 | Esophagus | ESCC | positive regulation of protein transport | 204/8552 | 303/18723 | 1.56e-14 | 8.38e-13 | 204 |
| GO:190018018 | Esophagus | ESCC | regulation of protein localization to nucleus | 102/8552 | 136/18723 | 2.84e-12 | 1.13e-10 | 102 |
| GO:190018217 | Esophagus | ESCC | positive regulation of protein localization to nucleus | 70/8552 | 87/18723 | 2.63e-11 | 8.99e-10 | 70 |
| GO:004682417 | Esophagus | ESCC | positive regulation of nucleocytoplasmic transport | 52/8552 | 62/18723 | 5.40e-10 | 1.38e-08 | 52 |
| GO:005117014 | Esophagus | ESCC | import into nucleus | 111/8552 | 159/18723 | 5.69e-10 | 1.44e-08 | 111 |
| GO:000660613 | Esophagus | ESCC | protein import into nucleus | 108/8552 | 155/18723 | 1.16e-09 | 2.77e-08 | 108 |
| GO:190458914 | Esophagus | ESCC | regulation of protein import | 49/8552 | 63/18723 | 1.91e-07 | 2.97e-06 | 49 |
| GO:190459116 | Esophagus | ESCC | positive regulation of protein import | 36/8552 | 43/18723 | 2.90e-07 | 4.20e-06 | 36 |
| Page: 1 2 3 |
| Pathway ID | Tissue | Disease Stage | Description | Gene Ratio | Bg Ratio | pvalue | p.adjust | qvalue | Count |
| Page: 1 |
Top |
Cell-cell communication analysis |
| Identification of potential cell-cell interactions between two cell types and their ligand-receptor pairs for different disease states |
| Ligand | Receptor | LRpair | Pathway | Tissue | Disease Stage |
| Page: 1 |
Top |
Single-cell gene regulatory network inference analysis |
| Find out the significant the regulons (TFs) and the target genes of each regulon across cell types for different disease states |
| TF | Cell Type | Tissue | Disease Stage | Target Gene | RSS | Regulon Activity |
| ∗The dot plots of a searched regulon are shown for all cell subpopulations in each disease state of each tissue based on the regulon specific score inferred using pySCENIC and by calculating the average expression. |
| Page: 1 |
Top |
Somatic mutation of malignant transformation related genes |
| Annotation of somatic variants for genes involved in malignant transformation |
| Hugo Symbol | Variant Class | Variant Classification | dbSNP RS | HGVSc | HGVSp | HGVSp Short | SWISSPROT | BIOTYPE | SIFT | PolyPhen | Tumor Sample Barcode | Tissue | Histology | Sex | Age | Stage | Therapy Types | Drugs | Outcome |
| ZIC1 | SNV | Missense_Mutation | c.557C>T | p.Ser186Leu | p.S186L | Q15915 | protein_coding | deleterious(0.03) | benign(0.069) | TCGA-A2-A0EY-01 | Breast | breast invasive carcinoma | Female | <65 | I/II | Chemotherapy | adriamycin | SD | |
| ZIC1 | SNV | Missense_Mutation | novel | c.963N>G | p.Ile321Met | p.I321M | Q15915 | protein_coding | deleterious(0) | probably_damaging(0.976) | TCGA-E2-A574-01 | Breast | breast invasive carcinoma | Female | <65 | I/II | Chemotherapy | adriamycin | SD |
| ZIC1 | SNV | Missense_Mutation | novel | c.1003G>A | p.Glu335Lys | p.E335K | Q15915 | protein_coding | deleterious(0.02) | benign(0.061) | TCGA-2W-A8YY-01 | Cervix | cervical & endocervical cancer | Female | <65 | I/II | Chemotherapy | cisplatin | CR |
| ZIC1 | SNV | Missense_Mutation | novel | c.1139A>G | p.His380Arg | p.H380R | Q15915 | protein_coding | deleterious(0.02) | probably_damaging(1) | TCGA-2W-A8YY-01 | Cervix | cervical & endocervical cancer | Female | <65 | I/II | Chemotherapy | cisplatin | CR |
| ZIC1 | SNV | Missense_Mutation | c.1042N>A | p.Asp348Asn | p.D348N | Q15915 | protein_coding | deleterious(0) | possibly_damaging(0.742) | TCGA-C5-A2LZ-01 | Cervix | cervical & endocervical cancer | Female | >=65 | III/IV | Unknown | Unknown | PD | |
| ZIC1 | SNV | Missense_Mutation | c.385G>A | p.Gly129Arg | p.G129R | Q15915 | protein_coding | tolerated(0.37) | benign(0.003) | TCGA-DR-A0ZL-01 | Cervix | cervical & endocervical cancer | Female | <65 | I/II | Unknown | Unknown | SD | |
| ZIC1 | SNV | Missense_Mutation | novel | c.940G>A | p.Ala314Thr | p.A314T | Q15915 | protein_coding | deleterious(0) | possibly_damaging(0.578) | TCGA-EA-A50E-01 | Cervix | cervical & endocervical cancer | Female | <65 | I/II | Unknown | Unknown | PD |
| ZIC1 | SNV | Missense_Mutation | c.1196N>T | p.Ser399Phe | p.S399F | Q15915 | protein_coding | deleterious(0) | probably_damaging(0.962) | TCGA-FU-A3HY-01 | Cervix | cervical & endocervical cancer | Female | <65 | I/II | Chemotherapy | cisplatin | CR | |
| ZIC1 | SNV | Missense_Mutation | c.706N>A | p.Ala236Thr | p.A236T | Q15915 | protein_coding | tolerated(0.18) | benign(0.003) | TCGA-AA-A00N-01 | Colorectum | colon adenocarcinoma | Male | >=65 | I/II | Unknown | Unknown | PD | |
| ZIC1 | SNV | Missense_Mutation | c.971G>T | p.Arg324Met | p.R324M | Q15915 | protein_coding | deleterious(0) | probably_damaging(0.995) | TCGA-AA-A010-01 | Colorectum | colon adenocarcinoma | Female | <65 | I/II | Chemotherapy | folinic | CR |
| Page: 1 2 3 4 5 6 7 8 9 10 11 12 13 14 |
Top |
Related drugs of malignant transformation related genes |
| Identification of chemicals and drugs interact with genes involved in malignant transfromation |
| (DGIdb 4.0) |
| Entrez ID | Symbol | Category | Interaction Types | Drug Claim Name | Drug Name | PMIDs |
| Page: 1 |

Copyright 2023-Present -The University of Texas Health Science Center at Houston |