
|
|||||
|
 | |
| |
| |
| |
| |
| |
|
Gene: ZHX3 |
Gene summary for ZHX3 |
| Gene information | Species | Human | Gene symbol | ZHX3 | Gene ID | 23051 |
| Gene name | zinc fingers and homeoboxes 3 | |
| Gene Alias | TIX1 | |
| Cytomap | 20q12 | |
| Gene Type | protein-coding | GO ID | GO:0001503 | UniProtAcc | Q9H4I2 |
Top |
Malignant transformation analysis |
| Identification of the aberrant gene expression in precancerous and cancerous lesions by comparing the gene expression of stem-like cells in diseased tissues with normal stem cells |
| Entrez ID | Symbol | Replicates | Species | Organ | Tissue | Adj P-value | Log2FC | Malignancy |
| 23051 | ZHX3 | NAFLD1 | Human | Liver | NAFLD | 4.83e-12 | 1.05e+00 | -0.04 |
| 23051 | ZHX3 | HCC1_Meng | Human | Liver | HCC | 1.64e-36 | -1.06e-01 | 0.0246 |
| 23051 | ZHX3 | HCC2_Meng | Human | Liver | HCC | 6.44e-05 | -1.44e-01 | 0.0107 |
| 23051 | ZHX3 | HCC1 | Human | Liver | HCC | 1.29e-05 | 1.93e+00 | 0.5336 |
| 23051 | ZHX3 | HCC2 | Human | Liver | HCC | 1.52e-14 | 2.53e+00 | 0.5341 |
| 23051 | ZHX3 | HCC5 | Human | Liver | HCC | 1.49e-17 | 1.69e+00 | 0.4932 |
| 23051 | ZHX3 | Pt13.a | Human | Liver | HCC | 1.14e-03 | -1.83e-01 | 0.021 |
| 23051 | ZHX3 | Pt14.d | Human | Liver | HCC | 2.02e-03 | -1.71e-01 | 0.0143 |
| 23051 | ZHX3 | RNA-P25T1-P25T1-1 | Human | Lung | AIS | 1.22e-06 | 3.72e-01 | -0.2116 |
| 23051 | ZHX3 | RNA-P25T1-P25T1-4 | Human | Lung | AIS | 2.03e-08 | 5.80e-01 | -0.2119 |
| 23051 | ZHX3 | RNA-P6T2-P6T2-1 | Human | Lung | IAC | 2.72e-05 | 3.20e-01 | -0.0166 |
| 23051 | ZHX3 | RNA-P6T2-P6T2-2 | Human | Lung | IAC | 1.74e-06 | 2.76e-01 | -0.0132 |
| 23051 | ZHX3 | RNA-P6T2-P6T2-3 | Human | Lung | IAC | 1.68e-06 | 2.59e-01 | -0.013 |
| 23051 | ZHX3 | RNA-P6T2-P6T2-4 | Human | Lung | IAC | 3.51e-06 | 3.10e-01 | -0.0121 |
| 23051 | ZHX3 | RNA-P7T1-P7T1-1 | Human | Lung | AIS | 1.48e-04 | 5.17e-01 | -0.0961 |
| 23051 | ZHX3 | RNA-P7T1-P7T1-2 | Human | Lung | AIS | 6.55e-04 | 4.50e-01 | -0.0876 |
| 23051 | ZHX3 | HTA12-23-1 | Human | Pancreas | PDAC | 7.76e-05 | 5.79e-01 | 0.3405 |
| 23051 | ZHX3 | HTA12-26-1 | Human | Pancreas | PDAC | 5.33e-06 | 4.65e-01 | 0.3728 |
| 23051 | ZHX3 | HTA12-29-1 | Human | Pancreas | PDAC | 1.47e-33 | 7.11e-01 | 0.3722 |
| 23051 | ZHX3 | HTA12-9-2 | Human | Pancreas | PDAC | 2.02e-02 | 3.21e-01 | 0.0835 |
| Page: 1 2 |
| Tissue | Expression Dynamics | Abbreviation |
| Liver | 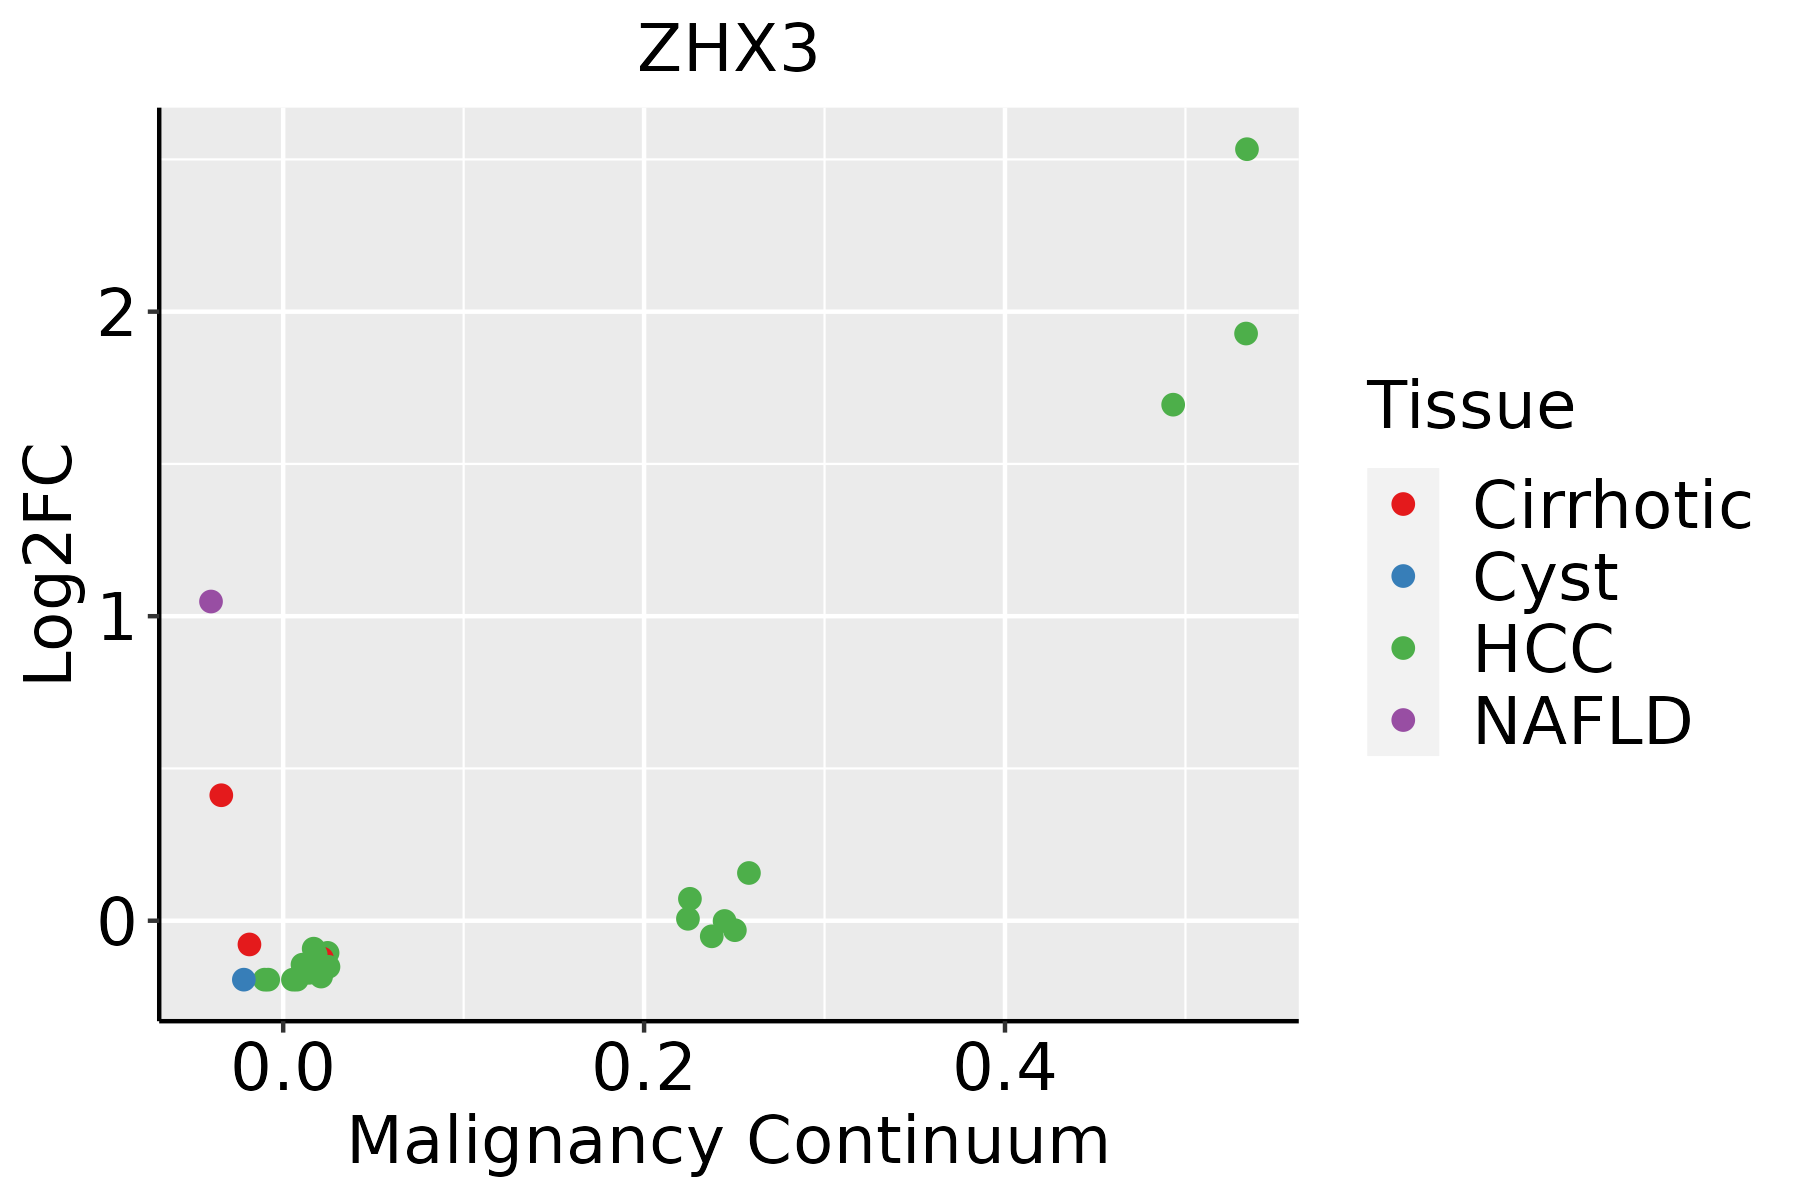 | HCC: Hepatocellular carcinoma |
| NAFLD: Non-alcoholic fatty liver disease | ||
| Lung | 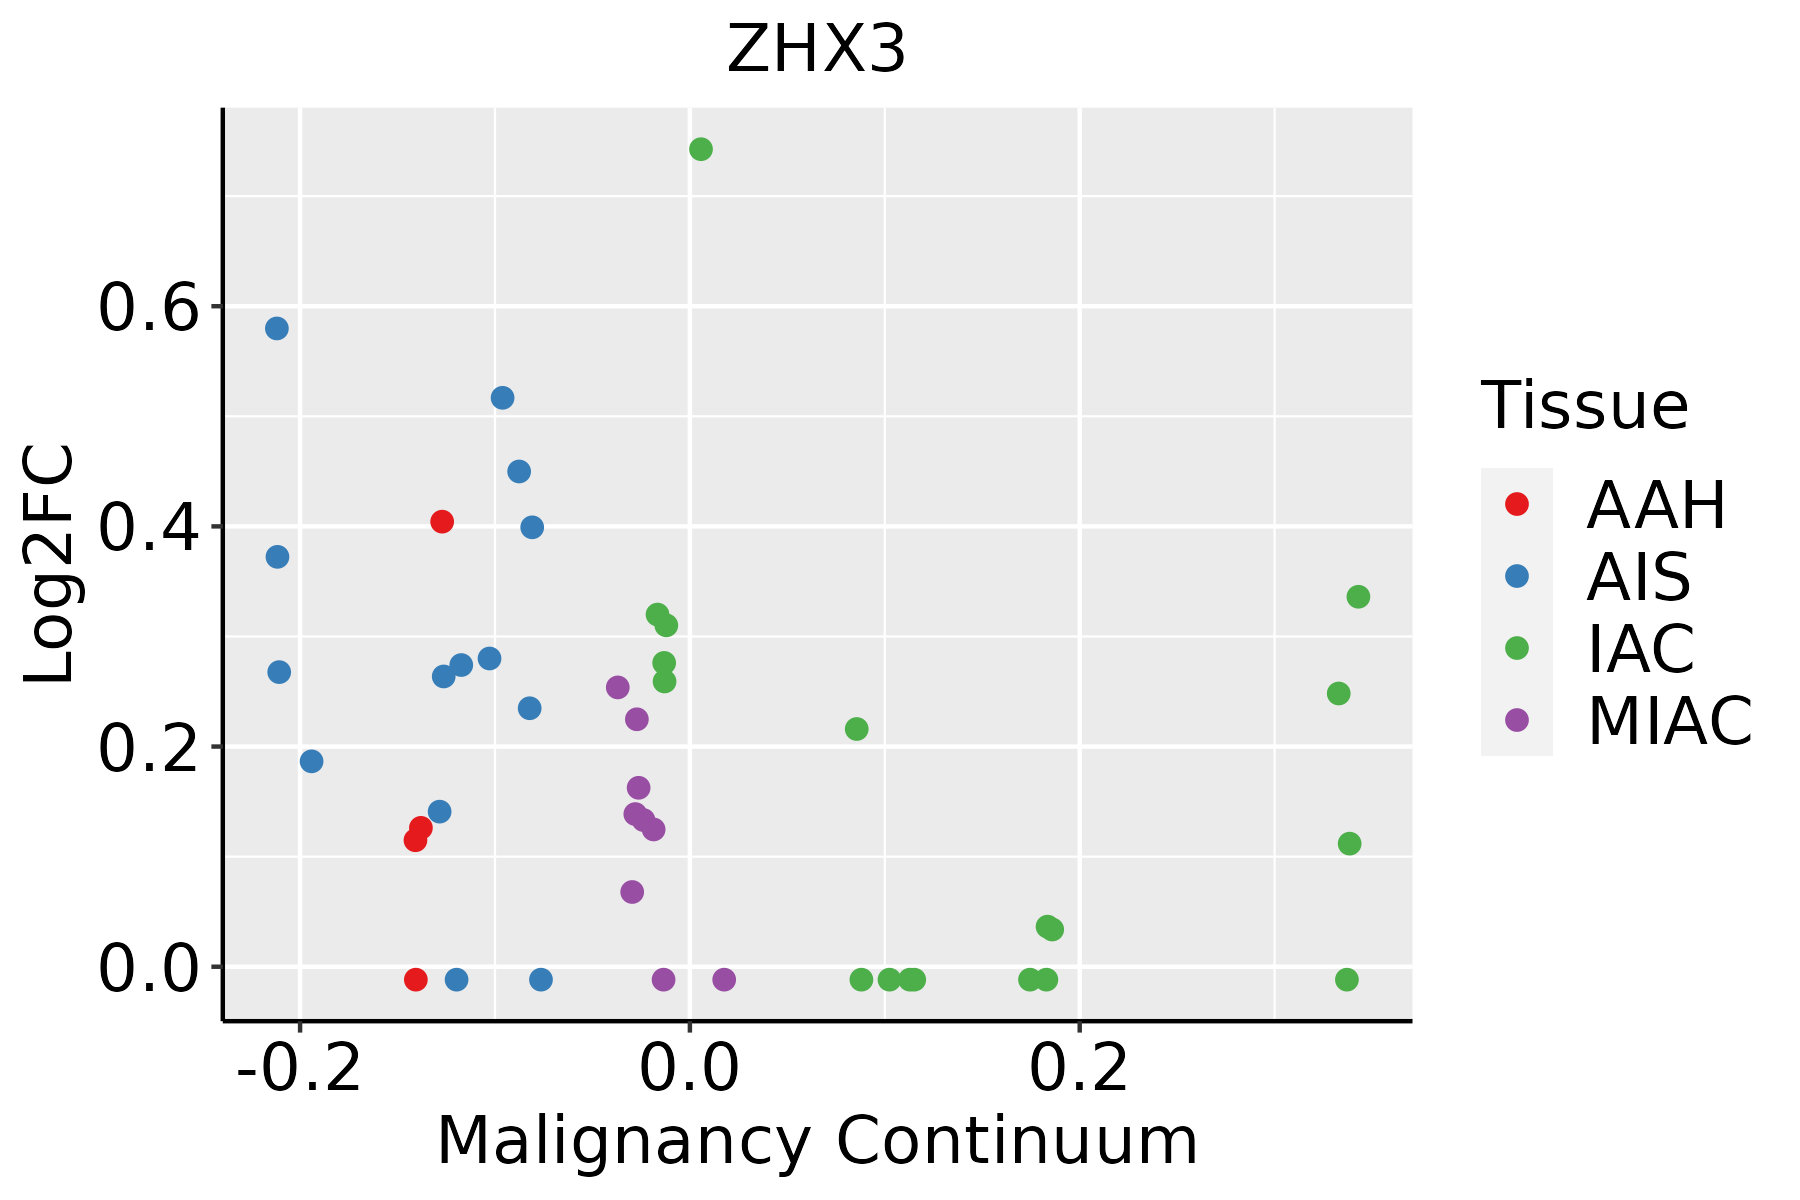 | AAH: Atypical adenomatous hyperplasia |
| AIS: Adenocarcinoma in situ | ||
| IAC: Invasive lung adenocarcinoma | ||
| MIA: Minimally invasive adenocarcinoma | ||
| Thyroid | 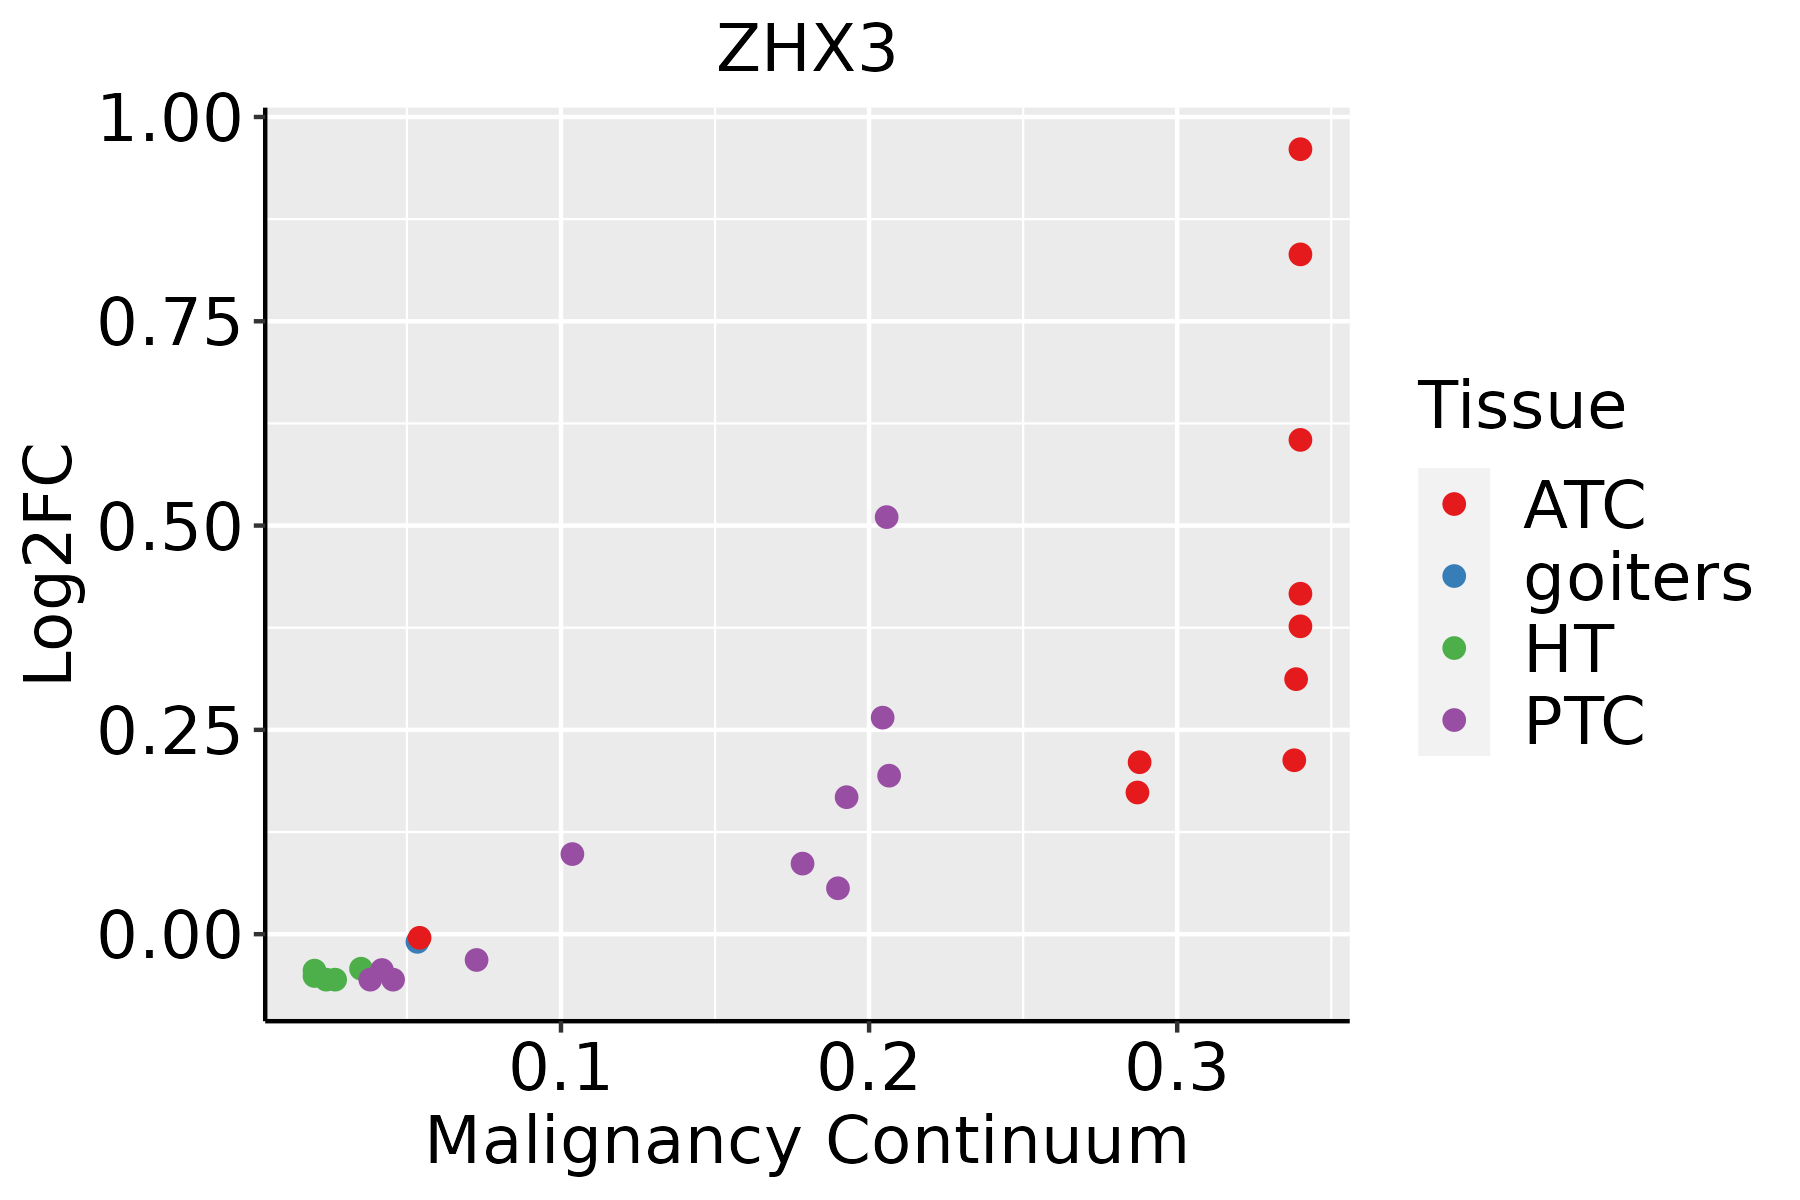 | ATC: Anaplastic thyroid cancer |
| HT: Hashimoto's thyroiditis | ||
| PTC: Papillary thyroid cancer |
| ∗log2FC in expression of this searched gene in stem-like cells from each diseased tissue sample relative to stem-like cells in normal samples in each tissue plotted against the malignancy continuum. Samples are colored based on if they are from different disease stage. |
Top |
Malignant transformation related pathway analysis |
| Find out the enriched GO biological processes and KEGG pathways involved in transition from healthy to precancer to cancer |
| Tissue | Disease Stage | Enriched GO biological Processes |
| Colorectum | AD |  |
| Colorectum | SER |  |
| Colorectum | MSS |  |
| Colorectum | MSI-H |  |
| Colorectum | FAP |  |
| ∗Top 15 enriched GO BP terms are showed in the bar plot of each disease state in each tissue. Each row represents a significant GO biological process which is colored according to the -log10(p.adjust). |
| Page: 1 2 3 4 5 6 7 8 9 |
| GO ID | Tissue | Disease Stage | Description | Gene Ratio | Bg Ratio | pvalue | p.adjust | Count |
| GO:000164911 | Liver | HCC | osteoblast differentiation | 115/7958 | 229/18723 | 1.08e-02 | 3.99e-02 | 115 |
| GO:0001503110 | Thyroid | PTC | ossification | 176/5968 | 408/18723 | 9.26e-07 | 1.40e-05 | 176 |
| GO:0001649111 | Thyroid | PTC | osteoblast differentiation | 102/5968 | 229/18723 | 3.66e-05 | 3.40e-04 | 102 |
| GO:00456697 | Thyroid | PTC | positive regulation of osteoblast differentiation | 32/5968 | 69/18723 | 8.16e-03 | 3.44e-02 | 32 |
| GO:000150332 | Thyroid | ATC | ossification | 206/6293 | 408/18723 | 9.23e-13 | 3.95e-11 | 206 |
| GO:000164932 | Thyroid | ATC | osteoblast differentiation | 122/6293 | 229/18723 | 6.04e-10 | 1.60e-08 | 122 |
| GO:004566721 | Thyroid | ATC | regulation of osteoblast differentiation | 66/6293 | 132/18723 | 7.03e-05 | 5.36e-04 | 66 |
| GO:004566912 | Thyroid | ATC | positive regulation of osteoblast differentiation | 38/6293 | 69/18723 | 1.97e-04 | 1.31e-03 | 38 |
| Page: 1 |
| Pathway ID | Tissue | Disease Stage | Description | Gene Ratio | Bg Ratio | pvalue | p.adjust | qvalue | Count |
| Page: 1 |
Top |
Cell-cell communication analysis |
| Identification of potential cell-cell interactions between two cell types and their ligand-receptor pairs for different disease states |
| Ligand | Receptor | LRpair | Pathway | Tissue | Disease Stage |
| Page: 1 |
Top |
Single-cell gene regulatory network inference analysis |
| Find out the significant the regulons (TFs) and the target genes of each regulon across cell types for different disease states |
| TF | Cell Type | Tissue | Disease Stage | Target Gene | RSS | Regulon Activity |
| ZHX3 | INCAF | Breast | ADJ | FN1,COL11A1,POSTN, etc. | 2.45e-02 |  |
| ZHX3 | INCAF | Breast | IDC | FN1,COL11A1,POSTN, etc. | 5.09e-01 |  |
| ZHX3 | INCAF | Breast | Precancer | FN1,COL11A1,POSTN, etc. | 1.35e-01 |  |
| ZHX3 | ECM | Breast | Precancer | FN1,COL11A1,POSTN, etc. | 6.46e-02 | |
| ∗The dot plots of a searched regulon are shown for all cell subpopulations in each disease state of each tissue based on the regulon specific score inferred using pySCENIC and by calculating the average expression. |
| Page: 1 |
Top |
Somatic mutation of malignant transformation related genes |
| Annotation of somatic variants for genes involved in malignant transformation |
| Hugo Symbol | Variant Class | Variant Classification | dbSNP RS | HGVSc | HGVSp | HGVSp Short | SWISSPROT | BIOTYPE | SIFT | PolyPhen | Tumor Sample Barcode | Tissue | Histology | Sex | Age | Stage | Therapy Types | Drugs | Outcome |
| ZHX3 | SNV | Missense_Mutation | rs386352383 | c.496N>T | p.Gly166Cys | p.G166C | Q9H4I2 | protein_coding | deleterious(0.01) | possibly_damaging(0.469) | TCGA-AN-A0AS-01 | Breast | breast invasive carcinoma | Female | >=65 | III/IV | Unknown | Unknown | SD |
| ZHX3 | SNV | Missense_Mutation | c.635N>A | p.Gly212Asp | p.G212D | Q9H4I2 | protein_coding | deleterious(0.03) | benign(0.081) | TCGA-BH-A0HF-01 | Breast | breast invasive carcinoma | Female | >=65 | I/II | Hormone Therapy | arimidex | SD | |
| ZHX3 | SNV | Missense_Mutation | c.2146N>G | p.Ile716Val | p.I716V | Q9H4I2 | protein_coding | tolerated(0.33) | benign(0) | TCGA-D8-A1JP-01 | Breast | breast invasive carcinoma | Female | >=65 | I/II | Hormone Therapy | tamoxiphen | SD | |
| ZHX3 | SNV | Missense_Mutation | rs751395106 | c.1114C>T | p.Arg372Trp | p.R372W | Q9H4I2 | protein_coding | deleterious(0) | probably_damaging(1) | TCGA-E2-A14Q-01 | Breast | breast invasive carcinoma | Female | <65 | I/II | Hormone Therapy | tamoxiphen | SD |
| ZHX3 | insertion | Frame_Shift_Ins | novel | c.827_828insCAGGGGCCATGGCTATCCT | p.Gln276HisfsTer47 | p.Q276Hfs*47 | Q9H4I2 | protein_coding | TCGA-A2-A0EQ-01 | Breast | breast invasive carcinoma | Female | <65 | I/II | Chemotherapy | adriamycin | SD | ||
| ZHX3 | insertion | Nonsense_Mutation | novel | c.965_966insACAAAAGTGACGGGCCTCAGTACCAGAGAGGTGCGGAAAT | p.Phe323GlnfsTer3 | p.F323Qfs*3 | Q9H4I2 | protein_coding | TCGA-A7-A0CJ-01 | Breast | breast invasive carcinoma | Female | <65 | I/II | Chemotherapy | cytoxan | SD | ||
| ZHX3 | insertion | Nonsense_Mutation | novel | c.2182_2183insGGACTATTACATGACACACAAGATGCTGTATGAAGAGG | p.Asn728ArgfsTer5 | p.N728Rfs*5 | Q9H4I2 | protein_coding | TCGA-A8-A097-01 | Breast | breast invasive carcinoma | Female | >=65 | I/II | Hormone Therapy | tamoxiphen | SD | ||
| ZHX3 | insertion | Frame_Shift_Ins | novel | c.640_641insTAGAAGAAATGTTTAGTATAATGGAAAAT | p.Ala214ValfsTer22 | p.A214Vfs*22 | Q9H4I2 | protein_coding | TCGA-A8-A09X-01 | Breast | breast invasive carcinoma | Female | <65 | III/IV | Unknown | Unknown | SD | ||
| ZHX3 | insertion | Frame_Shift_Ins | novel | c.1517_1518insATCAATTTCTC | p.Ala508IlefsTer6 | p.A508Ifs*6 | Q9H4I2 | protein_coding | TCGA-AR-A0TU-01 | Breast | breast invasive carcinoma | Female | <65 | I/II | Unspecific | Doxorubicin | SD | ||
| ZHX3 | insertion | Frame_Shift_Ins | novel | c.1027_1028insGGAG | p.Tyr343TrpfsTer25 | p.Y343Wfs*25 | Q9H4I2 | protein_coding | TCGA-B6-A0RE-01 | Breast | breast invasive carcinoma | Female | <65 | I/II | Unknown | Unknown | SD |
| Page: 1 2 3 4 5 6 7 8 9 10 11 |
Top |
Related drugs of malignant transformation related genes |
| Identification of chemicals and drugs interact with genes involved in malignant transfromation |
| (DGIdb 4.0) |
| Entrez ID | Symbol | Category | Interaction Types | Drug Claim Name | Drug Name | PMIDs |
| Page: 1 |

Copyright 2023-Present -The University of Texas Health Science Center at Houston |