Schematic overview of the cellular and molecular mechanisms involved in the cancer progression, including the proposed cellular and molecular mechanisms in cancer cells trajectory. AT1: alveolar type 1 cells; AT2: alveolar type 2 cells; AAH: atypical adenomatous hyperplasia; AIS: adenocarcinoma in situ; MIA: minimally invasive adenocarcinoma; IA: invasive adenocarcinoma; EMT: epithelial-mesenchymal transition

Home

Download

Statistics

Help

Contact

Center for Computational Systems Medicine
leaf

Gene summary

leaf

Malignant transformation analysis

leaf

Malignant transformation related pathway analysis

leaf

Cell-cell communication analysis

leaf

Single-cell gene regulatory network inference analysis

leaf

Somatic mutation of malignant transformation related genes

leaf

Related drugs of malignant transformation related genes

Gene: ZHX2

Gene summary for ZHX2

check button Gene summary.

Gene informationSpeciesHuman
Gene symbol

ZHX2

Gene ID

22882

Gene namezinc fingers and homeoboxes 2
Gene AliasAFR1
Cytomap8q24.13
Gene Typeprotein-coding
GO ID

GO:0000122

UniProtAcc

Q9Y6X8


Top

Malignant transformation analysis

check button Identification of the aberrant gene expression in precancerous and cancerous lesions by comparing the gene expression of stem-like cells in diseased tissues with normal stem cells
check button Malignant transformation involving gene list.
Entrez IDSymbolReplicatesSpeciesOrganTissueAdj P-valueLog2FCMalignancy
22882ZHX2CCI_1HumanCervixCC7.07e-077.57e-010.528
22882ZHX2CCI_2HumanCervixCC5.95e-191.38e+000.5249
22882ZHX2CCI_3HumanCervixCC4.58e-138.37e-010.516
22882ZHX2AEH-subject1HumanEndometriumAEH5.11e-164.65e-01-0.3059
22882ZHX2AEH-subject2HumanEndometriumAEH1.82e-052.90e-01-0.2525
22882ZHX2AEH-subject3HumanEndometriumAEH3.06e-093.96e-01-0.2576
22882ZHX2AEH-subject4HumanEndometriumAEH2.08e-206.16e-01-0.2657
22882ZHX2AEH-subject5HumanEndometriumAEH4.16e-184.93e-01-0.2953
22882ZHX2EEC-subject1HumanEndometriumEEC2.58e-166.02e-01-0.2682
22882ZHX2EEC-subject2HumanEndometriumEEC1.11e-093.67e-01-0.2607
22882ZHX2EEC-subject4HumanEndometriumEEC3.28e-124.20e-01-0.2571
22882ZHX2EEC-subject5HumanEndometriumEEC6.95e-042.48e-01-0.249
22882ZHX2LZE24THumanEsophagusESCC2.07e-102.74e-010.0596
22882ZHX2P1T-EHumanEsophagusESCC8.22e-052.05e-010.0875
22882ZHX2P2T-EHumanEsophagusESCC1.57e-048.03e-020.1177
22882ZHX2P4T-EHumanEsophagusESCC4.54e-071.73e-010.1323
22882ZHX2P8T-EHumanEsophagusESCC2.26e-061.56e-010.0889
22882ZHX2P9T-EHumanEsophagusESCC1.54e-102.04e-010.1131
22882ZHX2P10T-EHumanEsophagusESCC8.34e-132.28e-010.116
22882ZHX2P11T-EHumanEsophagusESCC2.60e-021.26e-010.1426
Page: 1 2 3 4 5 

check button Transcriptomic changes along malignancy continuum.
TissueExpression DynamicsAbbreviation
CervixThe image shows the transcriptomic changes along malignancy continuum.log2FC in expression of this searched gene in stem-like cells from each diseased tissue sample relative to stem-like cells in normal samples in each tissue plotted against the malignancy continuum. Samples are colored based on if they are from different disease stage.CC: Cervix cancer
HSIL_HPV: HPV-infected high-grade squamous intraepithelial lesions
N_HPV: HPV-infected normal cervix
EndometriumThe image shows the transcriptomic changes along malignancy continuum.log2FC in expression of this searched gene in stem-like cells from each diseased tissue sample relative to stem-like cells in normal samples in each tissue plotted against the malignancy continuum. Samples are colored based on if they are from different disease stage.
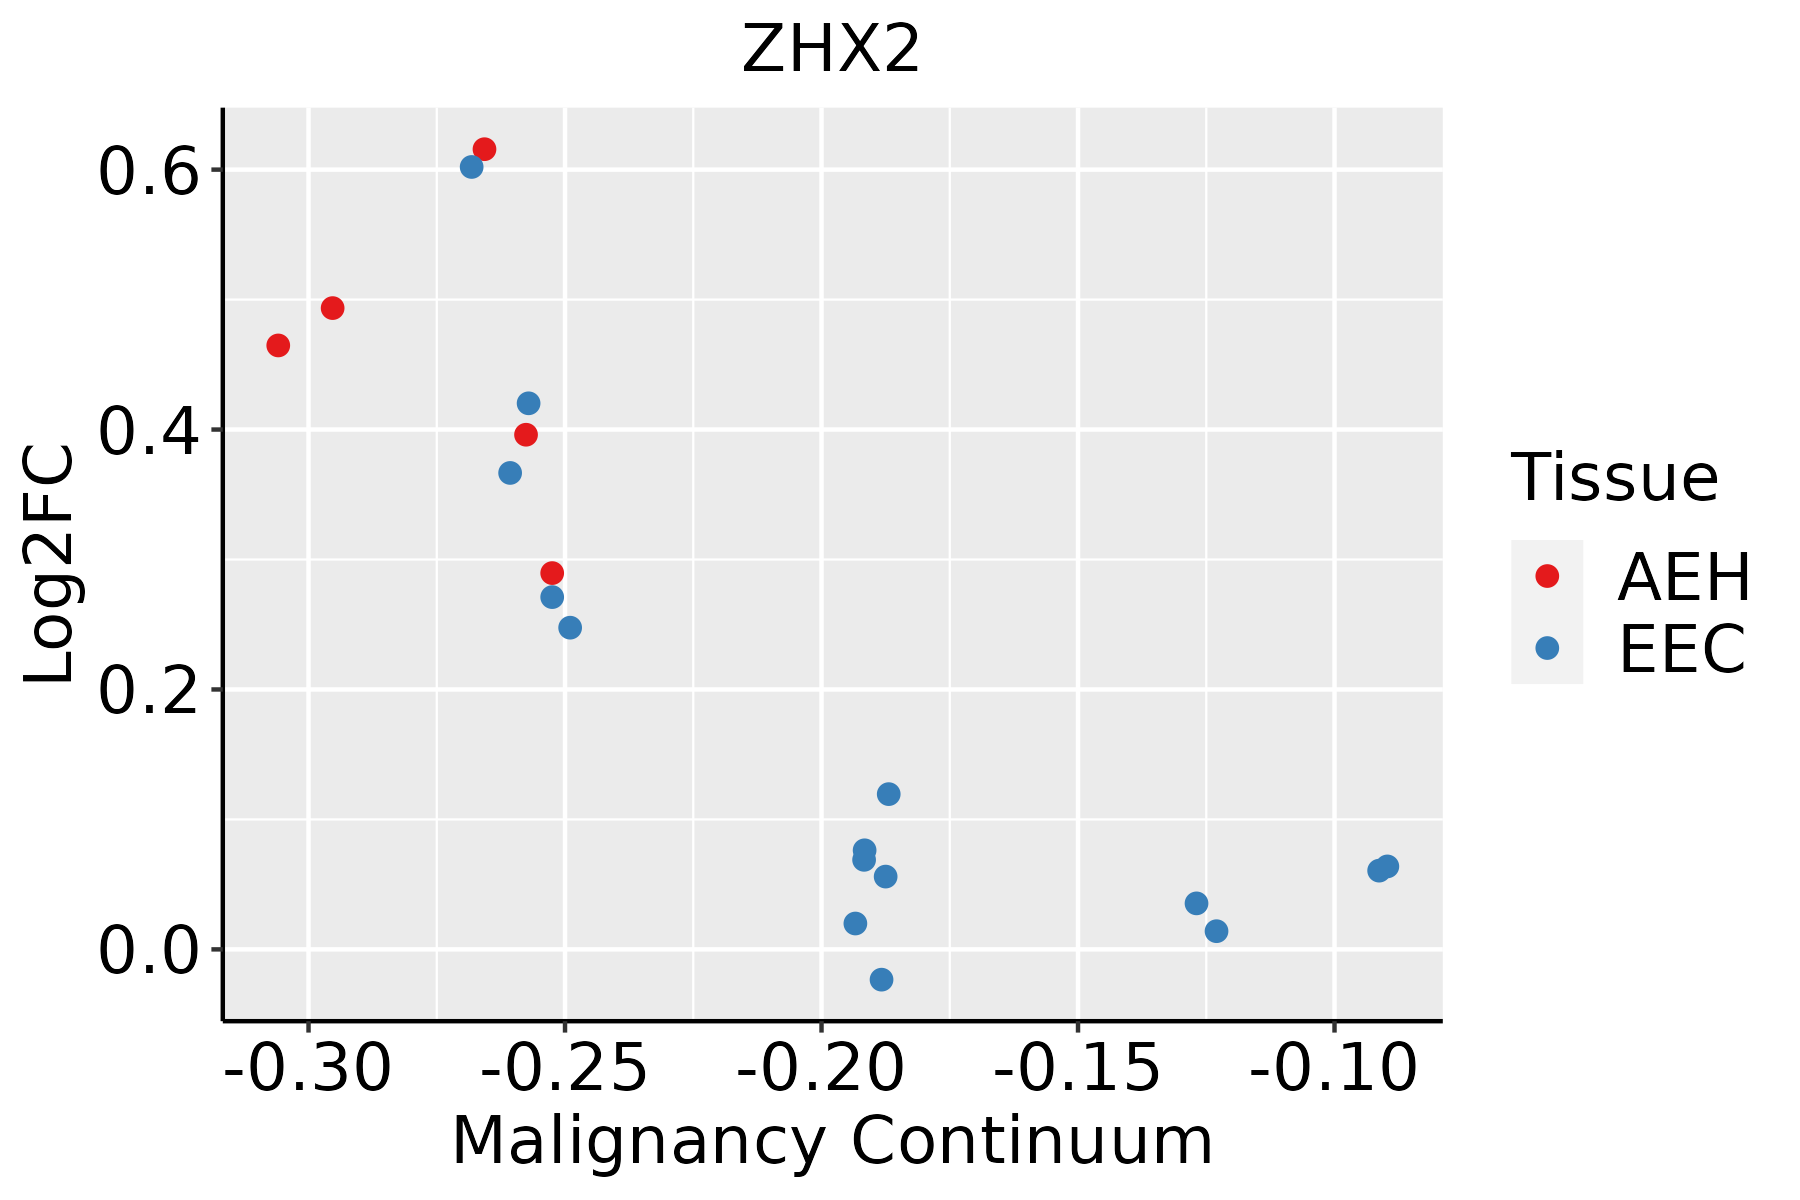
AEH: Atypical endometrial hyperplasia
EEC: Endometrioid Cancer
EsophagusThe image shows the transcriptomic changes along malignancy continuum.log2FC in expression of this searched gene in stem-like cells from each diseased tissue sample relative to stem-like cells in normal samples in each tissue plotted against the malignancy continuum. Samples are colored based on if they are from different disease stage.ESCC: Esophageal squamous cell carcinoma
HGIN: High-grade intraepithelial neoplasias
LGIN: Low-grade intraepithelial neoplasias
LiverThe image shows the transcriptomic changes along malignancy continuum.log2FC in expression of this searched gene in stem-like cells from each diseased tissue sample relative to stem-like cells in normal samples in each tissue plotted against the malignancy continuum. Samples are colored based on if they are from different disease stage.
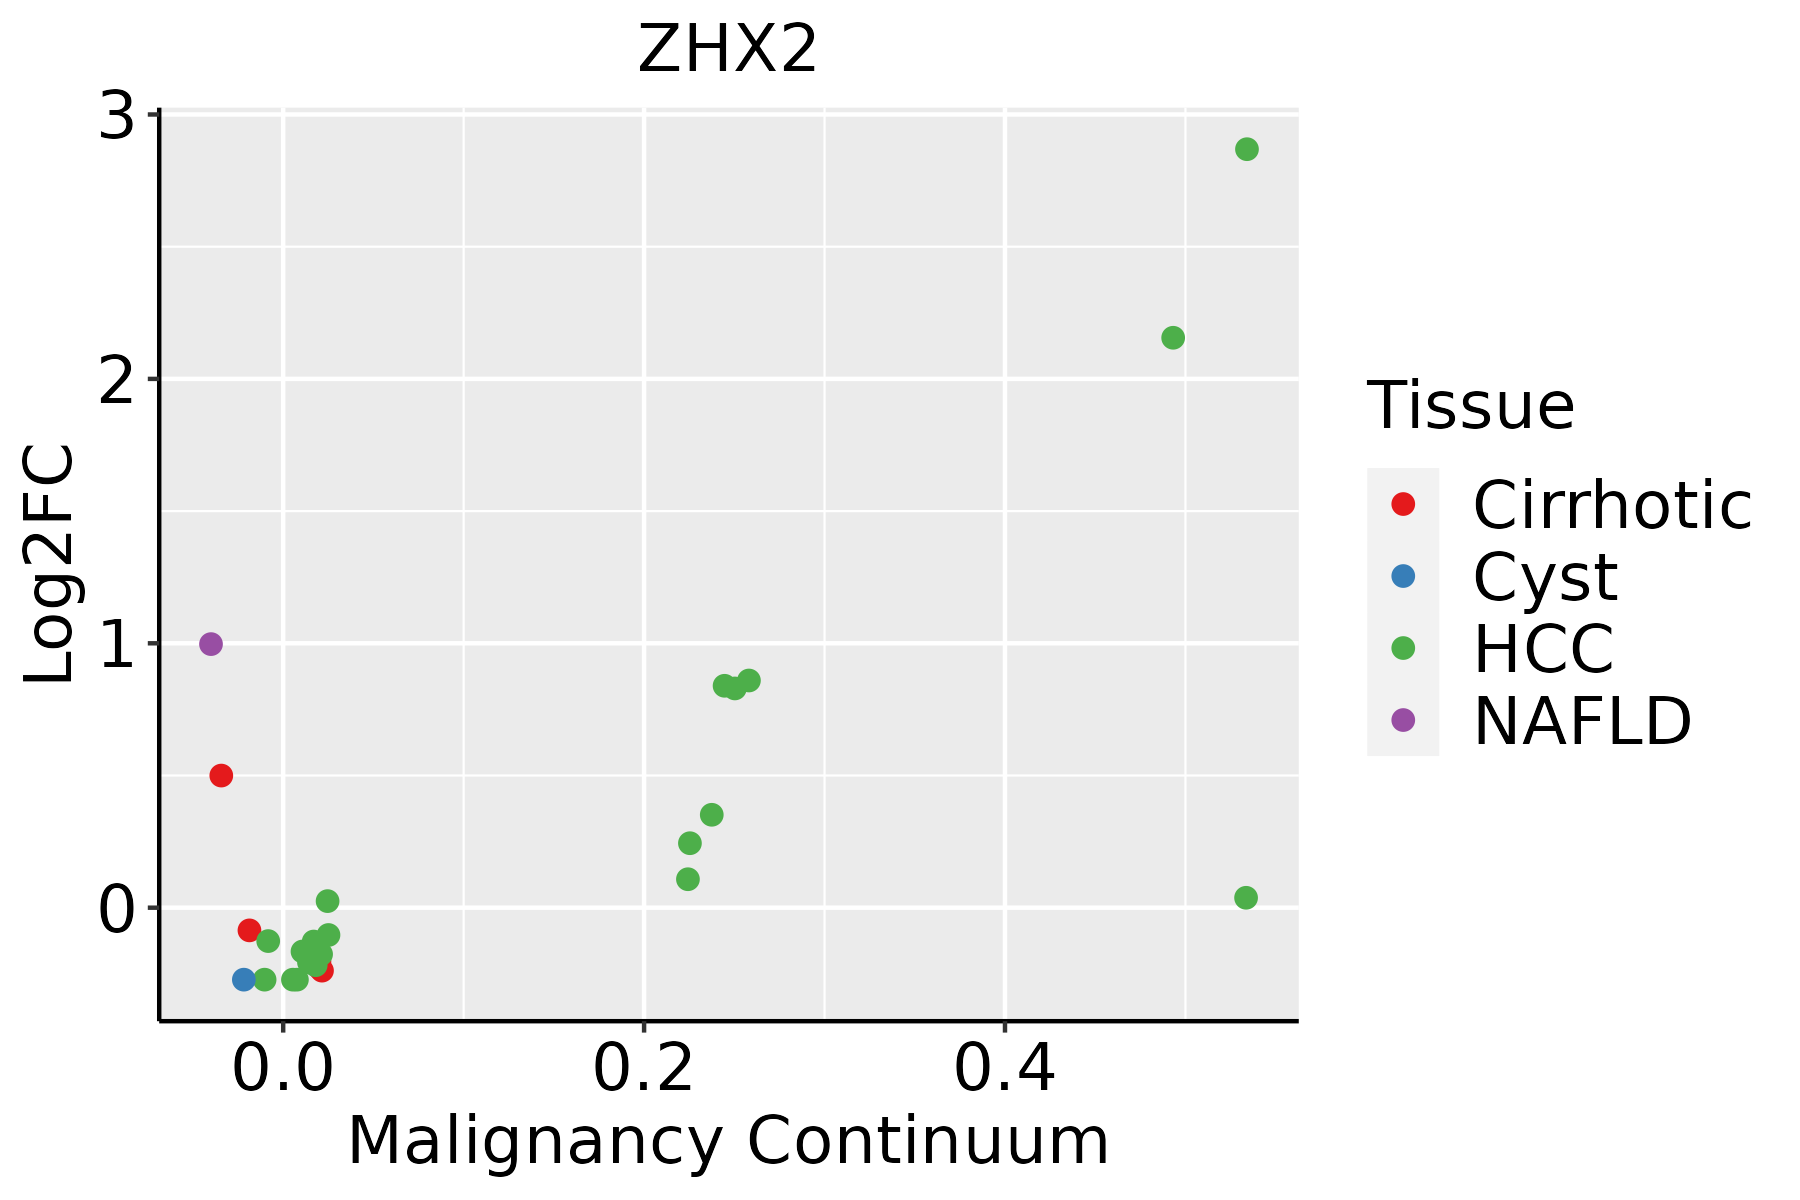
HCC: Hepatocellular carcinoma
NAFLD: Non-alcoholic fatty liver disease
LungThe image shows the transcriptomic changes along malignancy continuum.log2FC in expression of this searched gene in stem-like cells from each diseased tissue sample relative to stem-like cells in normal samples in each tissue plotted against the malignancy continuum. Samples are colored based on if they are from different disease stage.AAH: Atypical adenomatous hyperplasia
AIS: Adenocarcinoma in situ
IAC: Invasive lung adenocarcinoma
MIA: Minimally invasive adenocarcinoma
Oral CavityThe image shows the transcriptomic changes along malignancy continuum.log2FC in expression of this searched gene in stem-like cells from each diseased tissue sample relative to stem-like cells in normal samples in each tissue plotted against the malignancy continuum. Samples are colored based on if they are from different disease stage.
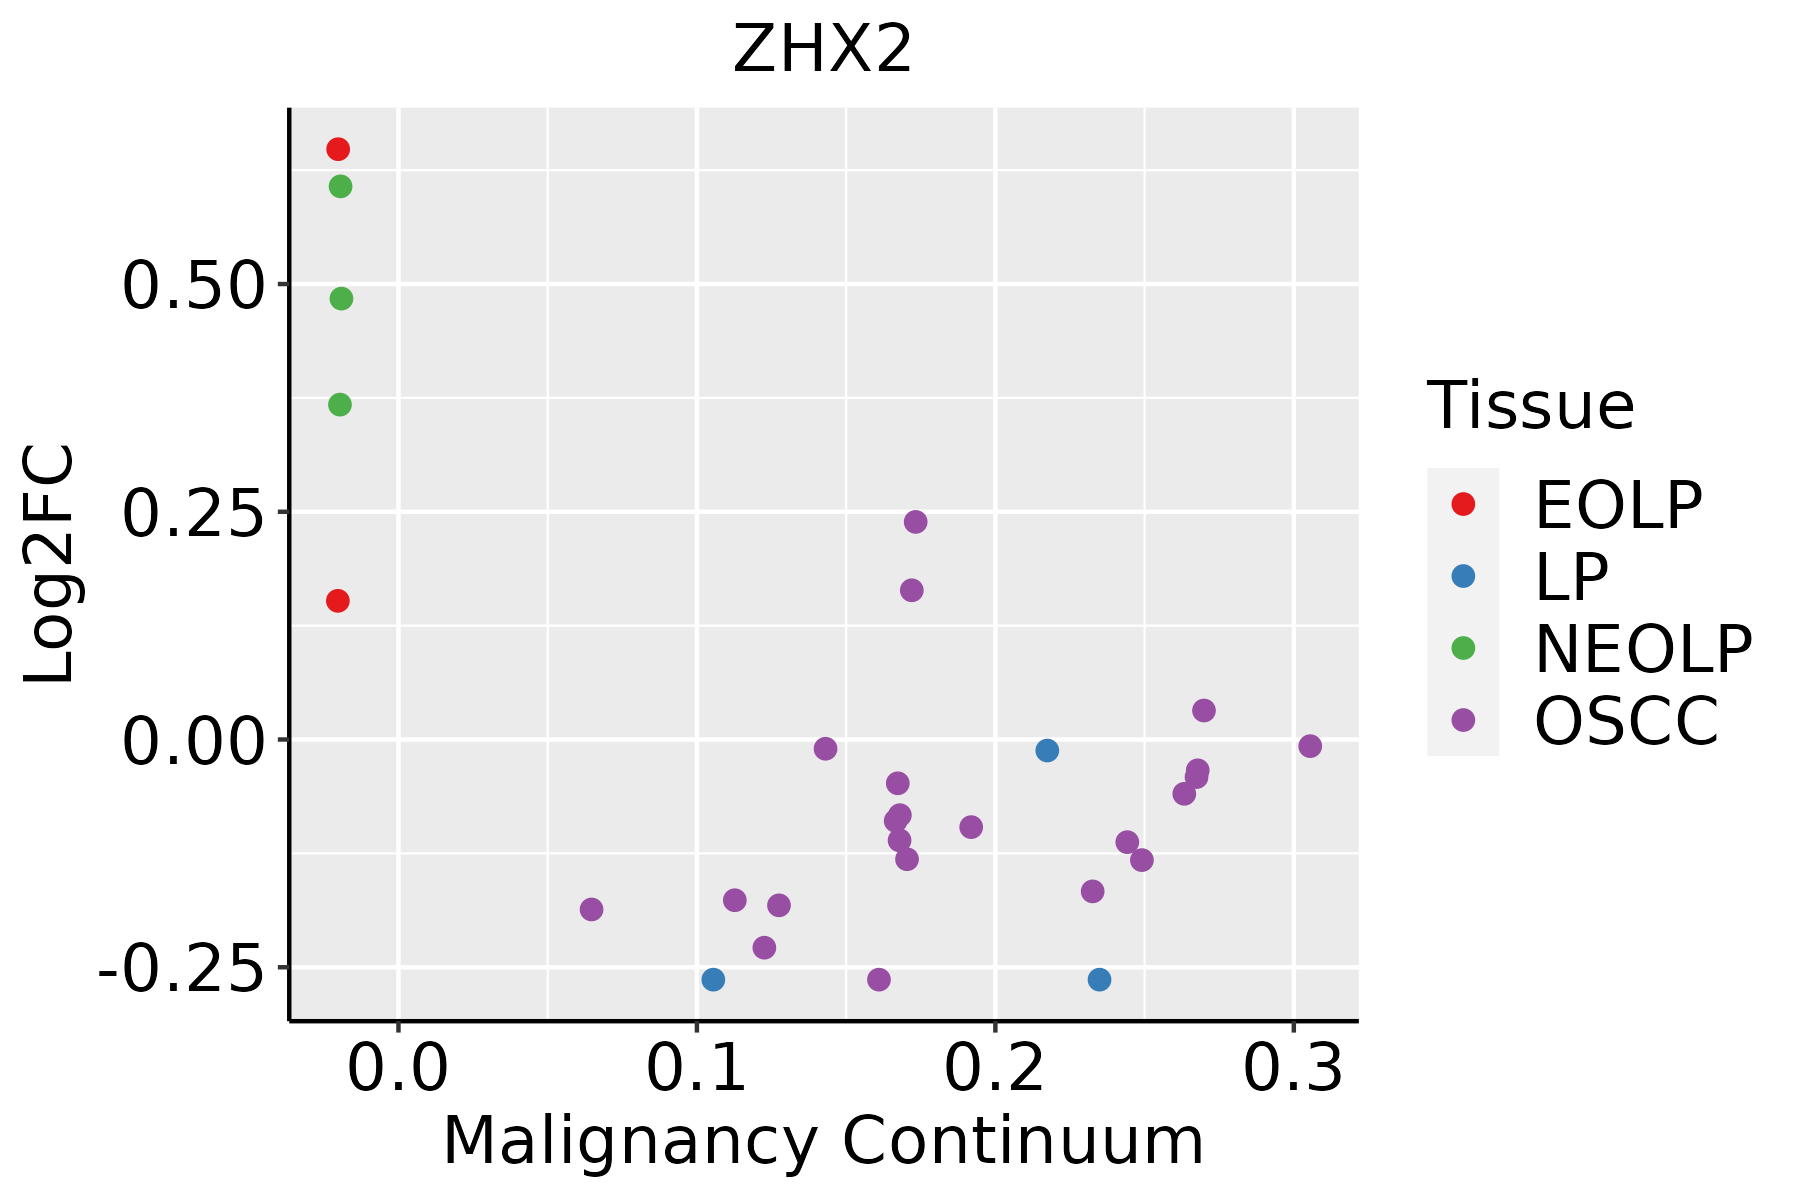
EOLP: Erosive Oral lichen planus
LP: leukoplakia
NEOLP: Non-erosive oral lichen planus
OSCC: Oral squamous cell carcinoma
ProstateThe image shows the transcriptomic changes along malignancy continuum.log2FC in expression of this searched gene in stem-like cells from each diseased tissue sample relative to stem-like cells in normal samples in each tissue plotted against the malignancy continuum. Samples are colored based on if they are from different disease stage.BPH: Benign Prostatic Hyperplasia
∗log2FC in expression of this searched gene in stem-like cells from each diseased tissue sample relative to stem-like cells in normal samples in each tissue plotted against the malignancy continuum. Samples are colored based on if they are from different disease stage.

Top

Malignant transformation related pathway analysis

check buttonFind out the enriched GO biological processes and KEGG pathways involved in transition from healthy to precancer to cancer
check button Figure of enriched GO biological processes.
TissueDisease StageEnriched GO biological Processes
ColorectumADGO analysis - Figure of enriched GO biological processes: Top 15 enriched GO BP terms are showed in the bar plot of each disease state in each tissue. Each row represents a significant GO biological process which is colored according to the -log10(p.adjust).
ColorectumSERGO analysis - Figure of enriched GO biological processes: Top 15 enriched GO BP terms are showed in the bar plot of each disease state in each tissue. Each row represents a significant GO biological process which is colored according to the -log10(p.adjust).
ColorectumMSSGO analysis - Figure of enriched GO biological processes: Top 15 enriched GO BP terms are showed in the bar plot of each disease state in each tissue. Each row represents a significant GO biological process which is colored according to the -log10(p.adjust).
ColorectumMSI-HGO analysis - Figure of enriched GO biological processes: Top 15 enriched GO BP terms are showed in the bar plot of each disease state in each tissue. Each row represents a significant GO biological process which is colored according to the -log10(p.adjust).
ColorectumFAPGO analysis - Figure of enriched GO biological processes: Top 15 enriched GO BP terms are showed in the bar plot of each disease state in each tissue. Each row represents a significant GO biological process which is colored according to the -log10(p.adjust).
∗Top 15 enriched GO BP terms are showed in the bar plot of each disease state in each tissue. Each row represents a significant GO biological process which is colored according to the -log10(p.adjust).
Page: 1 2 3 4 5 6 7 8 9 

check button Enriched GO biological processes.
GO IDTissueDisease StageDescriptionGene RatioBg Ratiopvaluep.adjustCount
GO:00064029CervixCCmRNA catabolic process56/2311232/187234.81e-071.83e-0556
GO:00064019CervixCCRNA catabolic process62/2311278/187232.18e-066.56e-0562
GO:00467008CervixCCheterocycle catabolic process80/2311445/187233.23e-043.42e-0380
GO:00346559CervixCCnucleobase-containing compound catabolic process74/2311407/187233.77e-043.88e-0374
GO:00442709CervixCCcellular nitrogen compound catabolic process79/2311451/187237.80e-046.91e-0379
GO:00987275CervixCCmaintenance of cell number30/2311134/187237.98e-047.00e-0330
GO:00198274CervixCCstem cell population maintenance29/2311131/187231.17e-039.47e-0329
GO:00194398CervixCCaromatic compound catabolic process79/2311467/187232.14e-031.54e-0279
GO:0150063CervixCCvisual system development63/2311375/187236.58e-033.65e-0263
GO:19013618CervixCCorganic cyclic compound catabolic process80/2311495/187236.77e-033.72e-0280
GO:0001654CervixCCeye development62/2311371/187237.83e-034.13e-0262
GO:0045665CervixCCnegative regulation of neuron differentiation16/231169/187238.75e-034.48e-0216
GO:0048880CervixCCsensory system development63/2311381/187239.29e-034.66e-0263
GO:000640210EndometriumAEHmRNA catabolic process59/2100232/187239.51e-108.52e-0859
GO:000640110EndometriumAEHRNA catabolic process63/2100278/187233.28e-081.87e-0663
GO:003465510EndometriumAEHnucleobase-containing compound catabolic process74/2100407/187231.78e-053.65e-0474
GO:004427010EndometriumAEHcellular nitrogen compound catabolic process80/2100451/187232.09e-054.13e-0480
GO:00467009EndometriumAEHheterocycle catabolic process79/2100445/187232.27e-054.35e-0479
GO:00194399EndometriumAEHaromatic compound catabolic process80/2100467/187237.21e-051.10e-0380
GO:19013619EndometriumAEHorganic cyclic compound catabolic process83/2100495/187231.13e-041.60e-0383
Page: 1 2 3 4 5 6 7 

check button Enriched KEGG pathways.
Pathway IDTissueDisease StageDescriptionGene RatioBg Ratiopvaluep.adjustqvalueCount
Page: 1 

Top

Cell-cell communication analysis

check buttonIdentification of potential cell-cell interactions between two cell types and their ligand-receptor pairs for different disease states
LigandReceptorLRpairPathwayTissueDisease Stage
Page: 1 

Top

Single-cell gene regulatory network inference analysis

check buttonFind out the significant the regulons (TFs) and the target genes of each regulon across cell types for different disease states
TFCell TypeTissueDisease StageTarget GeneRSSRegulon Activity
∗The dot plots of a searched regulon are shown for all cell subpopulations in each disease state of each tissue based on the regulon specific score inferred using pySCENIC and by calculating the average expression.
Page: 1 

Top

Somatic mutation of malignant transformation related genes

check buttonAnnotation of somatic variants for genes involved in malignant transformation
Hugo SymbolVariant ClassVariant ClassificationdbSNP RSHGVScHGVSpHGVSp ShortSWISSPROTBIOTYPESIFTPolyPhenTumor Sample BarcodeTissueHistologySexAgeStageTherapy TypesDrugsOutcome
ZHX2SNVMissense_Mutationnovelc.1369A>Tp.Ser457Cysp.S457CQ9Y6X8protein_codingdeleterious(0)probably_damaging(1)TCGA-A8-A07J-01Breastbreast invasive carcinomaFemale<65I/IIChemotherapy5-fluorouracilCR
ZHX2SNVMissense_Mutationc.161C>Gp.Ser54Cysp.S54CQ9Y6X8protein_codingtolerated(0.06)benign(0.286)TCGA-A8-A092-01Breastbreast invasive carcinomaFemale<65III/IVChemotherapypaclitaxelCR
ZHX2SNVMissense_Mutationc.417C>Gp.Phe139Leup.F139LQ9Y6X8protein_codingdeleterious(0)probably_damaging(0.994)TCGA-A8-A092-01Breastbreast invasive carcinomaFemale<65III/IVChemotherapypaclitaxelCR
ZHX2SNVMissense_Mutationc.2020C>Tp.Arg674Cysp.R674CQ9Y6X8protein_codingdeleterious(0)probably_damaging(0.991)TCGA-AN-A0AK-01Breastbreast invasive carcinomaFemale>=65I/IIUnknownUnknownSD
ZHX2SNVMissense_Mutationc.2400G>Tp.Glu800Aspp.E800DQ9Y6X8protein_codingtolerated(0.4)benign(0.012)TCGA-AN-A0AK-01Breastbreast invasive carcinomaFemale>=65I/IIUnknownUnknownSD
ZHX2SNVMissense_Mutationc.1216N>Gp.Lys406Glup.K406EQ9Y6X8protein_codingtolerated(0.05)probably_damaging(0.994)TCGA-AN-A0FS-01Breastbreast invasive carcinomaFemale<65I/IIUnknownUnknownSD
ZHX2SNVMissense_Mutationc.1216A>Gp.Lys406Glup.K406EQ9Y6X8protein_codingtolerated(0.05)probably_damaging(0.994)TCGA-AR-A250-01Breastbreast invasive carcinomaFemale<65I/IIChemotherapydoxorubicinSD
ZHX2SNVMissense_Mutationc.2476N>Cp.Asp826Hisp.D826HQ9Y6X8protein_codingdeleterious_low_confidence(0)probably_damaging(0.991)TCGA-BH-A0BZ-01Breastbreast invasive carcinomaFemale<65III/IVChemotherapydoxorubicinCR
ZHX2SNVMissense_Mutationc.907N>Ap.Glu303Lysp.E303KQ9Y6X8protein_codingdeleterious(0)probably_damaging(0.996)TCGA-D8-A1JA-01Breastbreast invasive carcinomaFemale<65III/IVChemotherapyadriamycinPD
ZHX2SNVMissense_Mutationc.866A>Cp.Gln289Prop.Q289PQ9Y6X8protein_codingdeleterious(0)probably_damaging(0.996)TCGA-D8-A1JP-01Breastbreast invasive carcinomaFemale>=65I/IIHormone TherapytamoxiphenSD
Page: 1 2 3 4 5 6 7 8 9 10 11 12 13 

Top

Related drugs of malignant transformation related genes

check buttonIdentification of chemicals and drugs interact with genes involved in malignant transfromation
(DGIdb 4.0)
Entrez IDSymbolCategoryInteraction TypesDrug Claim NameDrug NamePMIDs
Page: 1