
|
|||||
|
 | |
| |
| |
| |
| |
| |
|
Gene: ZGPAT |
Gene summary for ZGPAT |
| Gene information | Species | Human | Gene symbol | ZGPAT | Gene ID | 84619 |
| Gene name | zinc finger CCCH-type and G-patch domain containing | |
| Gene Alias | GPATC6 | |
| Cytomap | 20q13.33 | |
| Gene Type | protein-coding | GO ID | GO:0000122 | UniProtAcc | A0A0S2Z5X3 |
Top |
Malignant transformation analysis |
| Identification of the aberrant gene expression in precancerous and cancerous lesions by comparing the gene expression of stem-like cells in diseased tissues with normal stem cells |
| Entrez ID | Symbol | Replicates | Species | Organ | Tissue | Adj P-value | Log2FC | Malignancy |
| 84619 | ZGPAT | LZE2T | Human | Esophagus | ESCC | 2.18e-04 | 4.66e-01 | 0.082 |
| 84619 | ZGPAT | LZE4T | Human | Esophagus | ESCC | 1.39e-13 | 3.54e-01 | 0.0811 |
| 84619 | ZGPAT | LZE7T | Human | Esophagus | ESCC | 1.16e-13 | 4.61e-01 | 0.0667 |
| 84619 | ZGPAT | LZE8T | Human | Esophagus | ESCC | 1.75e-09 | 2.76e-01 | 0.067 |
| 84619 | ZGPAT | LZE20T | Human | Esophagus | ESCC | 2.37e-09 | 2.92e-01 | 0.0662 |
| 84619 | ZGPAT | LZE22T | Human | Esophagus | ESCC | 5.52e-13 | 5.38e-01 | 0.068 |
| 84619 | ZGPAT | LZE24T | Human | Esophagus | ESCC | 2.47e-19 | 4.21e-01 | 0.0596 |
| 84619 | ZGPAT | LZE22D3 | Human | Esophagus | HGIN | 1.73e-02 | 5.15e-01 | 0.0653 |
| 84619 | ZGPAT | LZE6T | Human | Esophagus | ESCC | 2.61e-09 | 2.81e-01 | 0.0845 |
| 84619 | ZGPAT | P1T-E | Human | Esophagus | ESCC | 5.20e-08 | 3.48e-01 | 0.0875 |
| 84619 | ZGPAT | P2T-E | Human | Esophagus | ESCC | 9.74e-22 | 3.99e-01 | 0.1177 |
| 84619 | ZGPAT | P4T-E | Human | Esophagus | ESCC | 2.81e-13 | 2.92e-01 | 0.1323 |
| 84619 | ZGPAT | P5T-E | Human | Esophagus | ESCC | 1.23e-20 | 3.26e-01 | 0.1327 |
| 84619 | ZGPAT | P8T-E | Human | Esophagus | ESCC | 1.96e-05 | 1.62e-01 | 0.0889 |
| 84619 | ZGPAT | P9T-E | Human | Esophagus | ESCC | 4.72e-09 | 2.08e-01 | 0.1131 |
| 84619 | ZGPAT | P10T-E | Human | Esophagus | ESCC | 6.31e-48 | 7.40e-01 | 0.116 |
| 84619 | ZGPAT | P11T-E | Human | Esophagus | ESCC | 1.06e-12 | 4.28e-01 | 0.1426 |
| 84619 | ZGPAT | P12T-E | Human | Esophagus | ESCC | 3.19e-23 | 4.30e-01 | 0.1122 |
| 84619 | ZGPAT | P15T-E | Human | Esophagus | ESCC | 4.29e-21 | 3.81e-01 | 0.1149 |
| 84619 | ZGPAT | P16T-E | Human | Esophagus | ESCC | 8.84e-36 | 5.62e-01 | 0.1153 |
| Page: 1 2 3 4 |
| Tissue | Expression Dynamics | Abbreviation |
| Esophagus | 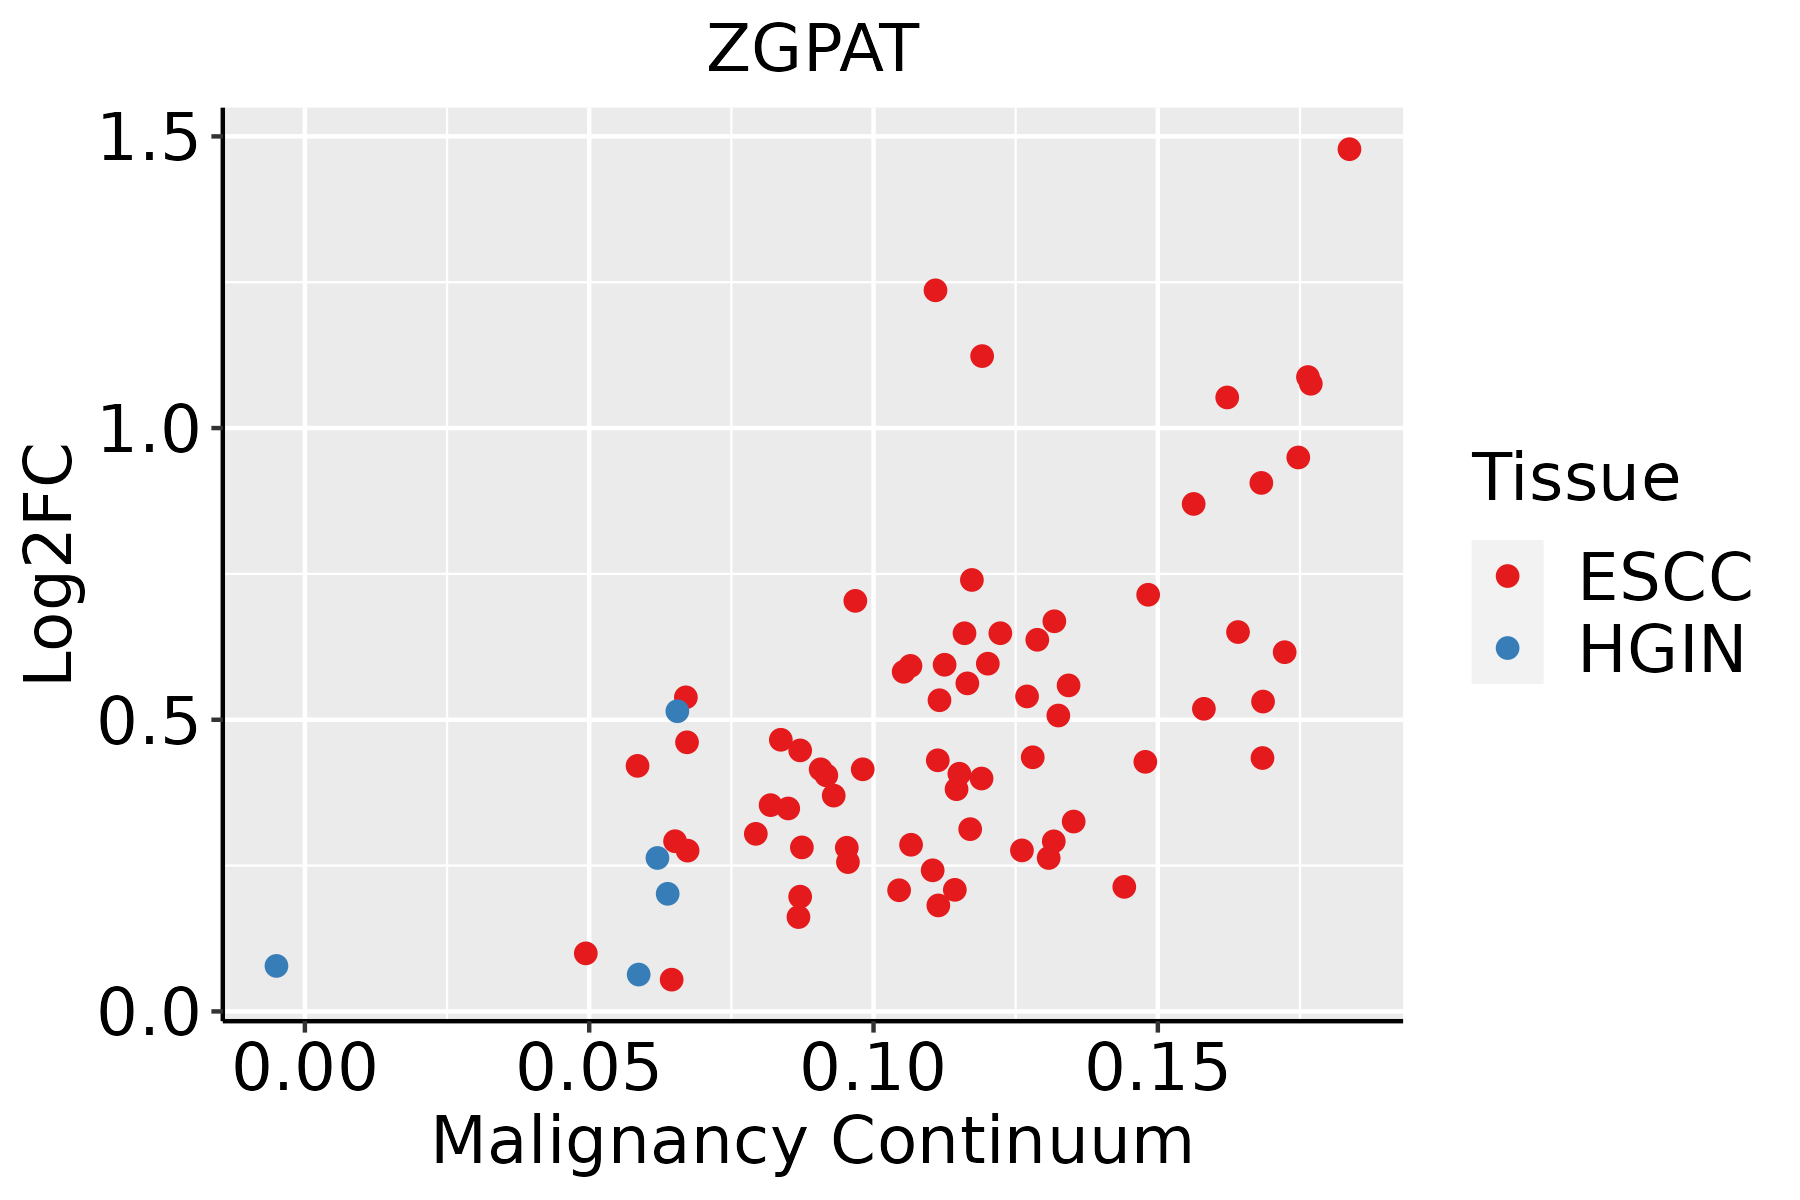 | ESCC: Esophageal squamous cell carcinoma |
| HGIN: High-grade intraepithelial neoplasias | ||
| LGIN: Low-grade intraepithelial neoplasias | ||
| Liver | 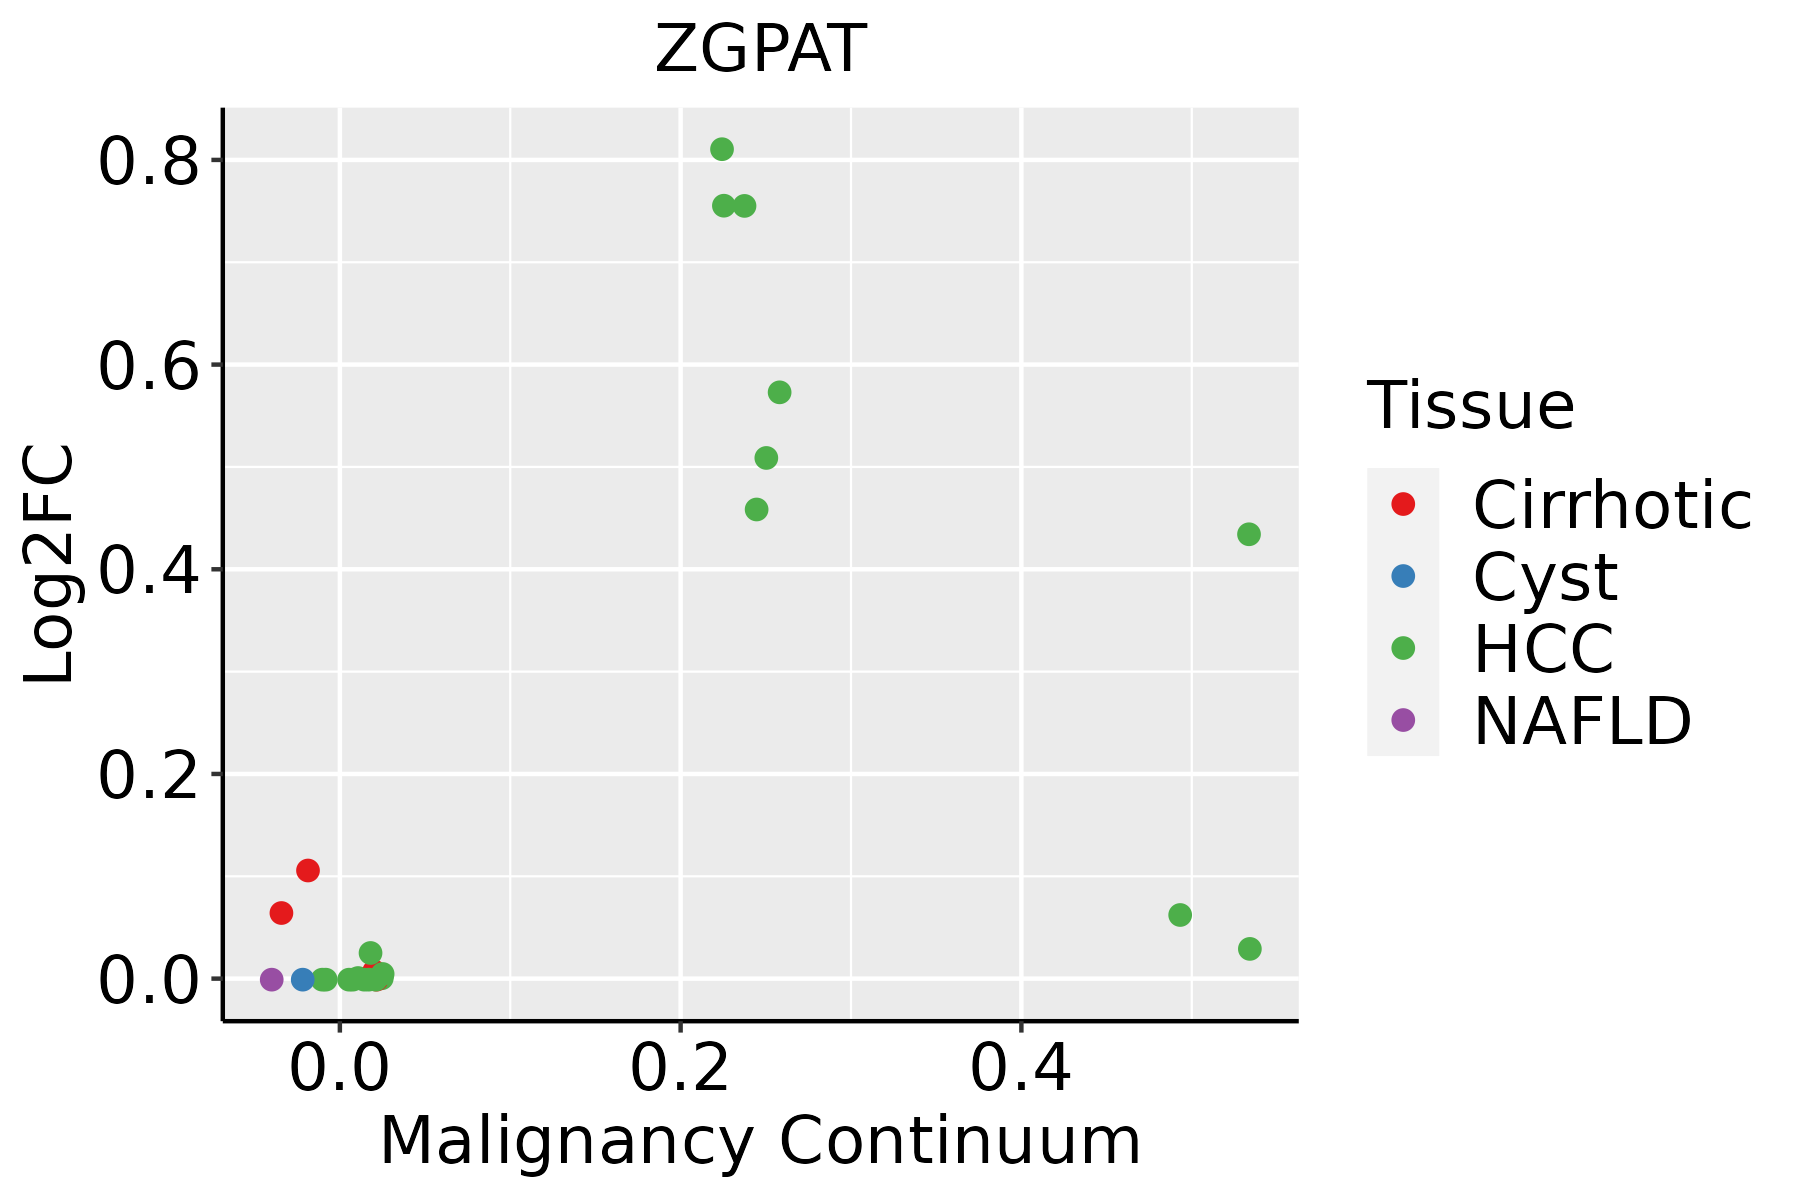 | HCC: Hepatocellular carcinoma |
| NAFLD: Non-alcoholic fatty liver disease |
| ∗log2FC in expression of this searched gene in stem-like cells from each diseased tissue sample relative to stem-like cells in normal samples in each tissue plotted against the malignancy continuum. Samples are colored based on if they are from different disease stage. |
Top |
Malignant transformation related pathway analysis |
| Find out the enriched GO biological processes and KEGG pathways involved in transition from healthy to precancer to cancer |
| Tissue | Disease Stage | Enriched GO biological Processes |
| Colorectum | AD |  |
| Colorectum | SER |  |
| Colorectum | MSS |  |
| Colorectum | MSI-H |  |
| Colorectum | FAP |  |
| ∗Top 15 enriched GO BP terms are showed in the bar plot of each disease state in each tissue. Each row represents a significant GO biological process which is colored according to the -log10(p.adjust). |
| Page: 1 2 3 4 5 6 7 8 9 |
| GO ID | Tissue | Disease Stage | Description | Gene Ratio | Bg Ratio | pvalue | p.adjust | Count |
| GO:004593626 | Esophagus | HGIN | negative regulation of phosphate metabolic process | 89/2587 | 441/18723 | 1.24e-04 | 2.54e-03 | 89 |
| GO:001056326 | Esophagus | HGIN | negative regulation of phosphorus metabolic process | 89/2587 | 442/18723 | 1.34e-04 | 2.71e-03 | 89 |
| GO:004232620 | Esophagus | HGIN | negative regulation of phosphorylation | 78/2587 | 385/18723 | 2.77e-04 | 4.77e-03 | 78 |
| GO:000193320 | Esophagus | HGIN | negative regulation of protein phosphorylation | 69/2587 | 342/18723 | 6.81e-04 | 9.26e-03 | 69 |
| GO:005134827 | Esophagus | HGIN | negative regulation of transferase activity | 55/2587 | 268/18723 | 1.51e-03 | 1.74e-02 | 55 |
| GO:003812717 | Esophagus | HGIN | ERBB signaling pathway | 29/2587 | 121/18723 | 1.83e-03 | 1.97e-02 | 29 |
| GO:19011848 | Esophagus | HGIN | regulation of ERBB signaling pathway | 20/2587 | 79/18723 | 4.56e-03 | 3.96e-02 | 20 |
| GO:00071762 | Esophagus | HGIN | regulation of epidermal growth factor-activated receptor activity | 10/2587 | 30/18723 | 5.36e-03 | 4.40e-02 | 10 |
| GO:000717317 | Esophagus | HGIN | epidermal growth factor receptor signaling pathway | 25/2587 | 108/18723 | 5.87e-03 | 4.77e-02 | 25 |
| GO:0010563111 | Esophagus | ESCC | negative regulation of phosphorus metabolic process | 274/8552 | 442/18723 | 2.32e-12 | 9.41e-11 | 274 |
| GO:0045936111 | Esophagus | ESCC | negative regulation of phosphate metabolic process | 273/8552 | 441/18723 | 3.18e-12 | 1.25e-10 | 273 |
| GO:0051348111 | Esophagus | ESCC | negative regulation of transferase activity | 177/8552 | 268/18723 | 1.08e-11 | 4.00e-10 | 177 |
| GO:0042326111 | Esophagus | ESCC | negative regulation of phosphorylation | 237/8552 | 385/18723 | 1.86e-10 | 5.33e-09 | 237 |
| GO:0001933111 | Esophagus | ESCC | negative regulation of protein phosphorylation | 213/8552 | 342/18723 | 3.54e-10 | 9.76e-09 | 213 |
| GO:003367319 | Esophagus | ESCC | negative regulation of kinase activity | 154/8552 | 237/18723 | 1.38e-09 | 3.27e-08 | 154 |
| GO:000646920 | Esophagus | ESCC | negative regulation of protein kinase activity | 140/8552 | 212/18723 | 1.53e-09 | 3.56e-08 | 140 |
| GO:003812718 | Esophagus | ESCC | ERBB signaling pathway | 82/8552 | 121/18723 | 7.23e-07 | 9.40e-06 | 82 |
| GO:000717318 | Esophagus | ESCC | epidermal growth factor receptor signaling pathway | 73/8552 | 108/18723 | 3.36e-06 | 3.73e-05 | 73 |
| GO:190118413 | Esophagus | ESCC | regulation of ERBB signaling pathway | 54/8552 | 79/18723 | 3.81e-05 | 3.08e-04 | 54 |
| GO:00507322 | Esophagus | ESCC | negative regulation of peptidyl-tyrosine phosphorylation | 42/8552 | 59/18723 | 6.35e-05 | 4.84e-04 | 42 |
| Page: 1 2 3 |
| Pathway ID | Tissue | Disease Stage | Description | Gene Ratio | Bg Ratio | pvalue | p.adjust | qvalue | Count |
| Page: 1 |
Top |
Cell-cell communication analysis |
| Identification of potential cell-cell interactions between two cell types and their ligand-receptor pairs for different disease states |
| Ligand | Receptor | LRpair | Pathway | Tissue | Disease Stage |
| Page: 1 |
Top |
Single-cell gene regulatory network inference analysis |
| Find out the significant the regulons (TFs) and the target genes of each regulon across cell types for different disease states |
| TF | Cell Type | Tissue | Disease Stage | Target Gene | RSS | Regulon Activity |
| ∗The dot plots of a searched regulon are shown for all cell subpopulations in each disease state of each tissue based on the regulon specific score inferred using pySCENIC and by calculating the average expression. |
| Page: 1 |
Top |
Somatic mutation of malignant transformation related genes |
| Annotation of somatic variants for genes involved in malignant transformation |
| Hugo Symbol | Variant Class | Variant Classification | dbSNP RS | HGVSc | HGVSp | HGVSp Short | SWISSPROT | BIOTYPE | SIFT | PolyPhen | Tumor Sample Barcode | Tissue | Histology | Sex | Age | Stage | Therapy Types | Drugs | Outcome |
| ZGPAT | SNV | Missense_Mutation | novel | c.677N>A | p.Ala226Asp | p.A226D | Q8N5A5 | protein_coding | deleterious(0) | probably_damaging(0.941) | TCGA-3C-AALI-01 | Breast | breast invasive carcinoma | Female | <65 | I/II | Unspecific | Poly E | Complete Response |
| ZGPAT | SNV | Missense_Mutation | rs746868722 | c.1310C>T | p.Ala437Val | p.A437V | Q8N5A5 | protein_coding | tolerated(0.39) | benign(0.036) | TCGA-AO-A128-01 | Breast | breast invasive carcinoma | Female | <65 | I/II | Chemotherapy | doxorubicin | SD |
| ZGPAT | SNV | Missense_Mutation | rs201544347 | c.226N>A | p.Asp76Asn | p.D76N | Q8N5A5 | protein_coding | deleterious(0.03) | benign(0.141) | TCGA-C8-A26V-01 | Breast | breast invasive carcinoma | Female | <65 | III/IV | Hormone Therapy | tamoxiphen | CR |
| ZGPAT | SNV | Missense_Mutation | novel | c.814G>A | p.Glu272Lys | p.E272K | Q8N5A5 | protein_coding | deleterious(0.01) | benign(0.293) | TCGA-C8-A8HQ-01 | Breast | breast invasive carcinoma | Female | <65 | I/II | Unknown | Unknown | SD |
| ZGPAT | SNV | Missense_Mutation | novel | c.229G>T | p.Ala77Ser | p.A77S | Q8N5A5 | protein_coding | tolerated(0.68) | benign(0.114) | TCGA-E2-A570-01 | Breast | breast invasive carcinoma | Female | <65 | I/II | Hormone Therapy | anastrozole | SD |
| ZGPAT | deletion | Frame_Shift_Del | novel | c.187delN | p.Leu63TrpfsTer67 | p.L63Wfs*67 | Q8N5A5 | protein_coding | TCGA-D8-A27V-01 | Breast | breast invasive carcinoma | Female | <65 | I/II | Hormone Therapy | tamoxiphen | SD | ||
| ZGPAT | deletion | Frame_Shift_Del | novel | c.919delN | p.Pro307ArgfsTer30 | p.P307Rfs*30 | Q8N5A5 | protein_coding | TCGA-D8-A27V-01 | Breast | breast invasive carcinoma | Female | <65 | I/II | Hormone Therapy | tamoxiphen | SD | ||
| ZGPAT | deletion | Frame_Shift_Del | novel | c.467delN | p.Glu157ArgfsTer21 | p.E157Rfs*21 | Q8N5A5 | protein_coding | TCGA-EW-A2FV-01 | Breast | breast invasive carcinoma | Female | <65 | III/IV | Chemotherapy | docetaxel | SD | ||
| ZGPAT | SNV | Missense_Mutation | novel | c.1528N>C | p.Ala510Pro | p.A510P | Q8N5A5 | protein_coding | deleterious(0) | probably_damaging(0.976) | TCGA-DS-A1OB-01 | Cervix | cervical & endocervical cancer | Female | <65 | I/II | Chemotherapy | carboplatin | PD |
| ZGPAT | SNV | Missense_Mutation | novel | c.1529N>T | p.Ala510Val | p.A510V | Q8N5A5 | protein_coding | deleterious(0.01) | probably_damaging(0.949) | TCGA-DS-A1OB-01 | Cervix | cervical & endocervical cancer | Female | <65 | I/II | Chemotherapy | carboplatin | PD |
| Page: 1 2 3 4 5 6 7 |
Top |
Related drugs of malignant transformation related genes |
| Identification of chemicals and drugs interact with genes involved in malignant transfromation |
| (DGIdb 4.0) |
| Entrez ID | Symbol | Category | Interaction Types | Drug Claim Name | Drug Name | PMIDs |
| Page: 1 |

Copyright 2023-Present -The University of Texas Health Science Center at Houston |