
|
|||||
|
 | |
| |
| |
| |
| |
| |
|
Gene: ZG16B |
Gene summary for ZG16B |
| Gene information | Species | Human | Gene symbol | ZG16B | Gene ID | 124220 |
| Gene name | zymogen granule protein 16B | |
| Gene Alias | EECP | |
| Cytomap | 16p13.3 | |
| Gene Type | protein-coding | GO ID | GO:0001894 | UniProtAcc | G8H6I3 |
Top |
Malignant transformation analysis |
| Identification of the aberrant gene expression in precancerous and cancerous lesions by comparing the gene expression of stem-like cells in diseased tissues with normal stem cells |
| Entrez ID | Symbol | Replicates | Species | Organ | Tissue | Adj P-value | Log2FC | Malignancy |
| 124220 | ZG16B | GSM4909282 | Human | Breast | IDC | 6.58e-19 | -3.85e-01 | -0.0288 |
| 124220 | ZG16B | GSM4909285 | Human | Breast | IDC | 1.01e-14 | -3.64e-01 | 0.21 |
| 124220 | ZG16B | GSM4909287 | Human | Breast | IDC | 3.53e-02 | -5.60e-02 | 0.2057 |
| 124220 | ZG16B | GSM4909293 | Human | Breast | IDC | 2.26e-04 | -1.24e-01 | 0.1581 |
| 124220 | ZG16B | GSM4909296 | Human | Breast | IDC | 2.89e-02 | -4.96e-02 | 0.1524 |
| 124220 | ZG16B | GSM4909298 | Human | Breast | IDC | 1.97e-04 | -1.68e-02 | 0.1551 |
| 124220 | ZG16B | GSM4909299 | Human | Breast | IDC | 7.47e-04 | -2.31e-01 | 0.035 |
| 124220 | ZG16B | GSM4909306 | Human | Breast | IDC | 2.72e-17 | 5.82e-01 | 0.1564 |
| 124220 | ZG16B | GSM4909307 | Human | Breast | IDC | 1.54e-04 | 3.85e-01 | 0.1569 |
| 124220 | ZG16B | GSM4909308 | Human | Breast | IDC | 4.86e-23 | 6.59e-01 | 0.158 |
| 124220 | ZG16B | GSM4909311 | Human | Breast | IDC | 1.80e-14 | -1.52e-01 | 0.1534 |
| 124220 | ZG16B | GSM4909319 | Human | Breast | IDC | 1.29e-26 | -4.96e-02 | 0.1563 |
| 124220 | ZG16B | brca2 | Human | Breast | Precancer | 4.16e-05 | 9.49e-02 | -0.024 |
| 124220 | ZG16B | brca3 | Human | Breast | Precancer | 1.69e-03 | -8.79e-02 | -0.0263 |
| 124220 | ZG16B | NCCBC5 | Human | Breast | DCIS | 2.46e-02 | -1.62e-01 | 0.2046 |
| 124220 | ZG16B | P1 | Human | Breast | IDC | 8.33e-06 | -2.37e-01 | 0.1527 |
| 124220 | ZG16B | DCIS2 | Human | Breast | DCIS | 3.98e-17 | -1.90e-01 | 0.0085 |
| 124220 | ZG16B | sample3 | Human | Cervix | CC | 3.34e-02 | 2.08e-01 | 0.1387 |
| 124220 | ZG16B | H2 | Human | Cervix | HSIL_HPV | 1.46e-28 | 7.50e-01 | 0.0632 |
| 124220 | ZG16B | T2 | Human | Cervix | CC | 1.47e-07 | 5.91e-01 | 0.0709 |
| Page: 1 2 3 4 5 6 7 |
| Tissue | Expression Dynamics | Abbreviation |
| Breast | 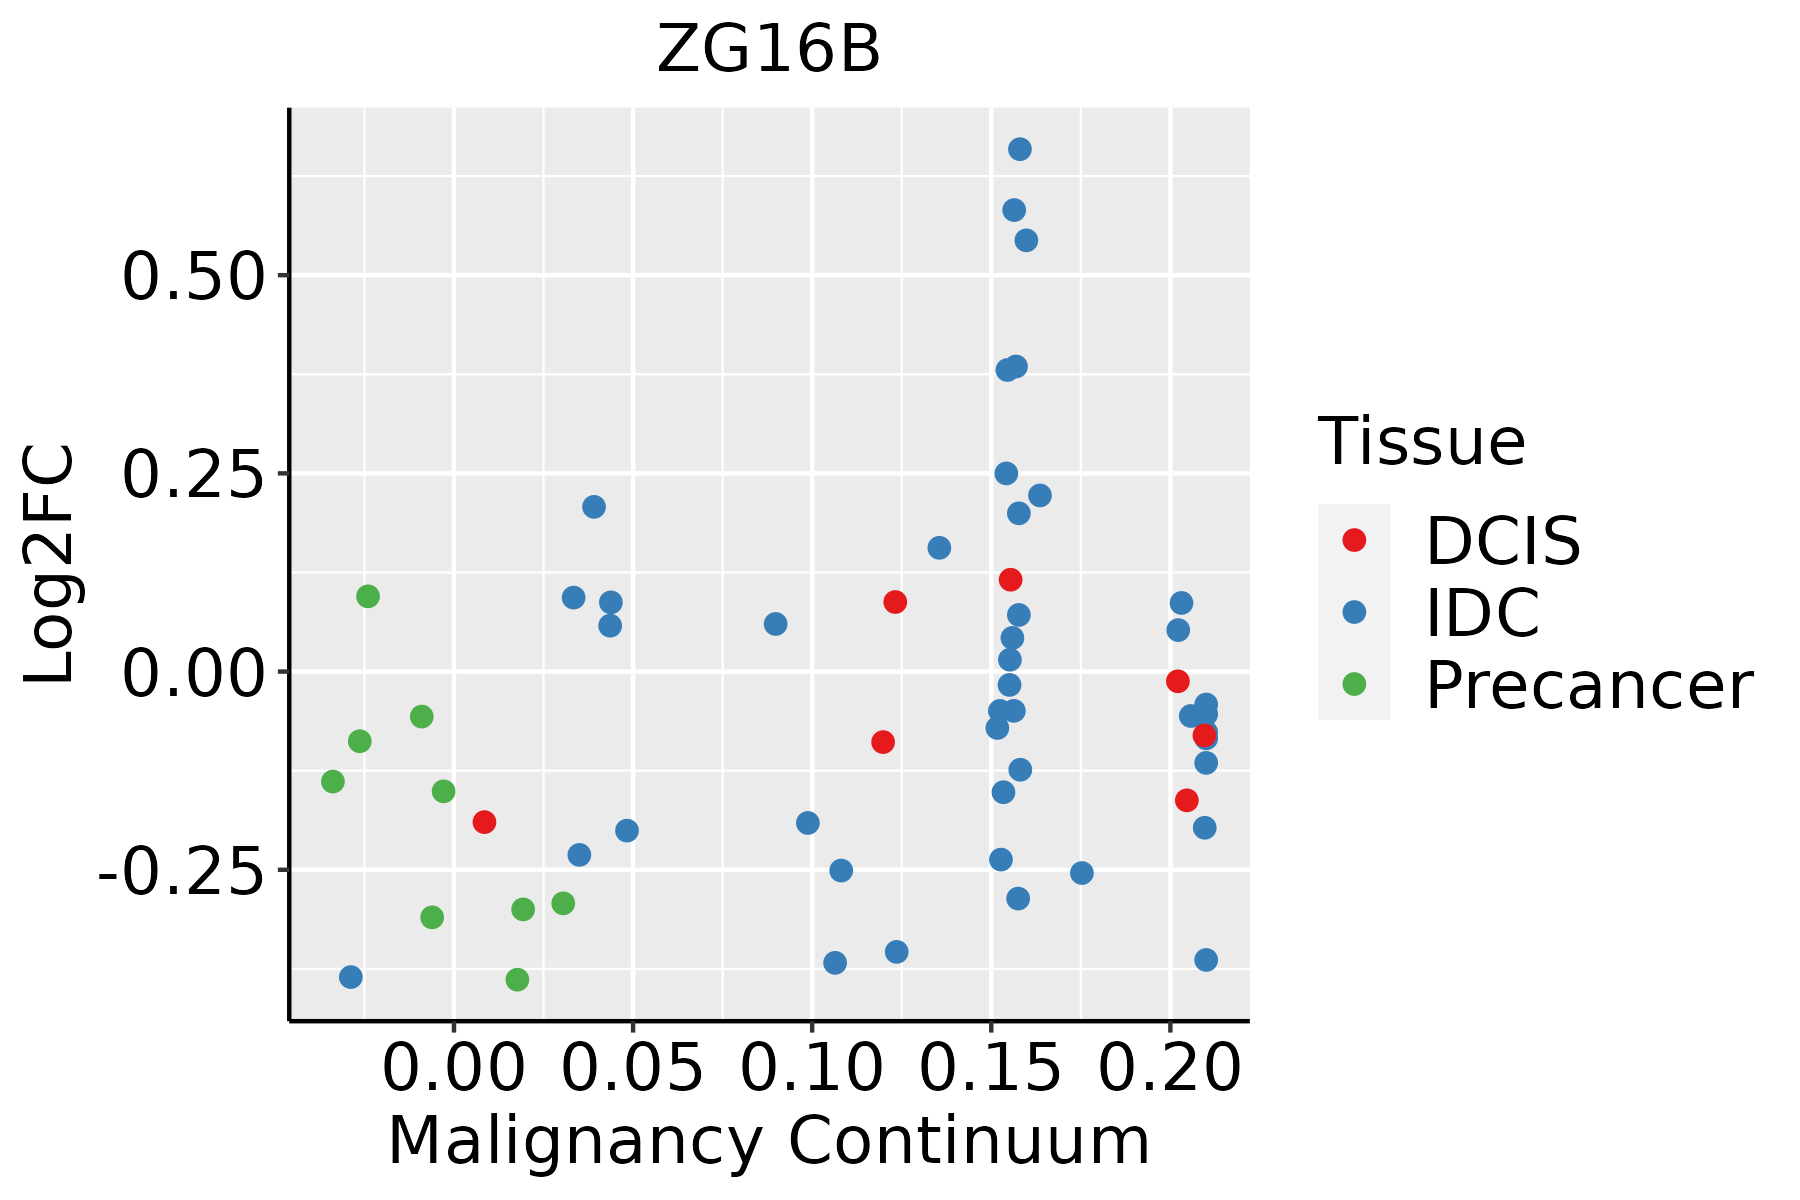 | IDC: Invasive ductal carcinoma |
| DCIS: Ductal carcinoma in situ | ||
| Precancer(BRCA1-mut): Precancerous lesion from BRCA1 mutation carriers | ||
| Cervix | 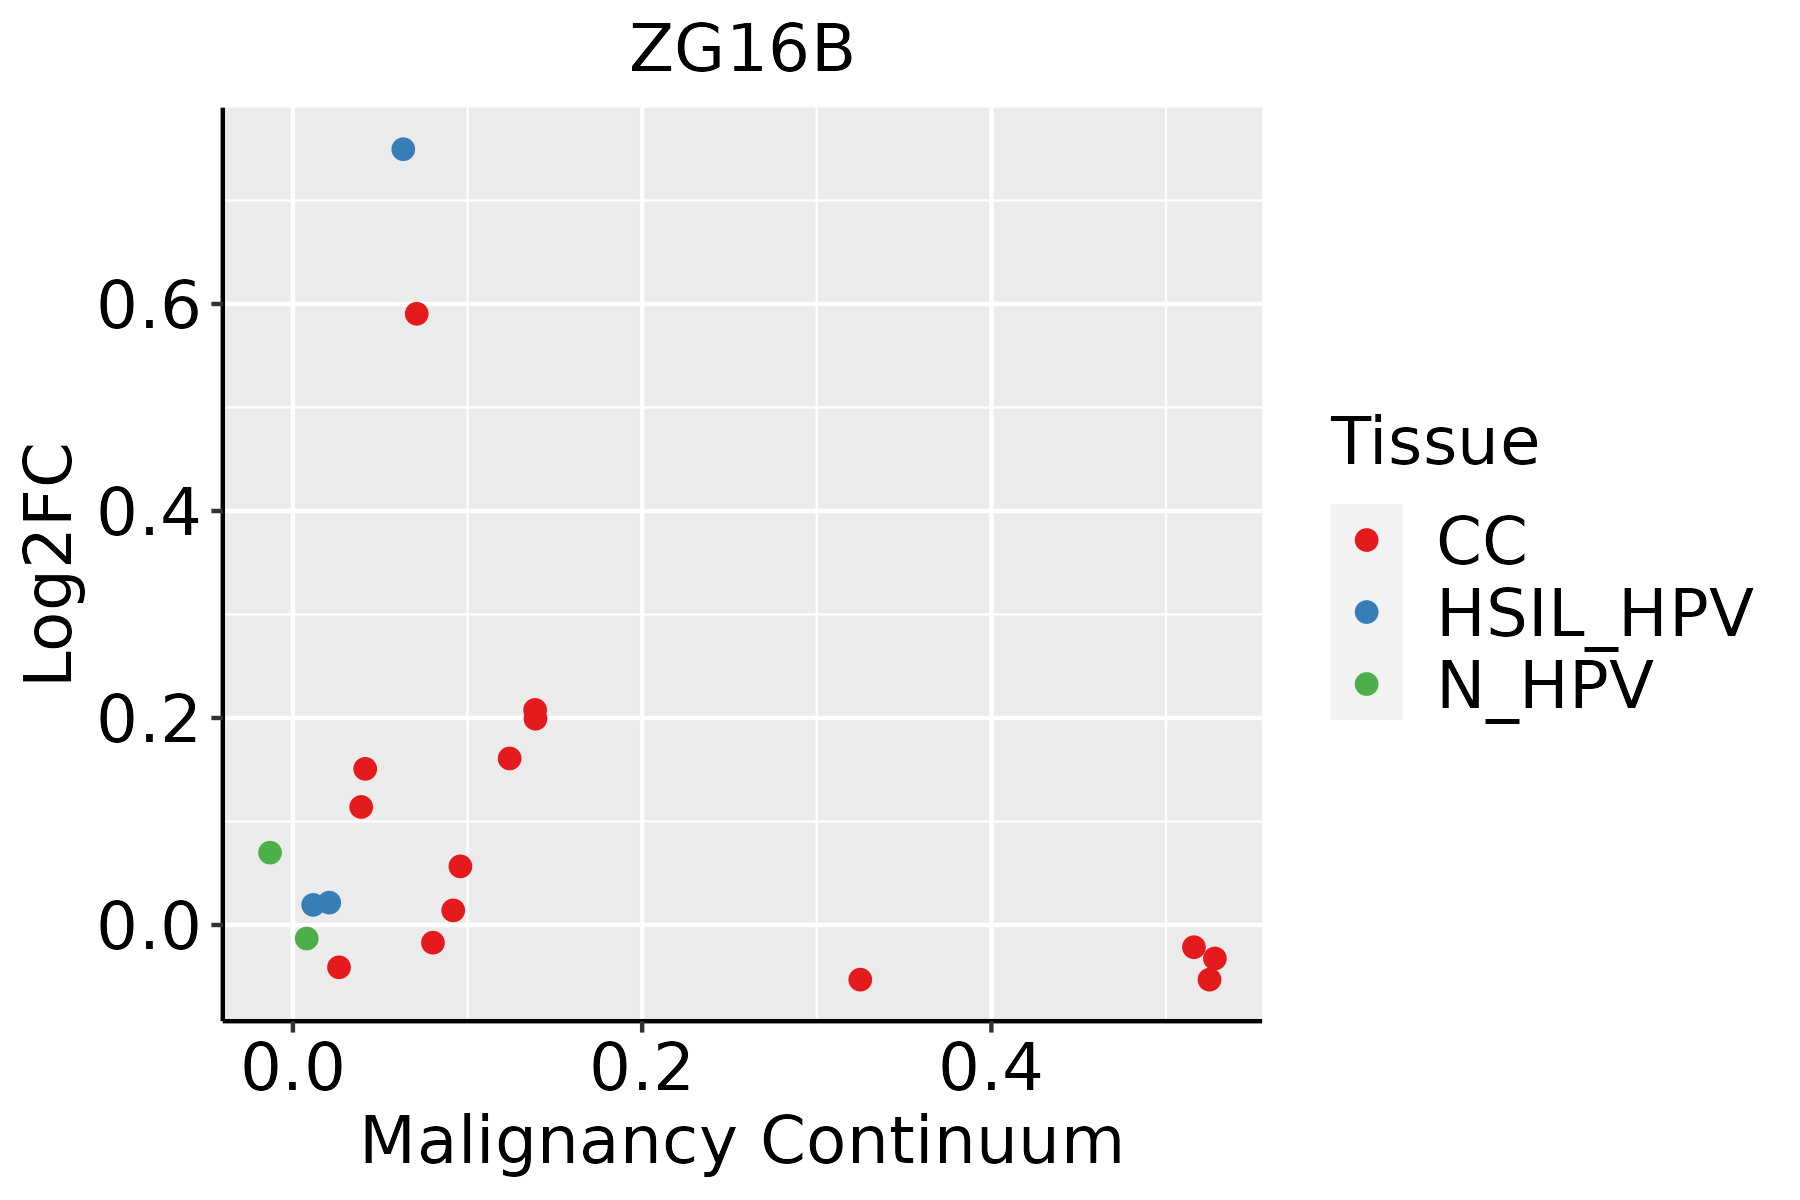 | CC: Cervix cancer |
| HSIL_HPV: HPV-infected high-grade squamous intraepithelial lesions | ||
| N_HPV: HPV-infected normal cervix | ||
| Colorectum (GSE201348) |  | FAP: Familial adenomatous polyposis |
| CRC: Colorectal cancer | ||
| Colorectum (HTA11) |  | AD: Adenomas |
| SER: Sessile serrated lesions | ||
| MSI-H: Microsatellite-high colorectal cancer | ||
| MSS: Microsatellite stable colorectal cancer | ||
| Esophagus | 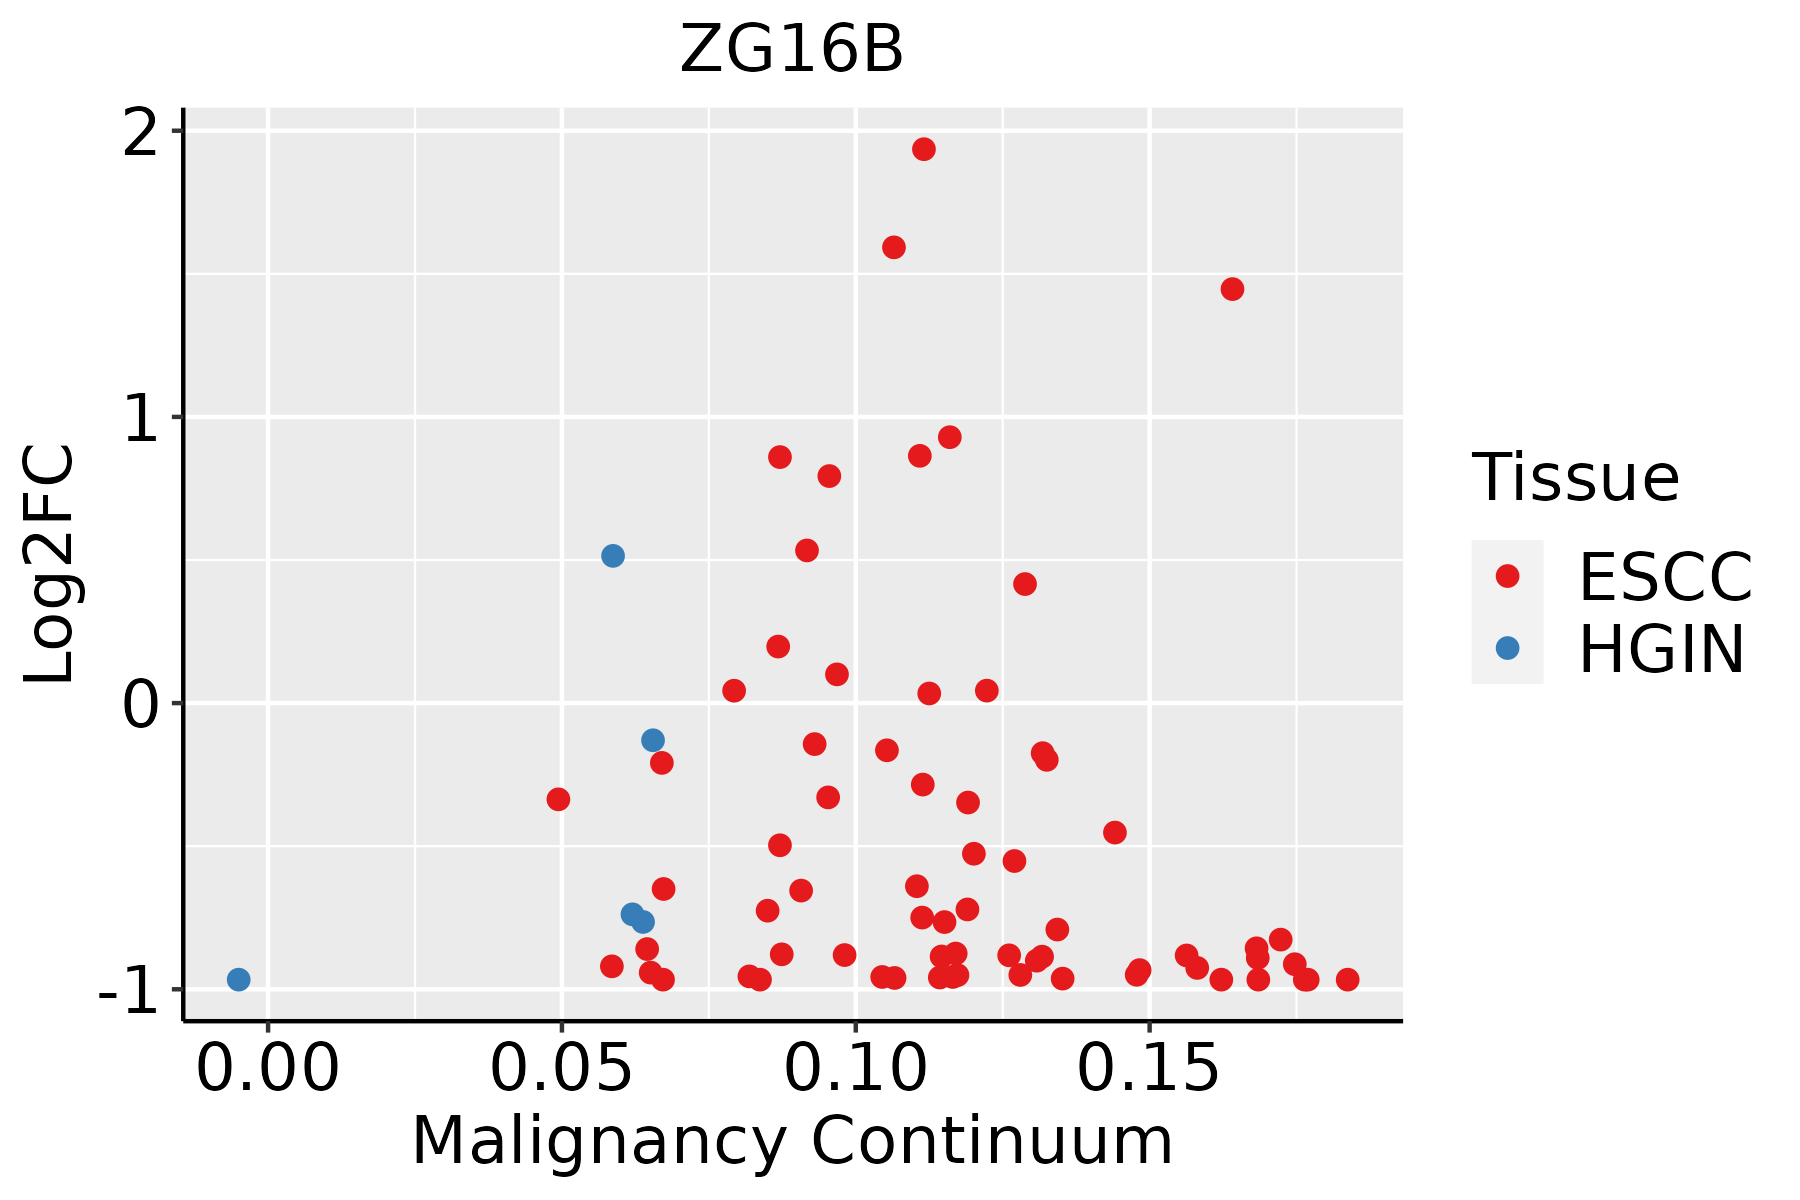 | ESCC: Esophageal squamous cell carcinoma |
| HGIN: High-grade intraepithelial neoplasias | ||
| LGIN: Low-grade intraepithelial neoplasias | ||
| GC |  | CAG: Chronic atrophic gastritis |
| CAG with IM: Chronic atrophic gastritis with intestinal metaplasia | ||
| CSG: Chronic superficial gastritis | ||
| GC: Gastric cancer | ||
| SIM: Severe intestinal metaplasia | ||
| WIM: Wild intestinal metaplasia | ||
| Liver | 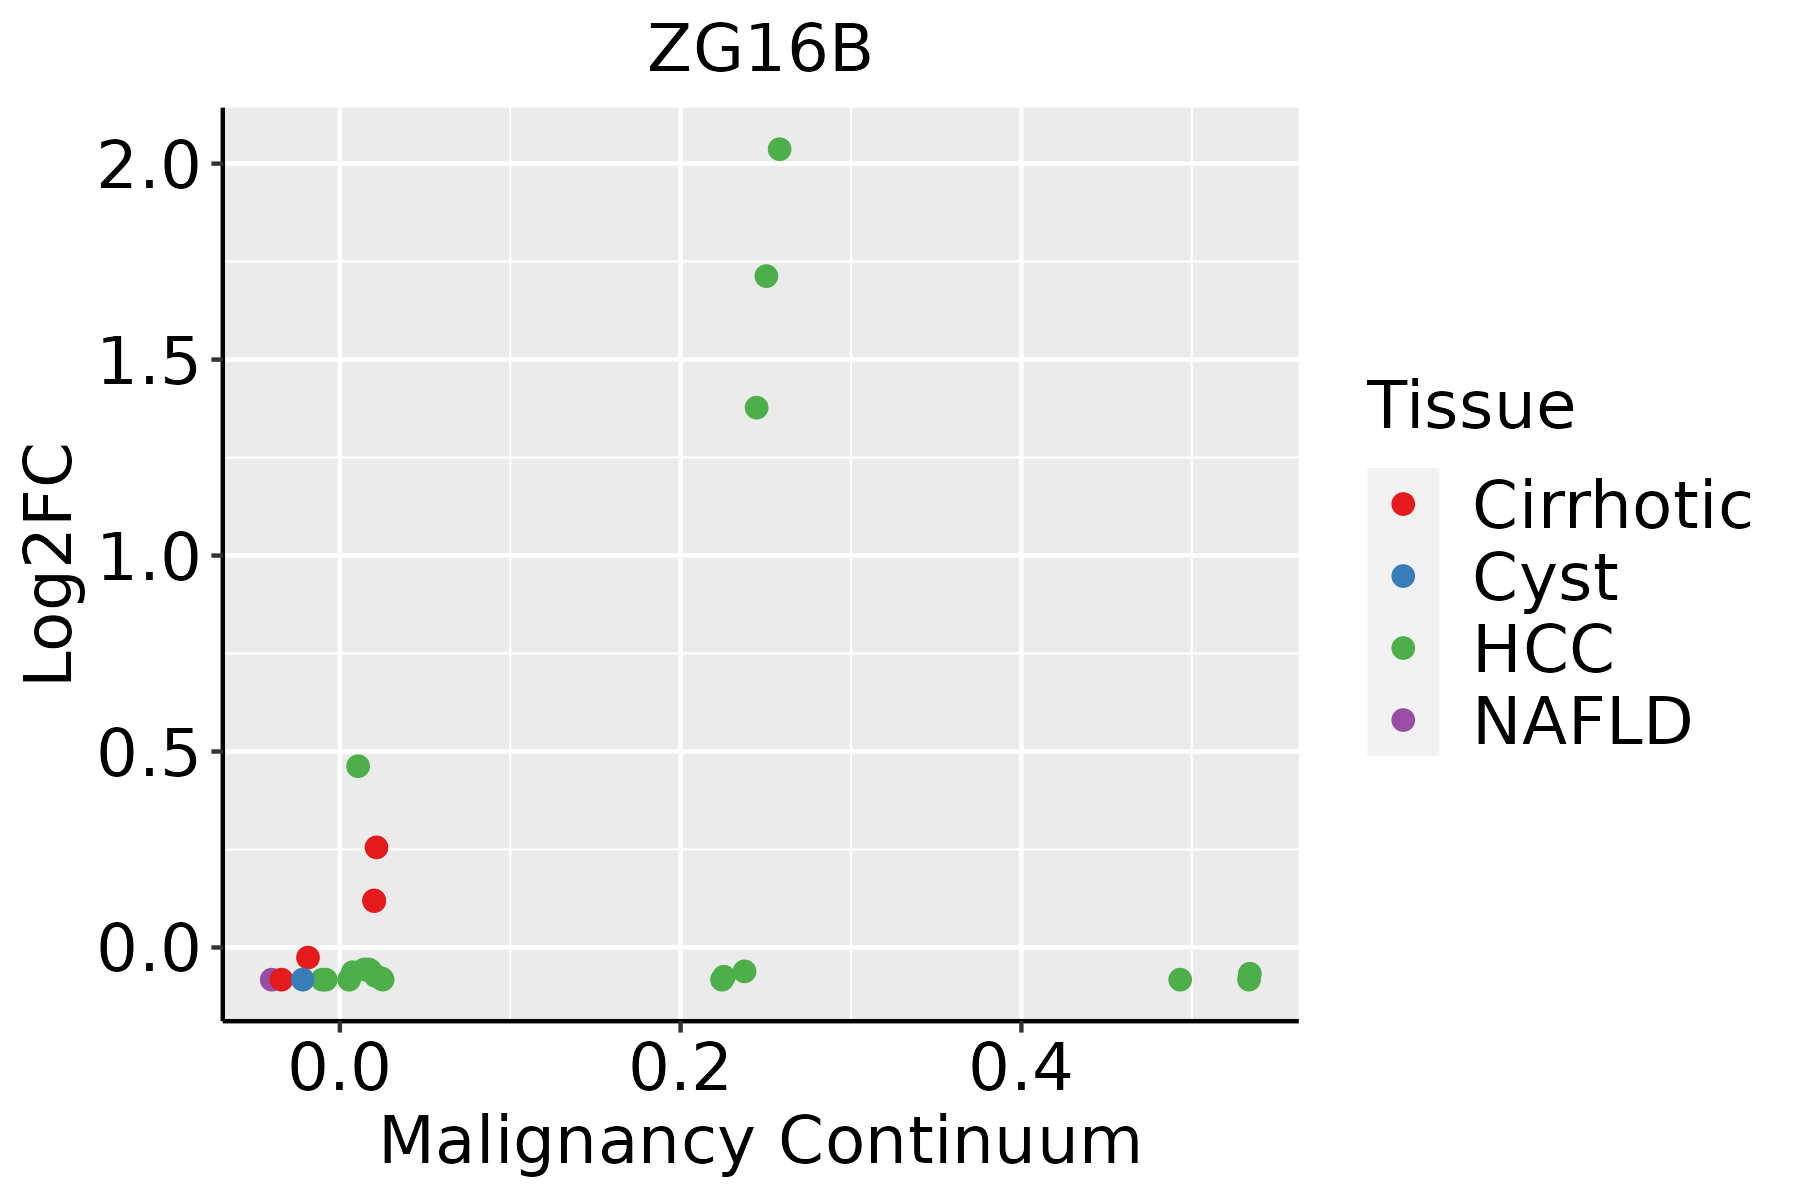 | HCC: Hepatocellular carcinoma |
| NAFLD: Non-alcoholic fatty liver disease | ||
| Oral Cavity | 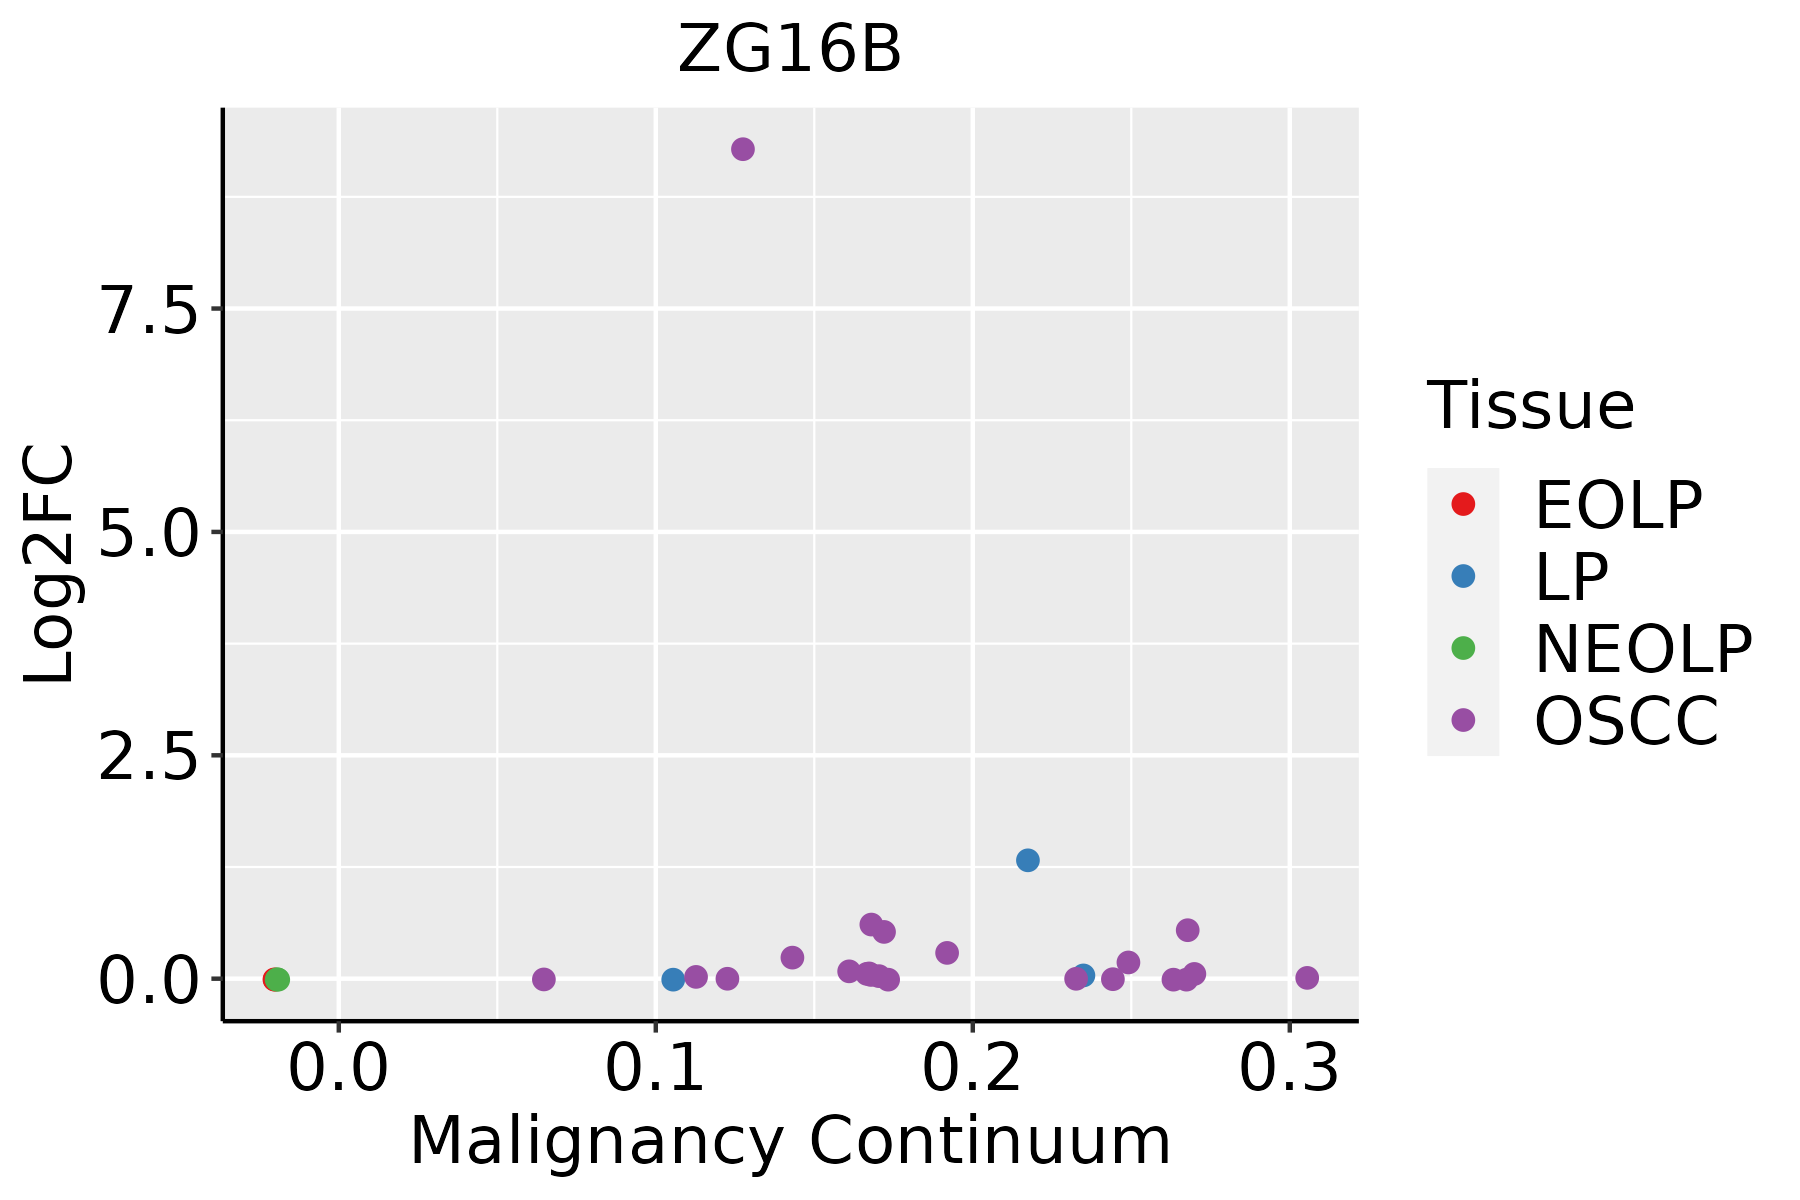 | EOLP: Erosive Oral lichen planus |
| LP: leukoplakia | ||
| NEOLP: Non-erosive oral lichen planus | ||
| OSCC: Oral squamous cell carcinoma | ||
| Prostate |  | BPH: Benign Prostatic Hyperplasia |
| ∗log2FC in expression of this searched gene in stem-like cells from each diseased tissue sample relative to stem-like cells in normal samples in each tissue plotted against the malignancy continuum. Samples are colored based on if they are from different disease stage. |
Top |
Malignant transformation related pathway analysis |
| Find out the enriched GO biological processes and KEGG pathways involved in transition from healthy to precancer to cancer |
| Tissue | Disease Stage | Enriched GO biological Processes |
| Colorectum | AD |  |
| Colorectum | SER |  |
| Colorectum | MSS |  |
| Colorectum | MSI-H |  |
| Colorectum | FAP |  |
| ∗Top 15 enriched GO BP terms are showed in the bar plot of each disease state in each tissue. Each row represents a significant GO biological process which is colored according to the -log10(p.adjust). |
| Page: 1 2 3 4 5 6 7 8 9 |
| GO ID | Tissue | Disease Stage | Description | Gene Ratio | Bg Ratio | pvalue | p.adjust | Count |
| GO:00018956 | Breast | Precancer | retina homeostasis | 12/1080 | 79/18723 | 1.82e-03 | 1.79e-02 | 12 |
| GO:00018948 | Breast | Precancer | tissue homeostasis | 27/1080 | 268/18723 | 3.49e-03 | 2.90e-02 | 27 |
| GO:000189511 | Breast | IDC | retina homeostasis | 15/1434 | 79/18723 | 8.62e-04 | 1.00e-02 | 15 |
| GO:000189413 | Breast | IDC | tissue homeostasis | 34/1434 | 268/18723 | 2.54e-03 | 2.28e-02 | 34 |
| GO:000189521 | Breast | DCIS | retina homeostasis | 14/1390 | 79/18723 | 1.88e-03 | 1.81e-02 | 14 |
| GO:000189423 | Breast | DCIS | tissue homeostasis | 33/1390 | 268/18723 | 2.88e-03 | 2.48e-02 | 33 |
| GO:00018949 | Cervix | CC | tissue homeostasis | 57/2311 | 268/18723 | 2.43e-05 | 4.21e-04 | 57 |
| GO:00602498 | Cervix | CC | anatomical structure homeostasis | 63/2311 | 314/18723 | 6.03e-05 | 8.68e-04 | 63 |
| GO:00018957 | Cervix | CC | retina homeostasis | 19/2311 | 79/18723 | 2.94e-03 | 1.94e-02 | 19 |
| GO:000189512 | Cervix | HSIL_HPV | retina homeostasis | 12/737 | 79/18723 | 5.76e-05 | 1.39e-03 | 12 |
| GO:000189414 | Cervix | HSIL_HPV | tissue homeostasis | 25/737 | 268/18723 | 6.17e-05 | 1.46e-03 | 25 |
| GO:006024913 | Cervix | HSIL_HPV | anatomical structure homeostasis | 25/737 | 314/18723 | 7.04e-04 | 9.40e-03 | 25 |
| GO:0060249 | Colorectum | AD | anatomical structure homeostasis | 94/3918 | 314/18723 | 9.37e-05 | 1.42e-03 | 94 |
| GO:0001894 | Colorectum | AD | tissue homeostasis | 81/3918 | 268/18723 | 1.96e-04 | 2.62e-03 | 81 |
| GO:00018941 | Colorectum | SER | tissue homeostasis | 66/2897 | 268/18723 | 5.87e-05 | 1.37e-03 | 66 |
| GO:00602491 | Colorectum | SER | anatomical structure homeostasis | 74/2897 | 314/18723 | 1.01e-04 | 2.13e-03 | 74 |
| GO:00602492 | Colorectum | MSS | anatomical structure homeostasis | 84/3467 | 314/18723 | 1.87e-04 | 2.64e-03 | 84 |
| GO:00018942 | Colorectum | MSS | tissue homeostasis | 72/3467 | 268/18723 | 4.53e-04 | 5.40e-03 | 72 |
| GO:006024910 | Prostate | BPH | anatomical structure homeostasis | 68/3107 | 314/18723 | 1.10e-02 | 4.53e-02 | 68 |
| GO:000189416 | Prostate | Tumor | tissue homeostasis | 65/3246 | 268/18723 | 2.39e-03 | 1.35e-02 | 65 |
| Page: 1 2 |
| Pathway ID | Tissue | Disease Stage | Description | Gene Ratio | Bg Ratio | pvalue | p.adjust | qvalue | Count |
| Page: 1 |
Top |
Cell-cell communication analysis |
| Identification of potential cell-cell interactions between two cell types and their ligand-receptor pairs for different disease states |
| Ligand | Receptor | LRpair | Pathway | Tissue | Disease Stage |
| Page: 1 |
Top |
Single-cell gene regulatory network inference analysis |
| Find out the significant the regulons (TFs) and the target genes of each regulon across cell types for different disease states |
| TF | Cell Type | Tissue | Disease Stage | Target Gene | RSS | Regulon Activity |
| ∗The dot plots of a searched regulon are shown for all cell subpopulations in each disease state of each tissue based on the regulon specific score inferred using pySCENIC and by calculating the average expression. |
| Page: 1 |
Top |
Somatic mutation of malignant transformation related genes |
| Annotation of somatic variants for genes involved in malignant transformation |
| Hugo Symbol | Variant Class | Variant Classification | dbSNP RS | HGVSc | HGVSp | HGVSp Short | SWISSPROT | BIOTYPE | SIFT | PolyPhen | Tumor Sample Barcode | Tissue | Histology | Sex | Age | Stage | Therapy Types | Drugs | Outcome |
| ZG16B | SNV | Missense_Mutation | rs777297145 | c.445N>C | p.Asp149His | p.D149H | Q96DA0 | protein_coding | tolerated(0.11) | possibly_damaging(0.706) | TCGA-JW-A5VL-01 | Cervix | cervical & endocervical cancer | Female | <65 | I/II | Unknown | Unknown | SD |
| ZG16B | SNV | Missense_Mutation | rs751882900 | c.533N>A | p.Ser178Asn | p.S178N | Q96DA0 | protein_coding | tolerated(0.55) | benign(0.412) | TCGA-F5-6814-01 | Colorectum | rectum adenocarcinoma | Male | <65 | I/II | Unknown | Unknown | SD |
| ZG16B | SNV | Missense_Mutation | novel | c.118N>A | p.Leu40Met | p.L40M | Q96DA0 | protein_coding | tolerated(0.12) | probably_damaging(0.957) | TCGA-AJ-A3IA-01 | Endometrium | uterine corpus endometrioid carcinoma | Female | >=65 | I/II | Unknown | Unknown | SD |
| ZG16B | SNV | Missense_Mutation | rs774712949 | c.622N>T | p.Arg208Cys | p.R208C | Q96DA0 | protein_coding | deleterious_low_confidence(0.01) | benign(0.188) | TCGA-AP-A0LM-01 | Endometrium | uterine corpus endometrioid carcinoma | Female | <65 | III/IV | Chemotherapy | cisplatin | SD |
| ZG16B | SNV | Missense_Mutation | rs768633534 | c.13G>A | p.Gly5Arg | p.G5R | Q96DA0 | protein_coding | tolerated_low_confidence(0.84) | benign(0) | TCGA-AP-A1DK-01 | Endometrium | uterine corpus endometrioid carcinoma | Female | <65 | I/II | Unknown | Unknown | SD |
| ZG16B | SNV | Missense_Mutation | novel | c.531N>T | p.Lys177Asn | p.K177N | Q96DA0 | protein_coding | tolerated(0.07) | possibly_damaging(0.908) | TCGA-AX-A2HC-01 | Endometrium | uterine corpus endometrioid carcinoma | Female | <65 | III/IV | Chemotherapy | paclitaxel | PD |
| ZG16B | SNV | Missense_Mutation | novel | c.349N>A | p.Glu117Lys | p.E117K | Q96DA0 | protein_coding | deleterious(0) | probably_damaging(1) | TCGA-B5-A1MR-01 | Endometrium | uterine corpus endometrioid carcinoma | Female | >=65 | III/IV | Unknown | Unknown | SD |
| ZG16B | SNV | Missense_Mutation | rs576288928 | c.35C>T | p.Ala12Val | p.A12V | Q96DA0 | protein_coding | deleterious(0.05) | probably_damaging(0.95) | TCGA-FI-A2D5-01 | Endometrium | uterine corpus endometrioid carcinoma | Female | <65 | III/IV | Chemotherapy | carboplatinum | PD |
| ZG16B | SNV | Missense_Mutation | novel | c.37A>G | p.Met13Val | p.M13V | Q96DA0 | protein_coding | tolerated(0.29) | benign(0) | TCGA-FI-A2D5-01 | Endometrium | uterine corpus endometrioid carcinoma | Female | <65 | III/IV | Chemotherapy | carboplatinum | PD |
| ZG16B | SNV | Missense_Mutation | c.264T>A | p.Ser88Arg | p.S88R | Q96DA0 | protein_coding | tolerated(0.13) | probably_damaging(0.999) | TCGA-49-AAR0-01 | Lung | lung adenocarcinoma | Male | <65 | I/II | Unknown | Unknown | SD |
| Page: 1 2 |
Top |
Related drugs of malignant transformation related genes |
| Identification of chemicals and drugs interact with genes involved in malignant transfromation |
| (DGIdb 4.0) |
| Entrez ID | Symbol | Category | Interaction Types | Drug Claim Name | Drug Name | PMIDs |
| Page: 1 |

Copyright 2023-Present -The University of Texas Health Science Center at Houston |