
|
|||||
|
 | |
| |
| |
| |
| |
| |
|
Gene: ZG16 |
Gene summary for ZG16 |
| Gene information | Species | Human | Gene symbol | ZG16 | Gene ID | 653808 |
| Gene name | zymogen granule protein 16 | |
| Gene Alias | JCLN | |
| Cytomap | 16p11.2 | |
| Gene Type | protein-coding | GO ID | GO:0002376 | UniProtAcc | O60844 |
Top |
Malignant transformation analysis |
| Identification of the aberrant gene expression in precancerous and cancerous lesions by comparing the gene expression of stem-like cells in diseased tissues with normal stem cells |
| Entrez ID | Symbol | Replicates | Species | Organ | Tissue | Adj P-value | Log2FC | Malignancy |
| 653808 | ZG16 | HTA11_2487_2000001011 | Human | Colorectum | SER | 2.38e-09 | 2.89e+00 | -0.1808 |
| 653808 | ZG16 | HTA11_2112_2000001011 | Human | Colorectum | SER | 7.81e-18 | 5.83e+00 | -0.2196 |
| 653808 | ZG16 | HTA11_3361_2000001011 | Human | Colorectum | AD | 1.37e-29 | 3.83e+00 | -0.1207 |
| 653808 | ZG16 | HTA11_696_2000001011 | Human | Colorectum | AD | 2.44e-04 | 1.16e+00 | -0.1464 |
| 653808 | ZG16 | HTA11_99999971662_82457 | Human | Colorectum | MSS | 2.17e-03 | -2.29e-01 | 0.3859 |
| 653808 | ZG16 | HTA11_99999974143_84620 | Human | Colorectum | MSS | 9.36e-06 | -2.33e-01 | 0.3005 |
| 653808 | ZG16 | F007 | Human | Colorectum | FAP | 4.03e-03 | -2.33e-01 | 0.1176 |
| 653808 | ZG16 | A001-C-207 | Human | Colorectum | FAP | 6.74e-03 | -2.14e-01 | 0.1278 |
| 653808 | ZG16 | A015-C-204 | Human | Colorectum | FAP | 5.57e-03 | -2.20e-01 | -0.0228 |
| 653808 | ZG16 | A002-C-201 | Human | Colorectum | FAP | 1.01e-05 | -2.19e-01 | 0.0324 |
| 653808 | ZG16 | A002-C-203 | Human | Colorectum | FAP | 4.38e-06 | -2.33e-01 | 0.2786 |
| 653808 | ZG16 | A001-C-119 | Human | Colorectum | FAP | 6.33e-04 | -2.33e-01 | -0.1557 |
| 653808 | ZG16 | A002-C-205 | Human | Colorectum | FAP | 1.26e-04 | -2.02e-01 | -0.1236 |
| 653808 | ZG16 | A015-C-006 | Human | Colorectum | FAP | 1.94e-02 | -2.11e-01 | -0.0994 |
| 653808 | ZG16 | A002-C-114 | Human | Colorectum | FAP | 4.97e-03 | -1.97e-01 | -0.1561 |
| 653808 | ZG16 | A002-C-016 | Human | Colorectum | FAP | 3.61e-03 | -2.03e-01 | 0.0521 |
| 653808 | ZG16 | A002-C-116 | Human | Colorectum | FAP | 1.43e-04 | -2.18e-01 | -0.0452 |
| 653808 | ZG16 | A018-E-020 | Human | Colorectum | FAP | 1.61e-03 | -2.03e-01 | -0.2034 |
| 653808 | ZG16 | F034 | Human | Colorectum | FAP | 1.72e-03 | -2.01e-01 | -0.0665 |
| 653808 | ZG16 | F072B | Human | Colorectum | FAP | 4.38e-06 | -2.33e-01 | 0.257 |
| Page: 1 2 |
| Tissue | Expression Dynamics | Abbreviation |
| Colorectum (GSE201348) |  | FAP: Familial adenomatous polyposis |
| CRC: Colorectal cancer | ||
| Colorectum (HTA11) |  | AD: Adenomas |
| SER: Sessile serrated lesions | ||
| MSI-H: Microsatellite-high colorectal cancer | ||
| MSS: Microsatellite stable colorectal cancer | ||
| GC | 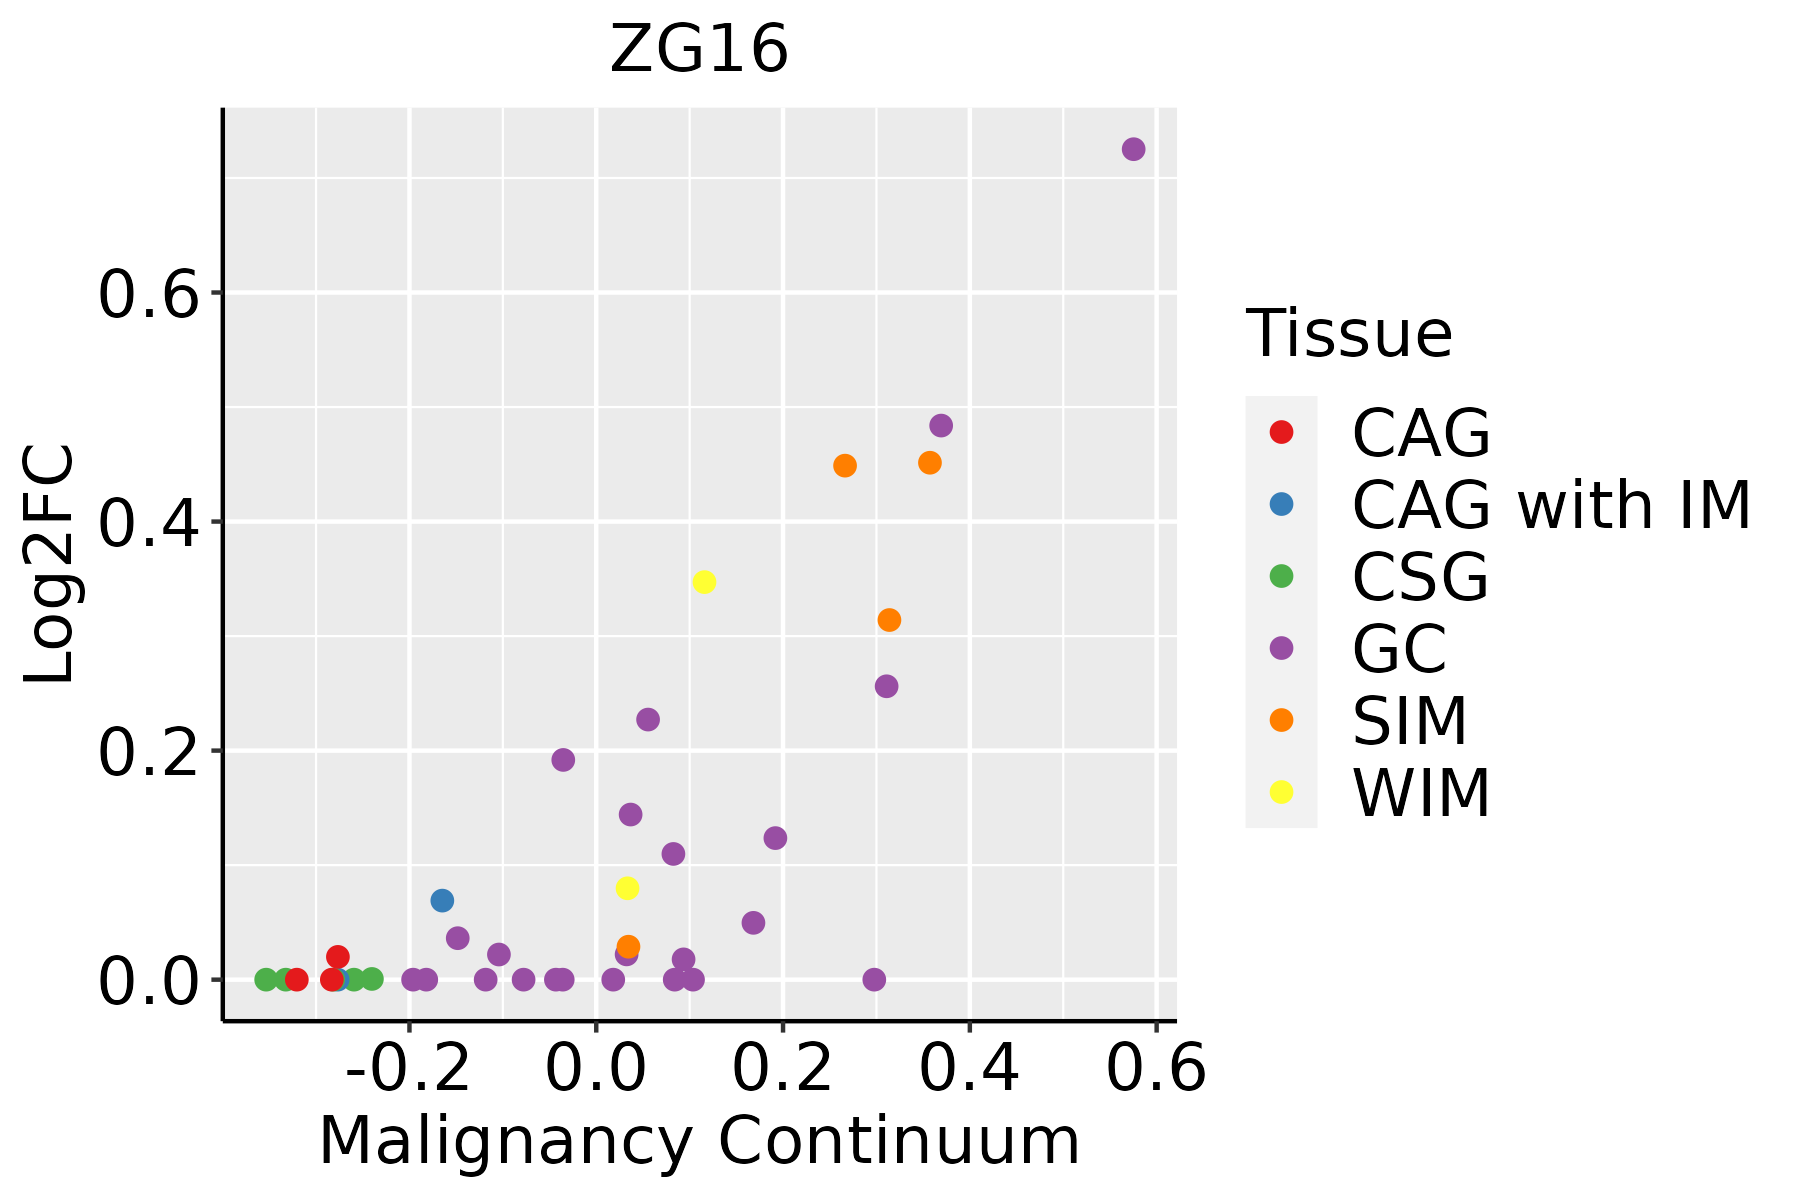 | CAG: Chronic atrophic gastritis |
| CAG with IM: Chronic atrophic gastritis with intestinal metaplasia | ||
| CSG: Chronic superficial gastritis | ||
| GC: Gastric cancer | ||
| SIM: Severe intestinal metaplasia | ||
| WIM: Wild intestinal metaplasia |
| ∗log2FC in expression of this searched gene in stem-like cells from each diseased tissue sample relative to stem-like cells in normal samples in each tissue plotted against the malignancy continuum. Samples are colored based on if they are from different disease stage. |
Top |
Malignant transformation related pathway analysis |
| Find out the enriched GO biological processes and KEGG pathways involved in transition from healthy to precancer to cancer |
| Tissue | Disease Stage | Enriched GO biological Processes |
| Colorectum | AD |  |
| Colorectum | SER |  |
| Colorectum | MSS |  |
| Colorectum | MSI-H |  |
| Colorectum | FAP |  |
| ∗Top 15 enriched GO BP terms are showed in the bar plot of each disease state in each tissue. Each row represents a significant GO biological process which is colored according to the -log10(p.adjust). |
| Page: 1 2 3 4 5 6 7 8 9 |
| GO ID | Tissue | Disease Stage | Description | Gene Ratio | Bg Ratio | pvalue | p.adjust | Count |
| GO:00018956 | Breast | Precancer | retina homeostasis | 12/1080 | 79/18723 | 1.82e-03 | 1.79e-02 | 12 |
| GO:00018948 | Breast | Precancer | tissue homeostasis | 27/1080 | 268/18723 | 3.49e-03 | 2.90e-02 | 27 |
| GO:000189511 | Breast | IDC | retina homeostasis | 15/1434 | 79/18723 | 8.62e-04 | 1.00e-02 | 15 |
| GO:000189413 | Breast | IDC | tissue homeostasis | 34/1434 | 268/18723 | 2.54e-03 | 2.28e-02 | 34 |
| GO:000189521 | Breast | DCIS | retina homeostasis | 14/1390 | 79/18723 | 1.88e-03 | 1.81e-02 | 14 |
| GO:000189423 | Breast | DCIS | tissue homeostasis | 33/1390 | 268/18723 | 2.88e-03 | 2.48e-02 | 33 |
| GO:00018949 | Cervix | CC | tissue homeostasis | 57/2311 | 268/18723 | 2.43e-05 | 4.21e-04 | 57 |
| GO:00602498 | Cervix | CC | anatomical structure homeostasis | 63/2311 | 314/18723 | 6.03e-05 | 8.68e-04 | 63 |
| GO:00018957 | Cervix | CC | retina homeostasis | 19/2311 | 79/18723 | 2.94e-03 | 1.94e-02 | 19 |
| GO:000189512 | Cervix | HSIL_HPV | retina homeostasis | 12/737 | 79/18723 | 5.76e-05 | 1.39e-03 | 12 |
| GO:000189414 | Cervix | HSIL_HPV | tissue homeostasis | 25/737 | 268/18723 | 6.17e-05 | 1.46e-03 | 25 |
| GO:006024913 | Cervix | HSIL_HPV | anatomical structure homeostasis | 25/737 | 314/18723 | 7.04e-04 | 9.40e-03 | 25 |
| GO:0060249 | Colorectum | AD | anatomical structure homeostasis | 94/3918 | 314/18723 | 9.37e-05 | 1.42e-03 | 94 |
| GO:0001894 | Colorectum | AD | tissue homeostasis | 81/3918 | 268/18723 | 1.96e-04 | 2.62e-03 | 81 |
| GO:00018941 | Colorectum | SER | tissue homeostasis | 66/2897 | 268/18723 | 5.87e-05 | 1.37e-03 | 66 |
| GO:00602491 | Colorectum | SER | anatomical structure homeostasis | 74/2897 | 314/18723 | 1.01e-04 | 2.13e-03 | 74 |
| GO:00602492 | Colorectum | MSS | anatomical structure homeostasis | 84/3467 | 314/18723 | 1.87e-04 | 2.64e-03 | 84 |
| GO:00018942 | Colorectum | MSS | tissue homeostasis | 72/3467 | 268/18723 | 4.53e-04 | 5.40e-03 | 72 |
| GO:006024910 | Prostate | BPH | anatomical structure homeostasis | 68/3107 | 314/18723 | 1.10e-02 | 4.53e-02 | 68 |
| GO:000189416 | Prostate | Tumor | tissue homeostasis | 65/3246 | 268/18723 | 2.39e-03 | 1.35e-02 | 65 |
| Page: 1 2 |
| Pathway ID | Tissue | Disease Stage | Description | Gene Ratio | Bg Ratio | pvalue | p.adjust | qvalue | Count |
| Page: 1 |
Top |
Cell-cell communication analysis |
| Identification of potential cell-cell interactions between two cell types and their ligand-receptor pairs for different disease states |
| Ligand | Receptor | LRpair | Pathway | Tissue | Disease Stage |
| Page: 1 |
Top |
Single-cell gene regulatory network inference analysis |
| Find out the significant the regulons (TFs) and the target genes of each regulon across cell types for different disease states |
| TF | Cell Type | Tissue | Disease Stage | Target Gene | RSS | Regulon Activity |
| ∗The dot plots of a searched regulon are shown for all cell subpopulations in each disease state of each tissue based on the regulon specific score inferred using pySCENIC and by calculating the average expression. |
| Page: 1 |
Top |
Somatic mutation of malignant transformation related genes |
| Annotation of somatic variants for genes involved in malignant transformation |
| Hugo Symbol | Variant Class | Variant Classification | dbSNP RS | HGVSc | HGVSp | HGVSp Short | SWISSPROT | BIOTYPE | SIFT | PolyPhen | Tumor Sample Barcode | Tissue | Histology | Sex | Age | Stage | Therapy Types | Drugs | Outcome |
| ZG16 | SNV | Missense_Mutation | c.185N>C | p.Val62Ala | p.V62A | O60844 | protein_coding | tolerated(0.16) | benign(0.036) | TCGA-AN-A0XO-01 | Breast | breast invasive carcinoma | Female | <65 | III/IV | Unknown | Unknown | SD | |
| ZG16 | SNV | Missense_Mutation | novel | c.344G>A | p.Gly115Asp | p.G115D | O60844 | protein_coding | deleterious(0.02) | possibly_damaging(0.487) | TCGA-2W-A8YY-01 | Cervix | cervical & endocervical cancer | Female | <65 | I/II | Chemotherapy | cisplatin | CR |
| ZG16 | SNV | Missense_Mutation | novel | c.251N>G | p.Glu84Gly | p.E84G | O60844 | protein_coding | tolerated(0.07) | benign(0.267) | TCGA-A5-A1OF-01 | Endometrium | uterine corpus endometrioid carcinoma | Female | <65 | I/II | Unknown | Unknown | SD |
| ZG16 | SNV | Missense_Mutation | c.114N>A | p.Phe38Leu | p.F38L | O60844 | protein_coding | deleterious(0.04) | probably_damaging(0.92) | TCGA-AP-A0LM-01 | Endometrium | uterine corpus endometrioid carcinoma | Female | <65 | III/IV | Chemotherapy | cisplatin | SD | |
| ZG16 | SNV | Missense_Mutation | novel | c.13G>A | p.Ala5Thr | p.A5T | O60844 | protein_coding | tolerated(0.35) | benign(0.005) | TCGA-AP-A1E0-01 | Endometrium | uterine corpus endometrioid carcinoma | Female | <65 | III/IV | Chemotherapy | paclitaxel | SD |
| ZG16 | SNV | Missense_Mutation | novel | c.13N>A | p.Ala5Thr | p.A5T | O60844 | protein_coding | tolerated(0.35) | benign(0.005) | TCGA-AX-A1CE-01 | Endometrium | uterine corpus endometrioid carcinoma | Female | <65 | I/II | Unspecific | Paclitaxel | SD |
| ZG16 | SNV | Missense_Mutation | c.367N>A | p.Asp123Asn | p.D123N | O60844 | protein_coding | tolerated(0.34) | benign(0.007) | TCGA-D1-A101-01 | Endometrium | uterine corpus endometrioid carcinoma | Female | <65 | I/II | Unknown | Unknown | SD | |
| ZG16 | SNV | Missense_Mutation | c.391G>A | p.Val131Ile | p.V131I | O60844 | protein_coding | tolerated(0.57) | benign(0) | TCGA-D1-A103-01 | Endometrium | uterine corpus endometrioid carcinoma | Female | >=65 | I/II | Unknown | Unknown | SD | |
| ZG16 | insertion | Frame_Shift_Ins | novel | c.40dupG | p.Ala14GlyfsTer14 | p.A14Gfs*14 | O60844 | protein_coding | TCGA-A5-A0R9-01 | Endometrium | uterine corpus endometrioid carcinoma | Female | <65 | I/II | Unknown | Unknown | SD | ||
| ZG16 | insertion | Nonsense_Mutation | novel | c.43_44insGAAGATGAACT | p.Ser15Ter | p.S15* | O60844 | protein_coding | TCGA-A5-A0R9-01 | Endometrium | uterine corpus endometrioid carcinoma | Female | <65 | I/II | Unknown | Unknown | SD |
| Page: 1 2 |
Top |
Related drugs of malignant transformation related genes |
| Identification of chemicals and drugs interact with genes involved in malignant transfromation |
| (DGIdb 4.0) |
| Entrez ID | Symbol | Category | Interaction Types | Drug Claim Name | Drug Name | PMIDs |
| Page: 1 |

Copyright 2023-Present -The University of Texas Health Science Center at Houston |