
|
|||||
|
 | |
| |
| |
| |
| |
| |
|
Gene: ZFYVE19 |
Gene summary for ZFYVE19 |
| Gene information | Species | Human | Gene symbol | ZFYVE19 | Gene ID | 84936 |
| Gene name | zinc finger FYVE-type containing 19 | |
| Gene Alias | ANCHR | |
| Cytomap | 15q15.1 | |
| Gene Type | protein-coding | GO ID | GO:0000075 | UniProtAcc | Q96K21 |
Top |
Malignant transformation analysis |
| Identification of the aberrant gene expression in precancerous and cancerous lesions by comparing the gene expression of stem-like cells in diseased tissues with normal stem cells |
| Entrez ID | Symbol | Replicates | Species | Organ | Tissue | Adj P-value | Log2FC | Malignancy |
| 84936 | ZFYVE19 | LZE4T | Human | Esophagus | ESCC | 1.98e-06 | 2.12e-01 | 0.0811 |
| 84936 | ZFYVE19 | LZE7T | Human | Esophagus | ESCC | 2.12e-07 | 2.71e-01 | 0.0667 |
| 84936 | ZFYVE19 | LZE8T | Human | Esophagus | ESCC | 1.05e-02 | 1.49e-01 | 0.067 |
| 84936 | ZFYVE19 | LZE20T | Human | Esophagus | ESCC | 7.24e-03 | 1.01e-01 | 0.0662 |
| 84936 | ZFYVE19 | LZE24T | Human | Esophagus | ESCC | 3.48e-06 | 1.62e-01 | 0.0596 |
| 84936 | ZFYVE19 | P1T-E | Human | Esophagus | ESCC | 8.77e-07 | 3.52e-01 | 0.0875 |
| 84936 | ZFYVE19 | P2T-E | Human | Esophagus | ESCC | 1.48e-05 | 1.26e-01 | 0.1177 |
| 84936 | ZFYVE19 | P4T-E | Human | Esophagus | ESCC | 2.25e-11 | 2.68e-01 | 0.1323 |
| 84936 | ZFYVE19 | P5T-E | Human | Esophagus | ESCC | 6.34e-07 | 1.65e-01 | 0.1327 |
| 84936 | ZFYVE19 | P8T-E | Human | Esophagus | ESCC | 4.92e-25 | 3.77e-01 | 0.0889 |
| 84936 | ZFYVE19 | P9T-E | Human | Esophagus | ESCC | 6.91e-07 | 2.36e-01 | 0.1131 |
| 84936 | ZFYVE19 | P10T-E | Human | Esophagus | ESCC | 5.88e-17 | 2.63e-01 | 0.116 |
| 84936 | ZFYVE19 | P11T-E | Human | Esophagus | ESCC | 4.30e-06 | 2.93e-01 | 0.1426 |
| 84936 | ZFYVE19 | P12T-E | Human | Esophagus | ESCC | 5.69e-15 | 3.00e-01 | 0.1122 |
| 84936 | ZFYVE19 | P15T-E | Human | Esophagus | ESCC | 9.91e-15 | 2.91e-01 | 0.1149 |
| 84936 | ZFYVE19 | P16T-E | Human | Esophagus | ESCC | 4.03e-10 | 1.60e-01 | 0.1153 |
| 84936 | ZFYVE19 | P17T-E | Human | Esophagus | ESCC | 2.45e-07 | 3.00e-01 | 0.1278 |
| 84936 | ZFYVE19 | P20T-E | Human | Esophagus | ESCC | 9.26e-18 | 2.78e-01 | 0.1124 |
| 84936 | ZFYVE19 | P21T-E | Human | Esophagus | ESCC | 4.22e-10 | 2.45e-01 | 0.1617 |
| 84936 | ZFYVE19 | P22T-E | Human | Esophagus | ESCC | 1.73e-12 | 2.31e-01 | 0.1236 |
| Page: 1 2 3 4 5 |
| Tissue | Expression Dynamics | Abbreviation |
| Esophagus | 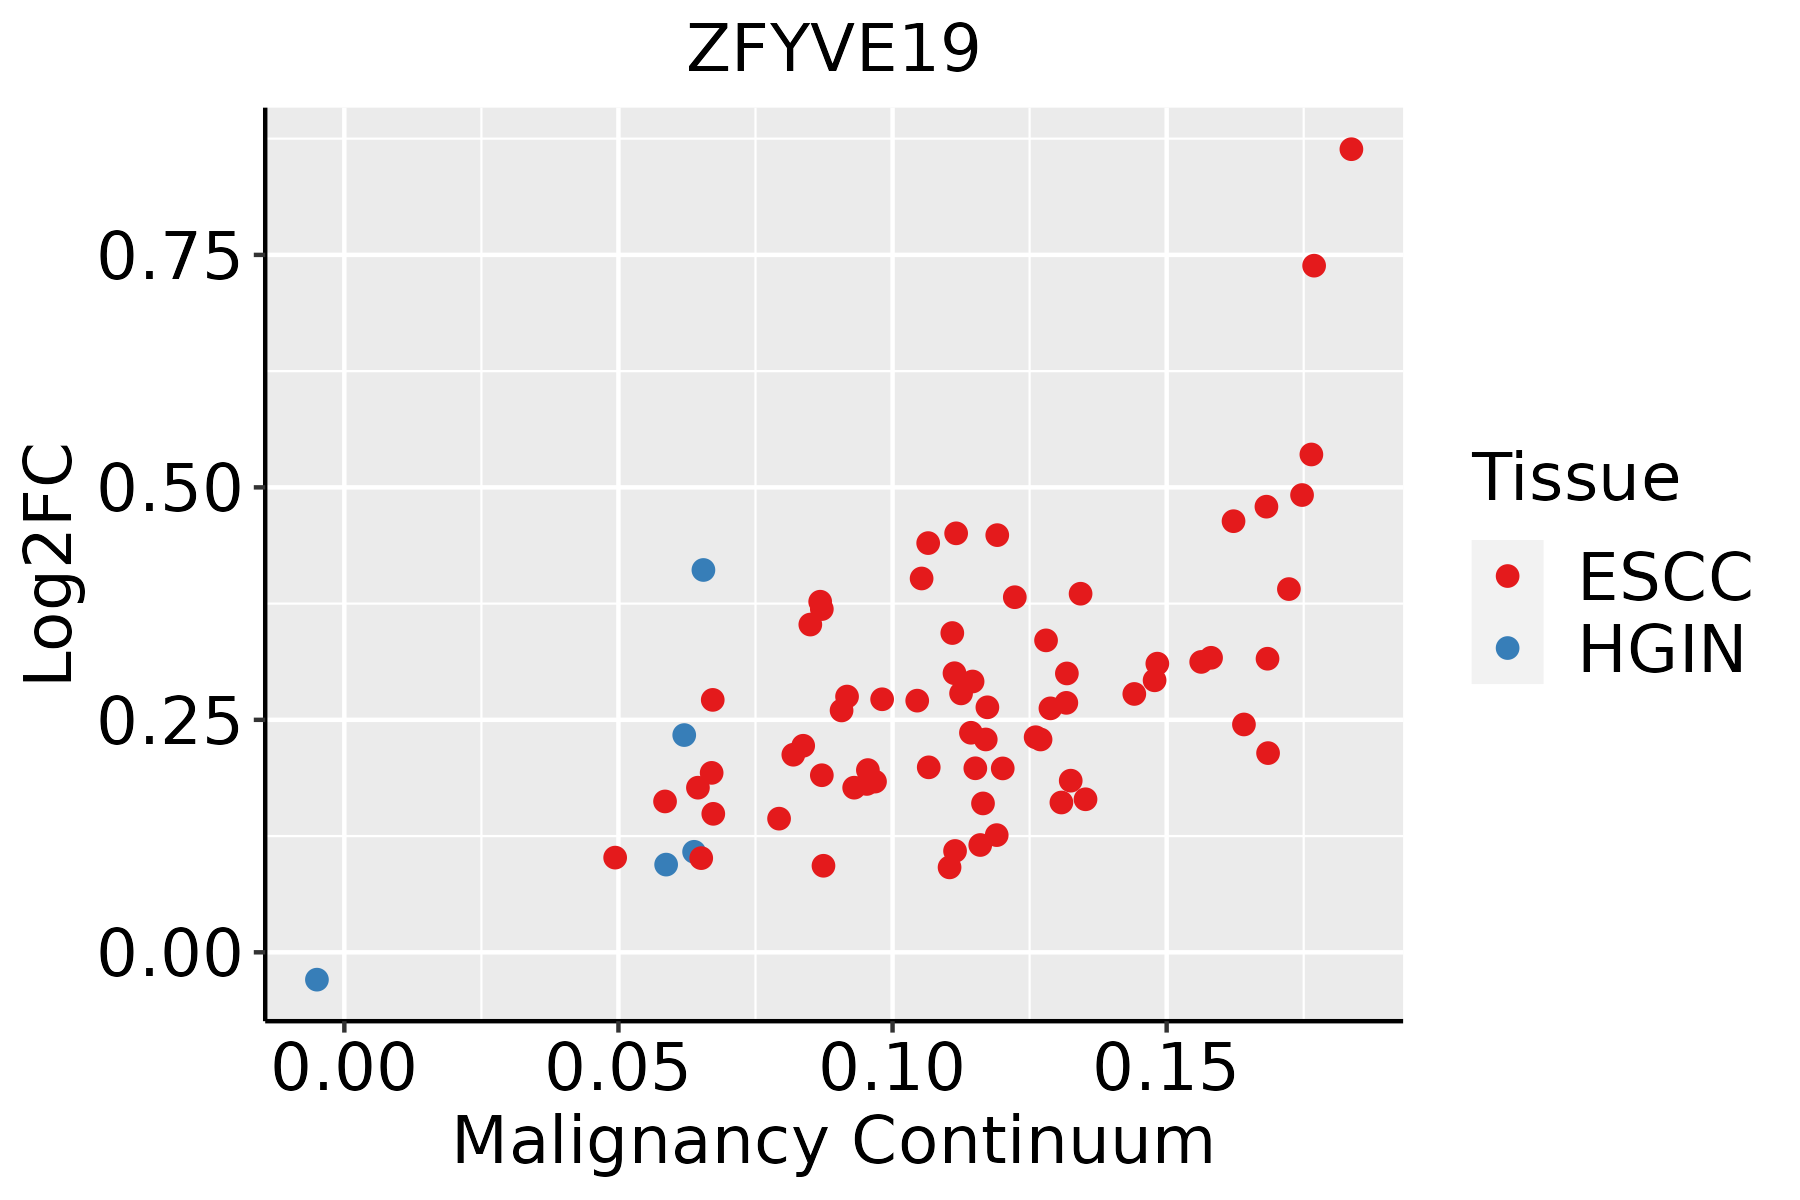 | ESCC: Esophageal squamous cell carcinoma |
| HGIN: High-grade intraepithelial neoplasias | ||
| LGIN: Low-grade intraepithelial neoplasias | ||
| Liver |  | HCC: Hepatocellular carcinoma |
| NAFLD: Non-alcoholic fatty liver disease | ||
| Oral Cavity | 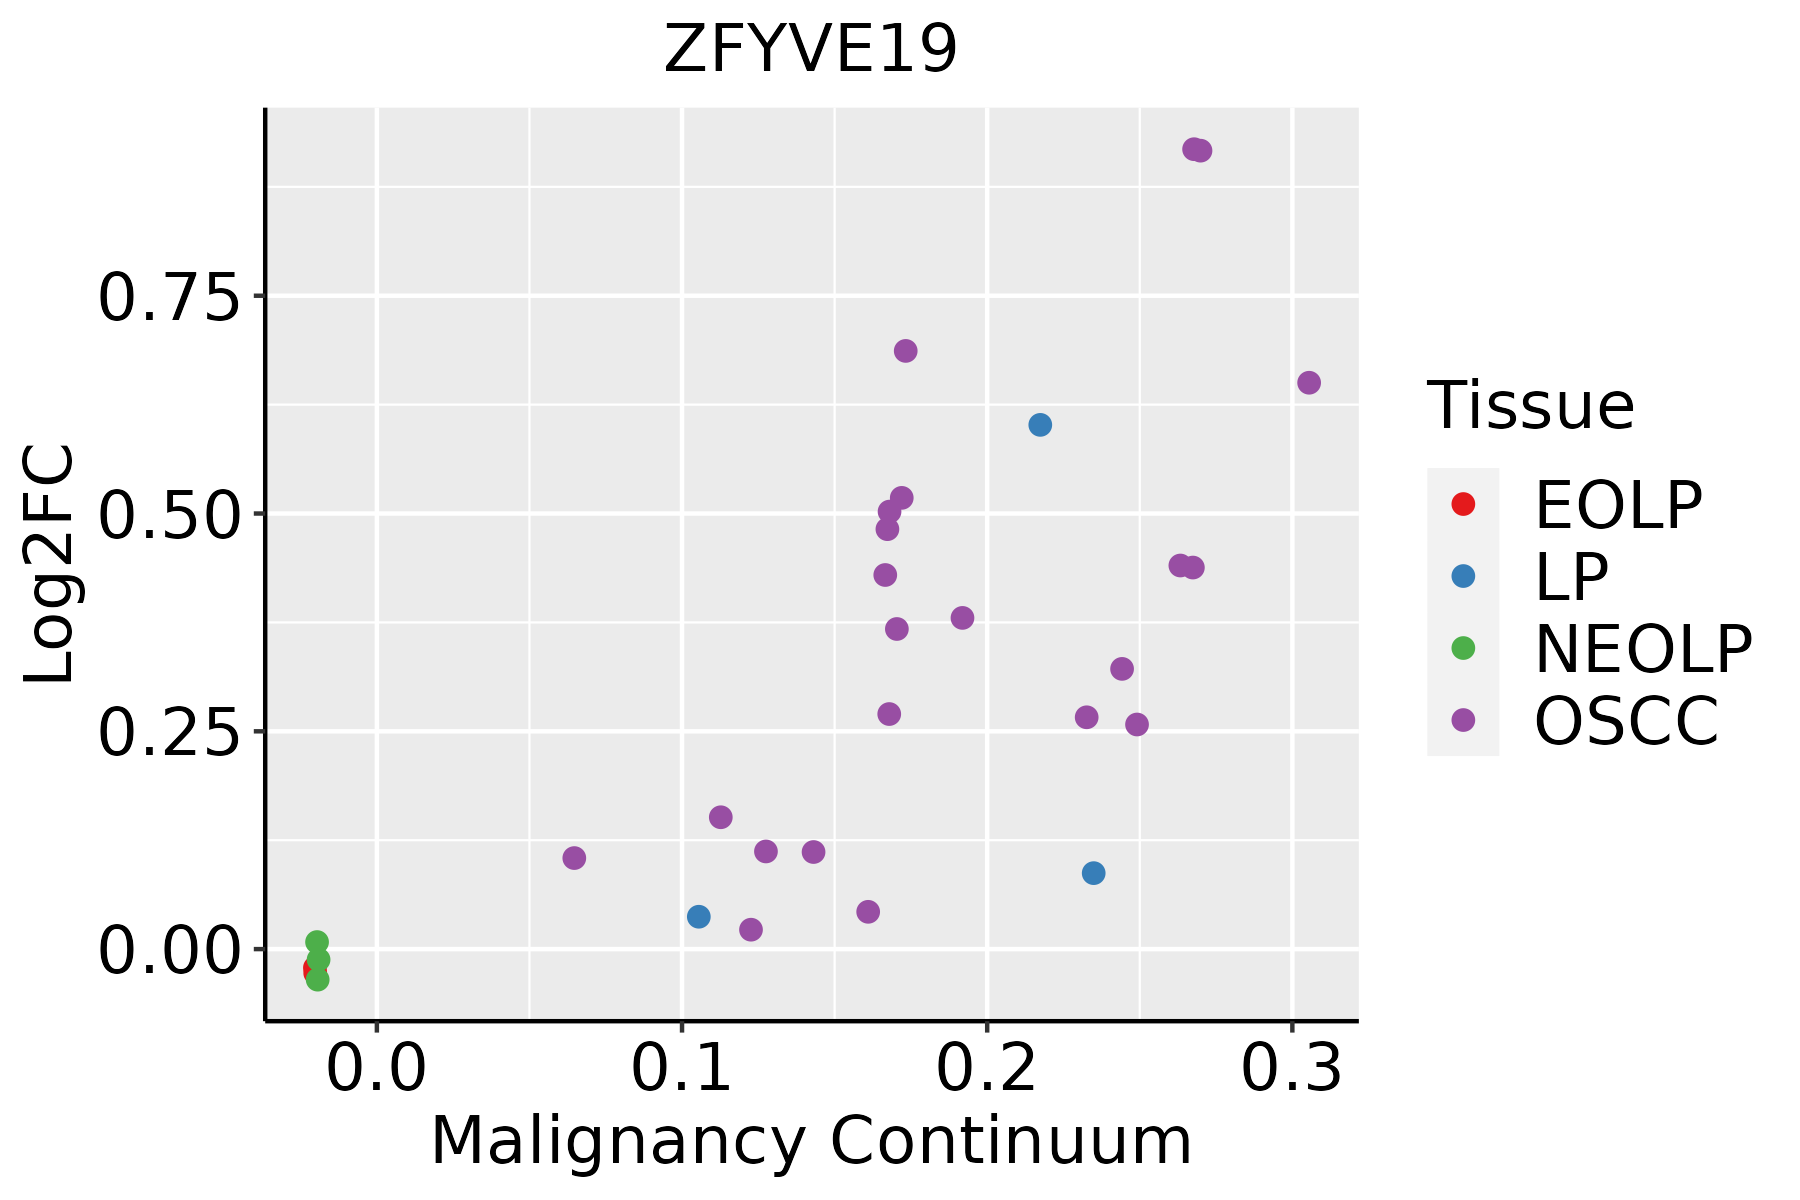 | EOLP: Erosive Oral lichen planus |
| LP: leukoplakia | ||
| NEOLP: Non-erosive oral lichen planus | ||
| OSCC: Oral squamous cell carcinoma |
| ∗log2FC in expression of this searched gene in stem-like cells from each diseased tissue sample relative to stem-like cells in normal samples in each tissue plotted against the malignancy continuum. Samples are colored based on if they are from different disease stage. |
Top |
Malignant transformation related pathway analysis |
| Find out the enriched GO biological processes and KEGG pathways involved in transition from healthy to precancer to cancer |
| Tissue | Disease Stage | Enriched GO biological Processes |
| Colorectum | AD |  |
| Colorectum | SER |  |
| Colorectum | MSS |  |
| Colorectum | MSI-H |  |
| Colorectum | FAP |  |
| ∗Top 15 enriched GO BP terms are showed in the bar plot of each disease state in each tissue. Each row represents a significant GO biological process which is colored according to the -log10(p.adjust). |
| Page: 1 2 3 4 5 6 7 8 9 |
| GO ID | Tissue | Disease Stage | Description | Gene Ratio | Bg Ratio | pvalue | p.adjust | Count |
| GO:004477216 | Esophagus | ESCC | mitotic cell cycle phase transition | 281/8552 | 424/18723 | 4.63e-18 | 4.45e-16 | 281 |
| GO:000734615 | Esophagus | ESCC | regulation of mitotic cell cycle | 293/8552 | 457/18723 | 8.00e-16 | 5.64e-14 | 293 |
| GO:190198713 | Esophagus | ESCC | regulation of cell cycle phase transition | 242/8552 | 390/18723 | 3.86e-11 | 1.26e-09 | 242 |
| GO:190199013 | Esophagus | ESCC | regulation of mitotic cell cycle phase transition | 191/8552 | 299/18723 | 1.35e-10 | 3.94e-09 | 191 |
| GO:00457865 | Esophagus | ESCC | negative regulation of cell cycle | 236/8552 | 385/18723 | 3.62e-10 | 9.93e-09 | 236 |
| GO:00000754 | Esophagus | ESCC | cell cycle checkpoint | 117/8552 | 169/18723 | 4.47e-10 | 1.17e-08 | 117 |
| GO:00448394 | Esophagus | ESCC | cell cycle G2/M phase transition | 103/8552 | 148/18723 | 3.09e-09 | 6.67e-08 | 103 |
| GO:00000864 | Esophagus | ESCC | G2/M transition of mitotic cell cycle | 96/8552 | 137/18723 | 6.00e-09 | 1.23e-07 | 96 |
| GO:000091016 | Esophagus | ESCC | cytokinesis | 115/8552 | 173/18723 | 2.48e-08 | 4.68e-07 | 115 |
| GO:00070934 | Esophagus | ESCC | mitotic cell cycle checkpoint | 90/8552 | 129/18723 | 2.49e-08 | 4.69e-07 | 90 |
| GO:00109484 | Esophagus | ESCC | negative regulation of cell cycle process | 177/8552 | 294/18723 | 3.26e-07 | 4.59e-06 | 177 |
| GO:19019883 | Esophagus | ESCC | negative regulation of cell cycle phase transition | 151/8552 | 249/18723 | 1.28e-06 | 1.57e-05 | 151 |
| GO:004593013 | Esophagus | ESCC | negative regulation of mitotic cell cycle | 143/8552 | 235/18723 | 1.84e-06 | 2.15e-05 | 143 |
| GO:190199113 | Esophagus | ESCC | negative regulation of mitotic cell cycle phase transition | 112/8552 | 179/18723 | 3.69e-06 | 4.03e-05 | 112 |
| GO:00103891 | Esophagus | ESCC | regulation of G2/M transition of mitotic cell cycle | 64/8552 | 94/18723 | 9.21e-06 | 8.82e-05 | 64 |
| GO:19027491 | Esophagus | ESCC | regulation of cell cycle G2/M phase transition | 68/8552 | 102/18723 | 1.48e-05 | 1.33e-04 | 68 |
| GO:00109721 | Esophagus | ESCC | negative regulation of G2/M transition of mitotic cell cycle | 41/8552 | 60/18723 | 3.25e-04 | 1.91e-03 | 41 |
| GO:19027501 | Esophagus | ESCC | negative regulation of cell cycle G2/M phase transition | 42/8552 | 62/18723 | 3.69e-04 | 2.14e-03 | 42 |
| GO:00324653 | Esophagus | ESCC | regulation of cytokinesis | 57/8552 | 92/18723 | 1.20e-03 | 5.88e-03 | 57 |
| GO:00513025 | Esophagus | ESCC | regulation of cell division | 97/8552 | 177/18723 | 8.93e-03 | 3.12e-02 | 97 |
| Page: 1 2 3 |
| Pathway ID | Tissue | Disease Stage | Description | Gene Ratio | Bg Ratio | pvalue | p.adjust | qvalue | Count |
| Page: 1 |
Top |
Cell-cell communication analysis |
| Identification of potential cell-cell interactions between two cell types and their ligand-receptor pairs for different disease states |
| Ligand | Receptor | LRpair | Pathway | Tissue | Disease Stage |
| Page: 1 |
Top |
Single-cell gene regulatory network inference analysis |
| Find out the significant the regulons (TFs) and the target genes of each regulon across cell types for different disease states |
| TF | Cell Type | Tissue | Disease Stage | Target Gene | RSS | Regulon Activity |
| ∗The dot plots of a searched regulon are shown for all cell subpopulations in each disease state of each tissue based on the regulon specific score inferred using pySCENIC and by calculating the average expression. |
| Page: 1 |
Top |
Somatic mutation of malignant transformation related genes |
| Annotation of somatic variants for genes involved in malignant transformation |
| Hugo Symbol | Variant Class | Variant Classification | dbSNP RS | HGVSc | HGVSp | HGVSp Short | SWISSPROT | BIOTYPE | SIFT | PolyPhen | Tumor Sample Barcode | Tissue | Histology | Sex | Age | Stage | Therapy Types | Drugs | Outcome |
| ZFYVE19 | SNV | Missense_Mutation | c.218N>C | p.Gly73Ala | p.G73A | Q96K21 | protein_coding | tolerated_low_confidence(0.45) | benign(0.01) | TCGA-AC-A23C-01 | Breast | breast invasive carcinoma | Female | <65 | I/II | Chemotherapy | chemo | CR | |
| ZFYVE19 | SNV | Missense_Mutation | c.299G>A | p.Gly100Asp | p.G100D | Q96K21 | protein_coding | deleterious(0.01) | probably_damaging(0.998) | TCGA-AN-A0AK-01 | Breast | breast invasive carcinoma | Female | >=65 | I/II | Unknown | Unknown | SD | |
| ZFYVE19 | SNV | Missense_Mutation | c.89G>T | p.Gly30Val | p.G30V | Q96K21 | protein_coding | deleterious_low_confidence(0) | benign(0.011) | TCGA-BH-A1EY-01 | Breast | breast invasive carcinoma | Female | >=65 | I/II | Unknown | Unknown | PD | |
| ZFYVE19 | SNV | Missense_Mutation | c.1063G>A | p.Asp355Asn | p.D355N | Q96K21 | protein_coding | tolerated(0.1) | possibly_damaging(0.462) | TCGA-EW-A1J5-01 | Breast | breast invasive carcinoma | Female | <65 | I/II | Chemotherapy | adriamycin | SD | |
| ZFYVE19 | insertion | Nonsense_Mutation | novel | c.1315_1316insCTCCAGGACTATCGCCTCCCAGACAGTGATGACGACGAGGA | p.Leu439ProfsTer10 | p.L439Pfs*10 | Q96K21 | protein_coding | TCGA-A8-A06P-01 | Breast | breast invasive carcinoma | Female | <65 | III/IV | Unspecific | SD | |||
| ZFYVE19 | insertion | Frame_Shift_Ins | novel | c.1097_1098insGATCAACGTTATA | p.Val367IlefsTer11 | p.V367Ifs*11 | Q96K21 | protein_coding | TCGA-A8-A07R-01 | Breast | breast invasive carcinoma | Female | >=65 | III/IV | Ancillary | zoledronic | SD | ||
| ZFYVE19 | insertion | In_Frame_Ins | novel | c.1099_1100insAGTTACCAT | p.Val367delinsGluLeuProPhe | p.V367delinsELPF | Q96K21 | protein_coding | TCGA-A8-A07R-01 | Breast | breast invasive carcinoma | Female | >=65 | III/IV | Ancillary | zoledronic | SD | ||
| ZFYVE19 | insertion | Frame_Shift_Ins | novel | c.1088_1089insGGCCCAGGGAGCACTAATT | p.Ile364AlafsTer16 | p.I364Afs*16 | Q96K21 | protein_coding | TCGA-AN-A0FV-01 | Breast | breast invasive carcinoma | Female | <65 | I/II | Unknown | Unknown | SD | ||
| ZFYVE19 | SNV | Missense_Mutation | novel | c.134G>T | p.Arg45Met | p.R45M | Q96K21 | protein_coding | deleterious_low_confidence(0.05) | benign(0.113) | TCGA-5M-AAT6-01 | Colorectum | colon adenocarcinoma | Female | <65 | III/IV | Unknown | Unknown | PD |
| ZFYVE19 | SNV | Missense_Mutation | novel | c.169N>T | p.Pro57Ser | p.P57S | Q96K21 | protein_coding | tolerated_low_confidence(0.65) | benign(0.001) | TCGA-AA-A00N-01 | Colorectum | colon adenocarcinoma | Male | >=65 | I/II | Unknown | Unknown | PD |
| Page: 1 2 3 |
Top |
Related drugs of malignant transformation related genes |
| Identification of chemicals and drugs interact with genes involved in malignant transfromation |
| (DGIdb 4.0) |
| Entrez ID | Symbol | Category | Interaction Types | Drug Claim Name | Drug Name | PMIDs |
| Page: 1 |

Copyright 2023-Present -The University of Texas Health Science Center at Houston |