
|
|||||
|
 | |
| |
| |
| |
| |
| |
|
Gene: ZFYVE16 |
Gene summary for ZFYVE16 |
| Gene information | Species | Human | Gene symbol | ZFYVE16 | Gene ID | 9765 |
| Gene name | zinc finger FYVE-type containing 16 | |
| Gene Alias | PPP1R69 | |
| Cytomap | 5q14.1 | |
| Gene Type | protein-coding | GO ID | GO:0006605 | UniProtAcc | Q7Z3T8 |
Top |
Malignant transformation analysis |
| Identification of the aberrant gene expression in precancerous and cancerous lesions by comparing the gene expression of stem-like cells in diseased tissues with normal stem cells |
| Entrez ID | Symbol | Replicates | Species | Organ | Tissue | Adj P-value | Log2FC | Malignancy |
| 9765 | ZFYVE16 | LZE5T | Human | Esophagus | ESCC | 5.47e-05 | 3.25e-01 | 0.0514 |
| 9765 | ZFYVE16 | LZE7T | Human | Esophagus | ESCC | 1.78e-02 | 2.11e-01 | 0.0667 |
| 9765 | ZFYVE16 | LZE8T | Human | Esophagus | ESCC | 2.87e-04 | 1.52e-01 | 0.067 |
| 9765 | ZFYVE16 | LZE20T | Human | Esophagus | ESCC | 1.29e-03 | 1.38e-01 | 0.0662 |
| 9765 | ZFYVE16 | LZE24T | Human | Esophagus | ESCC | 4.50e-11 | 2.28e-01 | 0.0596 |
| 9765 | ZFYVE16 | P1T-E | Human | Esophagus | ESCC | 1.72e-04 | 1.85e-01 | 0.0875 |
| 9765 | ZFYVE16 | P2T-E | Human | Esophagus | ESCC | 1.83e-19 | 2.79e-01 | 0.1177 |
| 9765 | ZFYVE16 | P4T-E | Human | Esophagus | ESCC | 4.90e-05 | 1.65e-01 | 0.1323 |
| 9765 | ZFYVE16 | P8T-E | Human | Esophagus | ESCC | 3.06e-17 | 2.01e-01 | 0.0889 |
| 9765 | ZFYVE16 | P9T-E | Human | Esophagus | ESCC | 1.10e-10 | 2.15e-01 | 0.1131 |
| 9765 | ZFYVE16 | P10T-E | Human | Esophagus | ESCC | 1.09e-14 | 1.52e-01 | 0.116 |
| 9765 | ZFYVE16 | P11T-E | Human | Esophagus | ESCC | 1.41e-02 | 2.42e-01 | 0.1426 |
| 9765 | ZFYVE16 | P12T-E | Human | Esophagus | ESCC | 1.62e-18 | 3.15e-01 | 0.1122 |
| 9765 | ZFYVE16 | P15T-E | Human | Esophagus | ESCC | 4.32e-08 | 2.25e-01 | 0.1149 |
| 9765 | ZFYVE16 | P16T-E | Human | Esophagus | ESCC | 2.33e-09 | 1.64e-01 | 0.1153 |
| 9765 | ZFYVE16 | P19T-E | Human | Esophagus | ESCC | 2.04e-02 | 3.68e-01 | 0.1662 |
| 9765 | ZFYVE16 | P20T-E | Human | Esophagus | ESCC | 7.36e-09 | 1.71e-01 | 0.1124 |
| 9765 | ZFYVE16 | P21T-E | Human | Esophagus | ESCC | 1.48e-13 | 1.86e-01 | 0.1617 |
| 9765 | ZFYVE16 | P22T-E | Human | Esophagus | ESCC | 6.20e-08 | 1.60e-01 | 0.1236 |
| 9765 | ZFYVE16 | P23T-E | Human | Esophagus | ESCC | 1.43e-09 | 2.73e-01 | 0.108 |
| Page: 1 2 3 4 5 |
| Tissue | Expression Dynamics | Abbreviation |
| Esophagus | 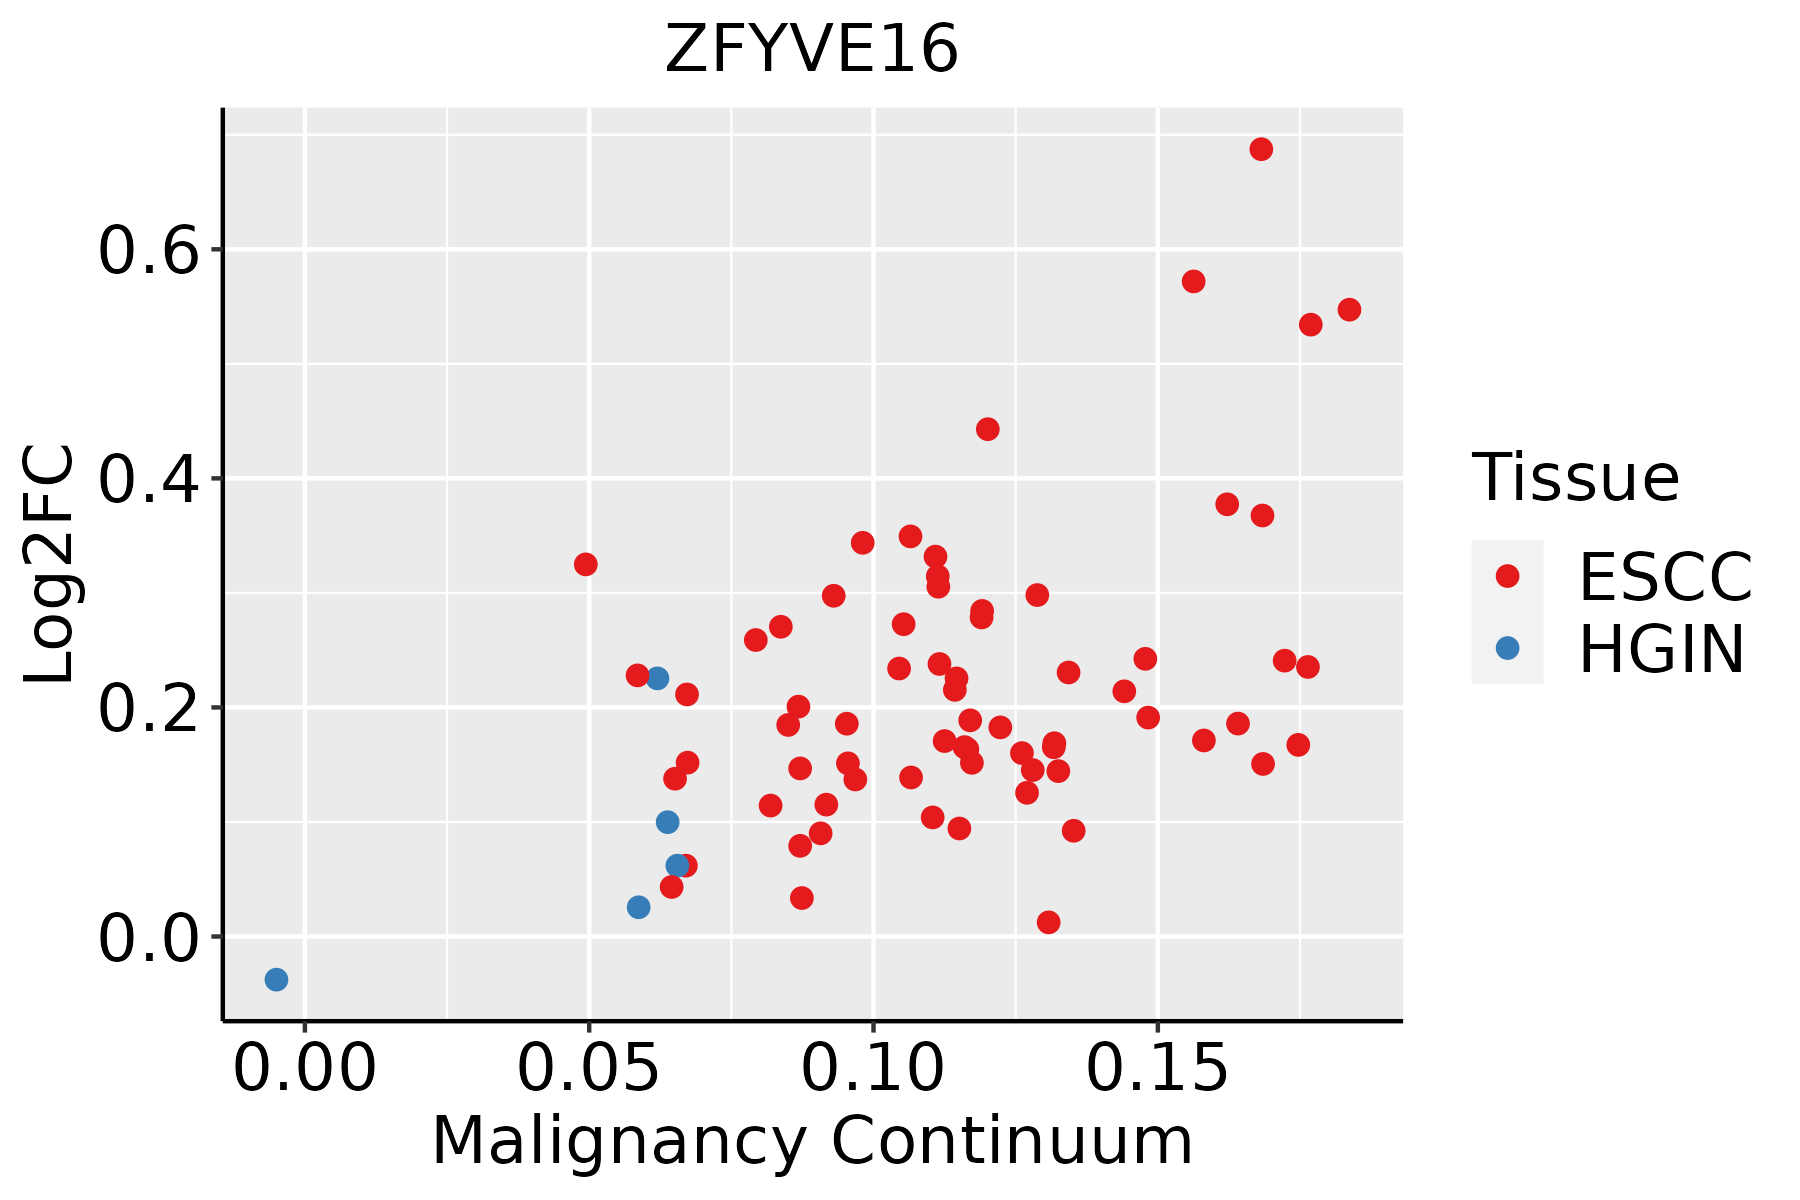 | ESCC: Esophageal squamous cell carcinoma |
| HGIN: High-grade intraepithelial neoplasias | ||
| LGIN: Low-grade intraepithelial neoplasias | ||
| Liver | 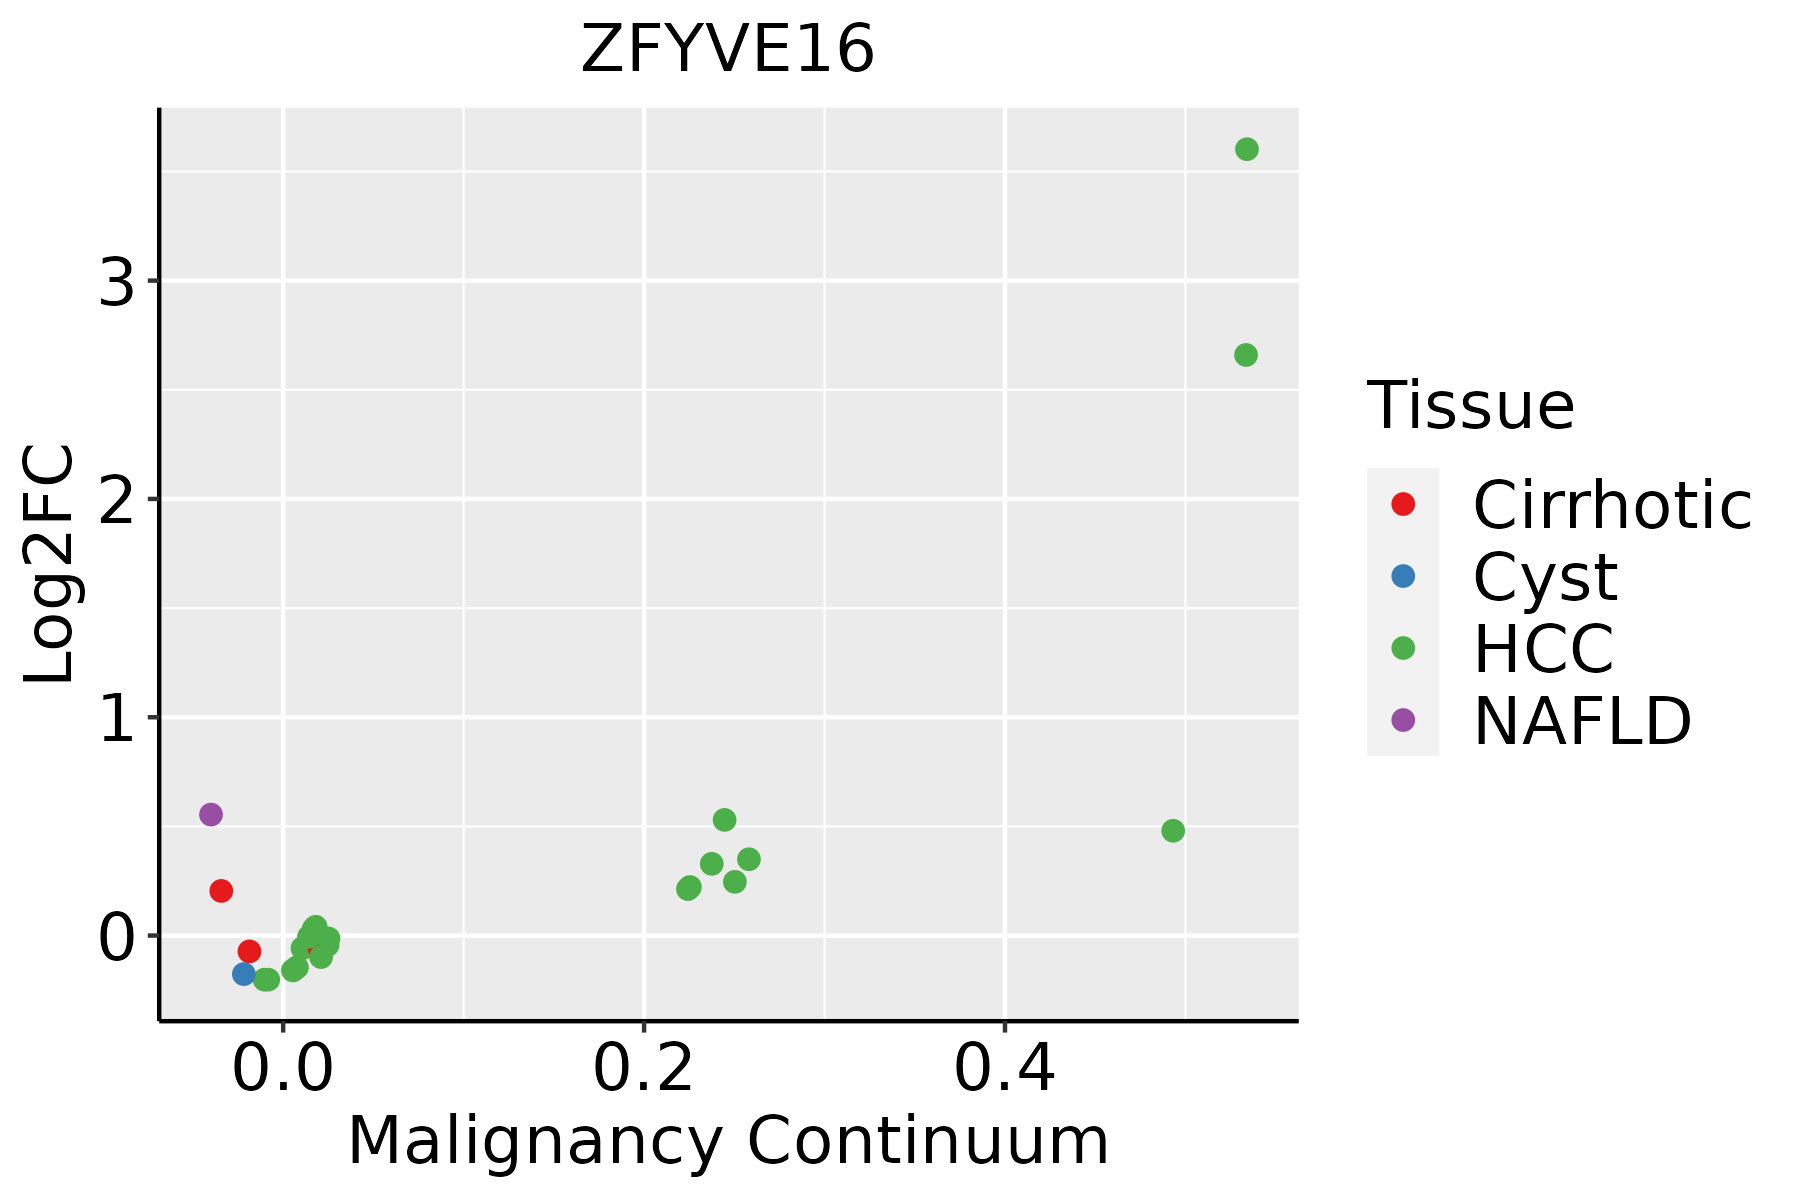 | HCC: Hepatocellular carcinoma |
| NAFLD: Non-alcoholic fatty liver disease | ||
| Thyroid | 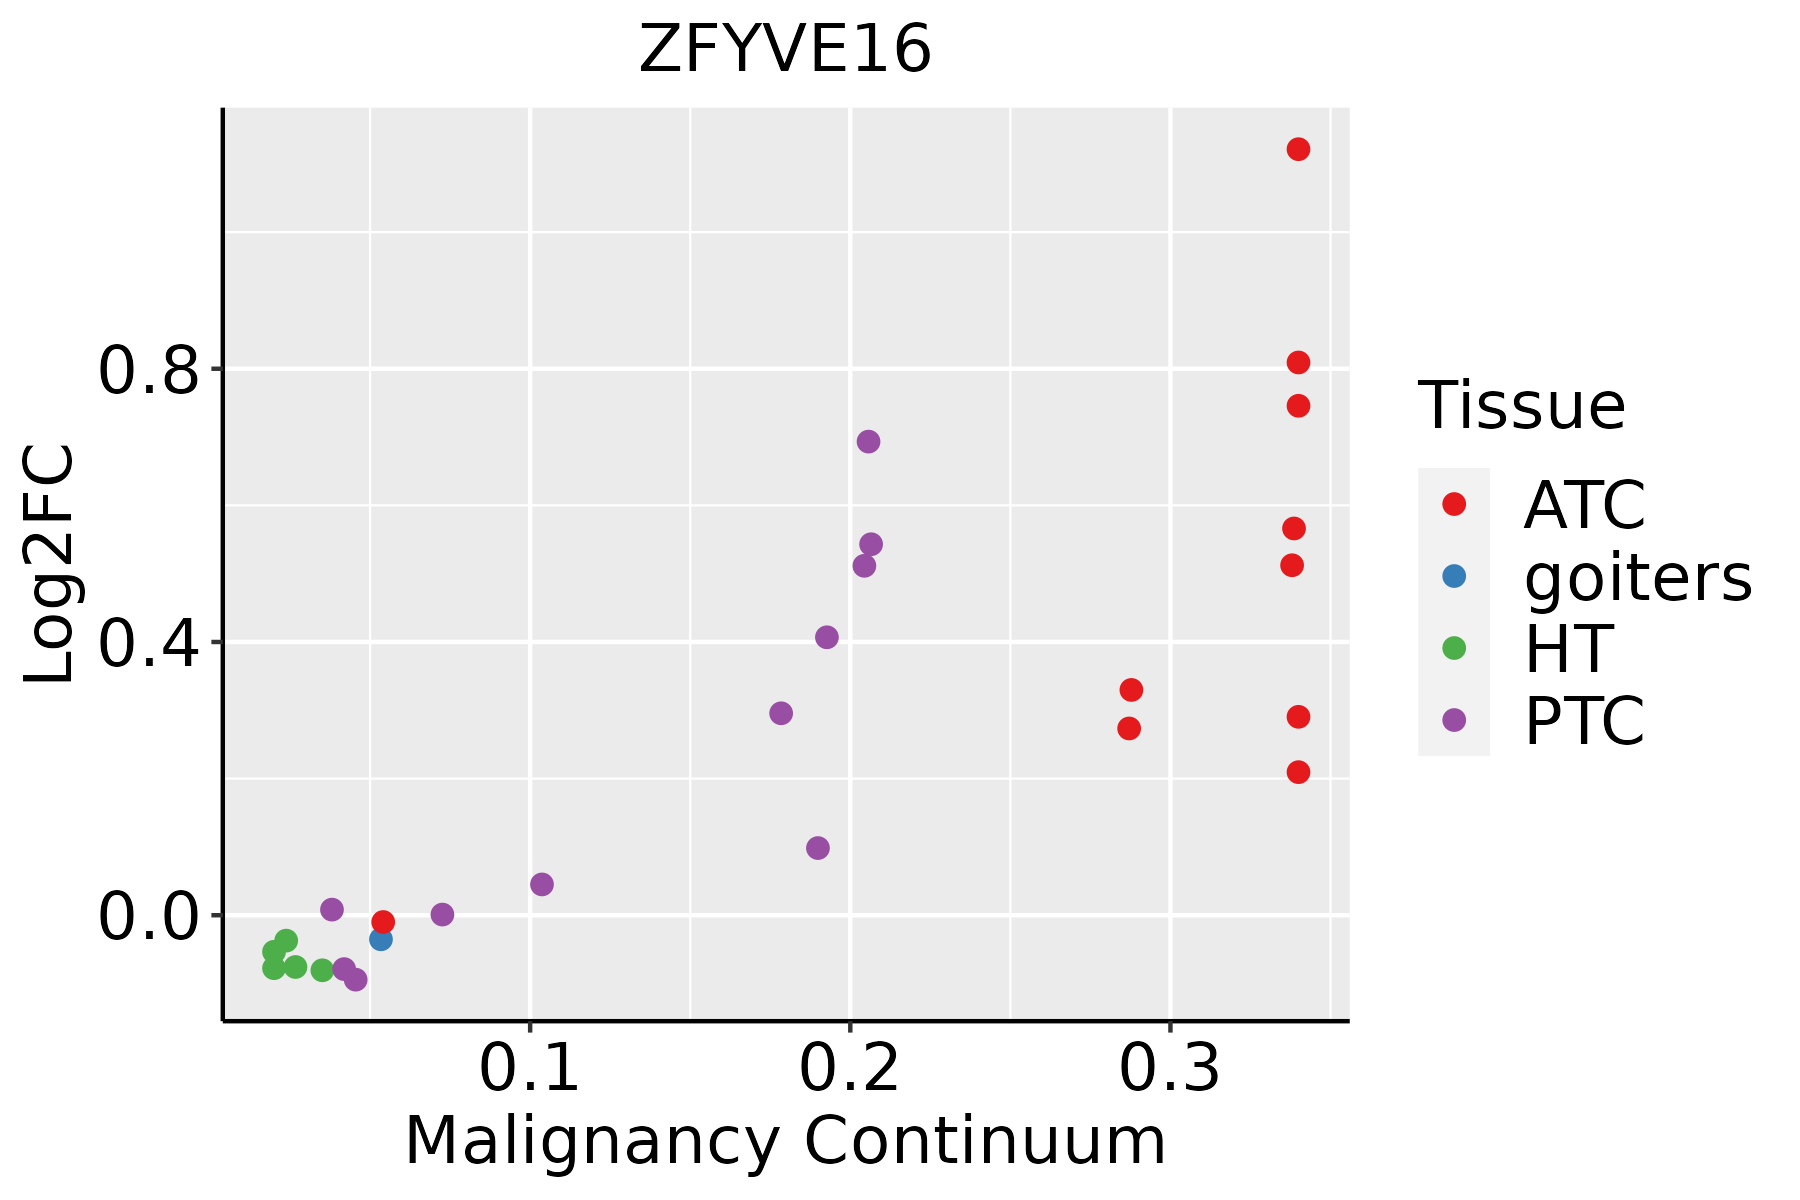 | ATC: Anaplastic thyroid cancer |
| HT: Hashimoto's thyroiditis | ||
| PTC: Papillary thyroid cancer |
| ∗log2FC in expression of this searched gene in stem-like cells from each diseased tissue sample relative to stem-like cells in normal samples in each tissue plotted against the malignancy continuum. Samples are colored based on if they are from different disease stage. |
Top |
Malignant transformation related pathway analysis |
| Find out the enriched GO biological processes and KEGG pathways involved in transition from healthy to precancer to cancer |
| Tissue | Disease Stage | Enriched GO biological Processes |
| Colorectum | AD |  |
| Colorectum | SER |  |
| Colorectum | MSS |  |
| Colorectum | MSI-H |  |
| Colorectum | FAP |  |
| ∗Top 15 enriched GO BP terms are showed in the bar plot of each disease state in each tissue. Each row represents a significant GO biological process which is colored according to the -log10(p.adjust). |
| Page: 1 2 3 4 5 6 7 8 9 |
| GO ID | Tissue | Disease Stage | Description | Gene Ratio | Bg Ratio | pvalue | p.adjust | Count |
| GO:0072594110 | Esophagus | ESCC | establishment of protein localization to organelle | 311/8552 | 422/18723 | 3.02e-32 | 2.13e-29 | 311 |
| GO:0006605111 | Esophagus | ESCC | protein targeting | 229/8552 | 314/18723 | 4.93e-23 | 1.01e-20 | 229 |
| GO:001605014 | Esophagus | ESCC | vesicle organization | 211/8552 | 300/18723 | 2.85e-18 | 2.87e-16 | 211 |
| GO:001619715 | Esophagus | ESCC | endosomal transport | 168/8552 | 230/18723 | 2.28e-17 | 1.93e-15 | 168 |
| GO:000703417 | Esophagus | ESCC | vacuolar transport | 119/8552 | 157/18723 | 1.16e-14 | 6.30e-13 | 119 |
| GO:00070419 | Esophagus | ESCC | lysosomal transport | 83/8552 | 114/18723 | 3.52e-09 | 7.41e-08 | 83 |
| GO:003010018 | Esophagus | ESCC | regulation of endocytosis | 135/8552 | 211/18723 | 5.75e-08 | 1.02e-06 | 135 |
| GO:00726659 | Esophagus | ESCC | protein localization to vacuole | 52/8552 | 67/18723 | 9.14e-08 | 1.52e-06 | 52 |
| GO:00066238 | Esophagus | ESCC | protein targeting to vacuole | 31/8552 | 37/18723 | 1.95e-06 | 2.26e-05 | 31 |
| GO:00726668 | Esophagus | ESCC | establishment of protein localization to vacuole | 37/8552 | 49/18723 | 2.05e-05 | 1.78e-04 | 37 |
| GO:00066226 | Esophagus | ESCC | protein targeting to lysosome | 20/8552 | 23/18723 | 4.97e-05 | 3.86e-04 | 20 |
| GO:00614626 | Esophagus | ESCC | protein localization to lysosome | 34/8552 | 46/18723 | 9.39e-05 | 6.70e-04 | 34 |
| GO:00066233 | Liver | NAFLD | protein targeting to vacuole | 12/1882 | 37/18723 | 1.73e-04 | 3.08e-03 | 12 |
| GO:00161975 | Liver | NAFLD | endosomal transport | 41/1882 | 230/18723 | 2.02e-04 | 3.53e-03 | 41 |
| GO:00160505 | Liver | NAFLD | vesicle organization | 50/1882 | 300/18723 | 2.42e-04 | 4.06e-03 | 50 |
| GO:00726653 | Liver | NAFLD | protein localization to vacuole | 16/1882 | 67/18723 | 7.94e-04 | 9.90e-03 | 16 |
| GO:00726663 | Liver | NAFLD | establishment of protein localization to vacuole | 13/1882 | 49/18723 | 8.43e-04 | 1.03e-02 | 13 |
| GO:00725947 | Liver | NAFLD | establishment of protein localization to organelle | 62/1882 | 422/18723 | 1.48e-03 | 1.64e-02 | 62 |
| GO:00070345 | Liver | NAFLD | vacuolar transport | 28/1882 | 157/18723 | 1.91e-03 | 1.93e-02 | 28 |
| GO:00070414 | Liver | NAFLD | lysosomal transport | 22/1882 | 114/18723 | 2.03e-03 | 2.02e-02 | 22 |
| Page: 1 2 3 4 |
| Pathway ID | Tissue | Disease Stage | Description | Gene Ratio | Bg Ratio | pvalue | p.adjust | qvalue | Count |
| hsa04144210 | Esophagus | ESCC | Endocytosis | 186/4205 | 251/8465 | 9.74e-16 | 4.66e-14 | 2.39e-14 | 186 |
| hsa043507 | Esophagus | ESCC | TGF-beta signaling pathway | 69/4205 | 108/8465 | 1.92e-03 | 5.54e-03 | 2.84e-03 | 69 |
| hsa0414437 | Esophagus | ESCC | Endocytosis | 186/4205 | 251/8465 | 9.74e-16 | 4.66e-14 | 2.39e-14 | 186 |
| hsa0435014 | Esophagus | ESCC | TGF-beta signaling pathway | 69/4205 | 108/8465 | 1.92e-03 | 5.54e-03 | 2.84e-03 | 69 |
| hsa0414412 | Liver | Cirrhotic | Endocytosis | 119/2530 | 251/8465 | 2.33e-09 | 4.56e-08 | 2.81e-08 | 119 |
| hsa0414413 | Liver | Cirrhotic | Endocytosis | 119/2530 | 251/8465 | 2.33e-09 | 4.56e-08 | 2.81e-08 | 119 |
| hsa0414422 | Liver | HCC | Endocytosis | 178/4020 | 251/8465 | 2.03e-14 | 5.22e-13 | 2.91e-13 | 178 |
| hsa0414432 | Liver | HCC | Endocytosis | 178/4020 | 251/8465 | 2.03e-14 | 5.22e-13 | 2.91e-13 | 178 |
| Page: 1 |
Top |
Cell-cell communication analysis |
| Identification of potential cell-cell interactions between two cell types and their ligand-receptor pairs for different disease states |
| Ligand | Receptor | LRpair | Pathway | Tissue | Disease Stage |
| Page: 1 |
Top |
Single-cell gene regulatory network inference analysis |
| Find out the significant the regulons (TFs) and the target genes of each regulon across cell types for different disease states |
| TF | Cell Type | Tissue | Disease Stage | Target Gene | RSS | Regulon Activity |
| ∗The dot plots of a searched regulon are shown for all cell subpopulations in each disease state of each tissue based on the regulon specific score inferred using pySCENIC and by calculating the average expression. |
| Page: 1 |
Top |
Somatic mutation of malignant transformation related genes |
| Annotation of somatic variants for genes involved in malignant transformation |
| Hugo Symbol | Variant Class | Variant Classification | dbSNP RS | HGVSc | HGVSp | HGVSp Short | SWISSPROT | BIOTYPE | SIFT | PolyPhen | Tumor Sample Barcode | Tissue | Histology | Sex | Age | Stage | Therapy Types | Drugs | Outcome |
| ZFYVE16 | SNV | Missense_Mutation | novel | c.1297N>A | p.Leu433Ile | p.L433I | Q7Z3T8 | protein_coding | tolerated(0.09) | possibly_damaging(0.703) | TCGA-AN-A046-01 | Breast | breast invasive carcinoma | Female | >=65 | I/II | Unknown | Unknown | SD |
| ZFYVE16 | SNV | Missense_Mutation | c.2062A>C | p.Thr688Pro | p.T688P | Q7Z3T8 | protein_coding | tolerated(0.12) | benign(0.001) | TCGA-BH-A0DK-01 | Breast | breast invasive carcinoma | Female | <65 | I/II | Hormone Therapy | tamoxiphen | SD | |
| ZFYVE16 | SNV | Missense_Mutation | novel | c.2477C>G | p.Ser826Cys | p.S826C | Q7Z3T8 | protein_coding | deleterious(0.03) | possibly_damaging(0.765) | TCGA-D8-A1JJ-01 | Breast | breast invasive carcinoma | Female | <65 | I/II | Chemotherapy | doxorubicine | SD |
| ZFYVE16 | insertion | Nonsense_Mutation | novel | c.3670_3671insTCTCCTTGGGCCCCAGTTTCCTTTGTAAATAGAAC | p.Thr1224IlefsTer11 | p.T1224Ifs*11 | Q7Z3T8 | protein_coding | TCGA-A2-A0EO-01 | Breast | breast invasive carcinoma | Female | <65 | I/II | Hormone Therapy | tamoxiphen | SD | ||
| ZFYVE16 | insertion | In_Frame_Ins | novel | c.1956_1957insCTTGAAAAAGTA | p.Leu652_Phe653insLeuGluLysVal | p.L652_F653insLEKV | Q7Z3T8 | protein_coding | TCGA-A8-A08C-01 | Breast | breast invasive carcinoma | Female | >=65 | I/II | Chemotherapy | 5-fluorouracil | CR | ||
| ZFYVE16 | insertion | Nonsense_Mutation | novel | c.2350_2351insTTTCTATGGGCAACCCTT | p.Lys784delinsIleSerMetGlyAsnProTer | p.K784delinsISMGNP* | Q7Z3T8 | protein_coding | TCGA-AR-A0U0-01 | Breast | breast invasive carcinoma | Female | >=65 | I/II | Unknown | Unknown | SD | ||
| ZFYVE16 | deletion | Frame_Shift_Del | c.2841delN | p.Glu948LysfsTer5 | p.E948Kfs*5 | Q7Z3T8 | protein_coding | TCGA-E2-A14W-01 | Breast | breast invasive carcinoma | Male | >=65 | I/II | Chemotherapy | cytoxan | SD | |||
| ZFYVE16 | SNV | Missense_Mutation | novel | c.70G>A | p.Asp24Asn | p.D24N | Q7Z3T8 | protein_coding | deleterious(0) | benign(0.13) | TCGA-2W-A8YY-01 | Cervix | cervical & endocervical cancer | Female | <65 | I/II | Chemotherapy | cisplatin | CR |
| ZFYVE16 | SNV | Missense_Mutation | c.3544N>C | p.Glu1182Gln | p.E1182Q | Q7Z3T8 | protein_coding | deleterious(0) | probably_damaging(0.999) | TCGA-DR-A0ZM-01 | Cervix | cervical & endocervical cancer | Female | <65 | III/IV | Unspecific | Cisplatin | SD | |
| ZFYVE16 | SNV | Missense_Mutation | c.4306C>G | p.Leu1436Val | p.L1436V | Q7Z3T8 | protein_coding | tolerated(0.18) | possibly_damaging(0.908) | TCGA-IR-A3LA-01 | Cervix | cervical & endocervical cancer | Female | <65 | I/II | Chemotherapy | cisplatin | CR |
| Page: 1 2 3 4 5 6 7 8 9 10 11 12 13 14 15 16 17 |
Top |
Related drugs of malignant transformation related genes |
| Identification of chemicals and drugs interact with genes involved in malignant transfromation |
| (DGIdb 4.0) |
| Entrez ID | Symbol | Category | Interaction Types | Drug Claim Name | Drug Name | PMIDs |
| Page: 1 |

Copyright 2023-Present -The University of Texas Health Science Center at Houston |