
|
|||||
|
 | |
| |
| |
| |
| |
| |
|
Gene: ZFYVE1 |
Gene summary for ZFYVE1 |
| Gene information | Species | Human | Gene symbol | ZFYVE1 | Gene ID | 53349 |
| Gene name | zinc finger FYVE-type containing 1 | |
| Gene Alias | DFCP1 | |
| Cytomap | 14q24.2 | |
| Gene Type | protein-coding | GO ID | GO:0006914 | UniProtAcc | Q9HBF4 |
Top |
Malignant transformation analysis |
| Identification of the aberrant gene expression in precancerous and cancerous lesions by comparing the gene expression of stem-like cells in diseased tissues with normal stem cells |
| Entrez ID | Symbol | Replicates | Species | Organ | Tissue | Adj P-value | Log2FC | Malignancy |
| 53349 | ZFYVE1 | LZE4T | Human | Esophagus | ESCC | 1.19e-05 | 1.22e-01 | 0.0811 |
| 53349 | ZFYVE1 | LZE7T | Human | Esophagus | ESCC | 2.81e-02 | 9.93e-02 | 0.0667 |
| 53349 | ZFYVE1 | LZE24T | Human | Esophagus | ESCC | 7.36e-08 | 1.24e-01 | 0.0596 |
| 53349 | ZFYVE1 | P2T-E | Human | Esophagus | ESCC | 8.91e-04 | 8.96e-02 | 0.1177 |
| 53349 | ZFYVE1 | P4T-E | Human | Esophagus | ESCC | 2.90e-03 | 9.60e-02 | 0.1323 |
| 53349 | ZFYVE1 | P5T-E | Human | Esophagus | ESCC | 3.30e-03 | 3.32e-02 | 0.1327 |
| 53349 | ZFYVE1 | P8T-E | Human | Esophagus | ESCC | 3.21e-04 | 1.02e-01 | 0.0889 |
| 53349 | ZFYVE1 | P9T-E | Human | Esophagus | ESCC | 3.76e-05 | 4.69e-02 | 0.1131 |
| 53349 | ZFYVE1 | P10T-E | Human | Esophagus | ESCC | 8.00e-08 | 1.40e-01 | 0.116 |
| 53349 | ZFYVE1 | P11T-E | Human | Esophagus | ESCC | 2.12e-04 | 2.54e-01 | 0.1426 |
| 53349 | ZFYVE1 | P12T-E | Human | Esophagus | ESCC | 5.21e-09 | 1.95e-01 | 0.1122 |
| 53349 | ZFYVE1 | P15T-E | Human | Esophagus | ESCC | 3.72e-18 | 2.96e-01 | 0.1149 |
| 53349 | ZFYVE1 | P16T-E | Human | Esophagus | ESCC | 1.12e-08 | 1.04e-01 | 0.1153 |
| 53349 | ZFYVE1 | P17T-E | Human | Esophagus | ESCC | 3.14e-03 | 1.98e-01 | 0.1278 |
| 53349 | ZFYVE1 | P20T-E | Human | Esophagus | ESCC | 6.52e-10 | 8.07e-02 | 0.1124 |
| 53349 | ZFYVE1 | P23T-E | Human | Esophagus | ESCC | 4.04e-16 | 1.81e-01 | 0.108 |
| 53349 | ZFYVE1 | P24T-E | Human | Esophagus | ESCC | 4.86e-08 | 1.16e-01 | 0.1287 |
| 53349 | ZFYVE1 | P26T-E | Human | Esophagus | ESCC | 2.71e-05 | 1.63e-01 | 0.1276 |
| 53349 | ZFYVE1 | P27T-E | Human | Esophagus | ESCC | 1.66e-12 | 2.45e-01 | 0.1055 |
| 53349 | ZFYVE1 | P28T-E | Human | Esophagus | ESCC | 8.96e-06 | 1.54e-01 | 0.1149 |
| Page: 1 2 3 |
| Tissue | Expression Dynamics | Abbreviation |
| Esophagus | 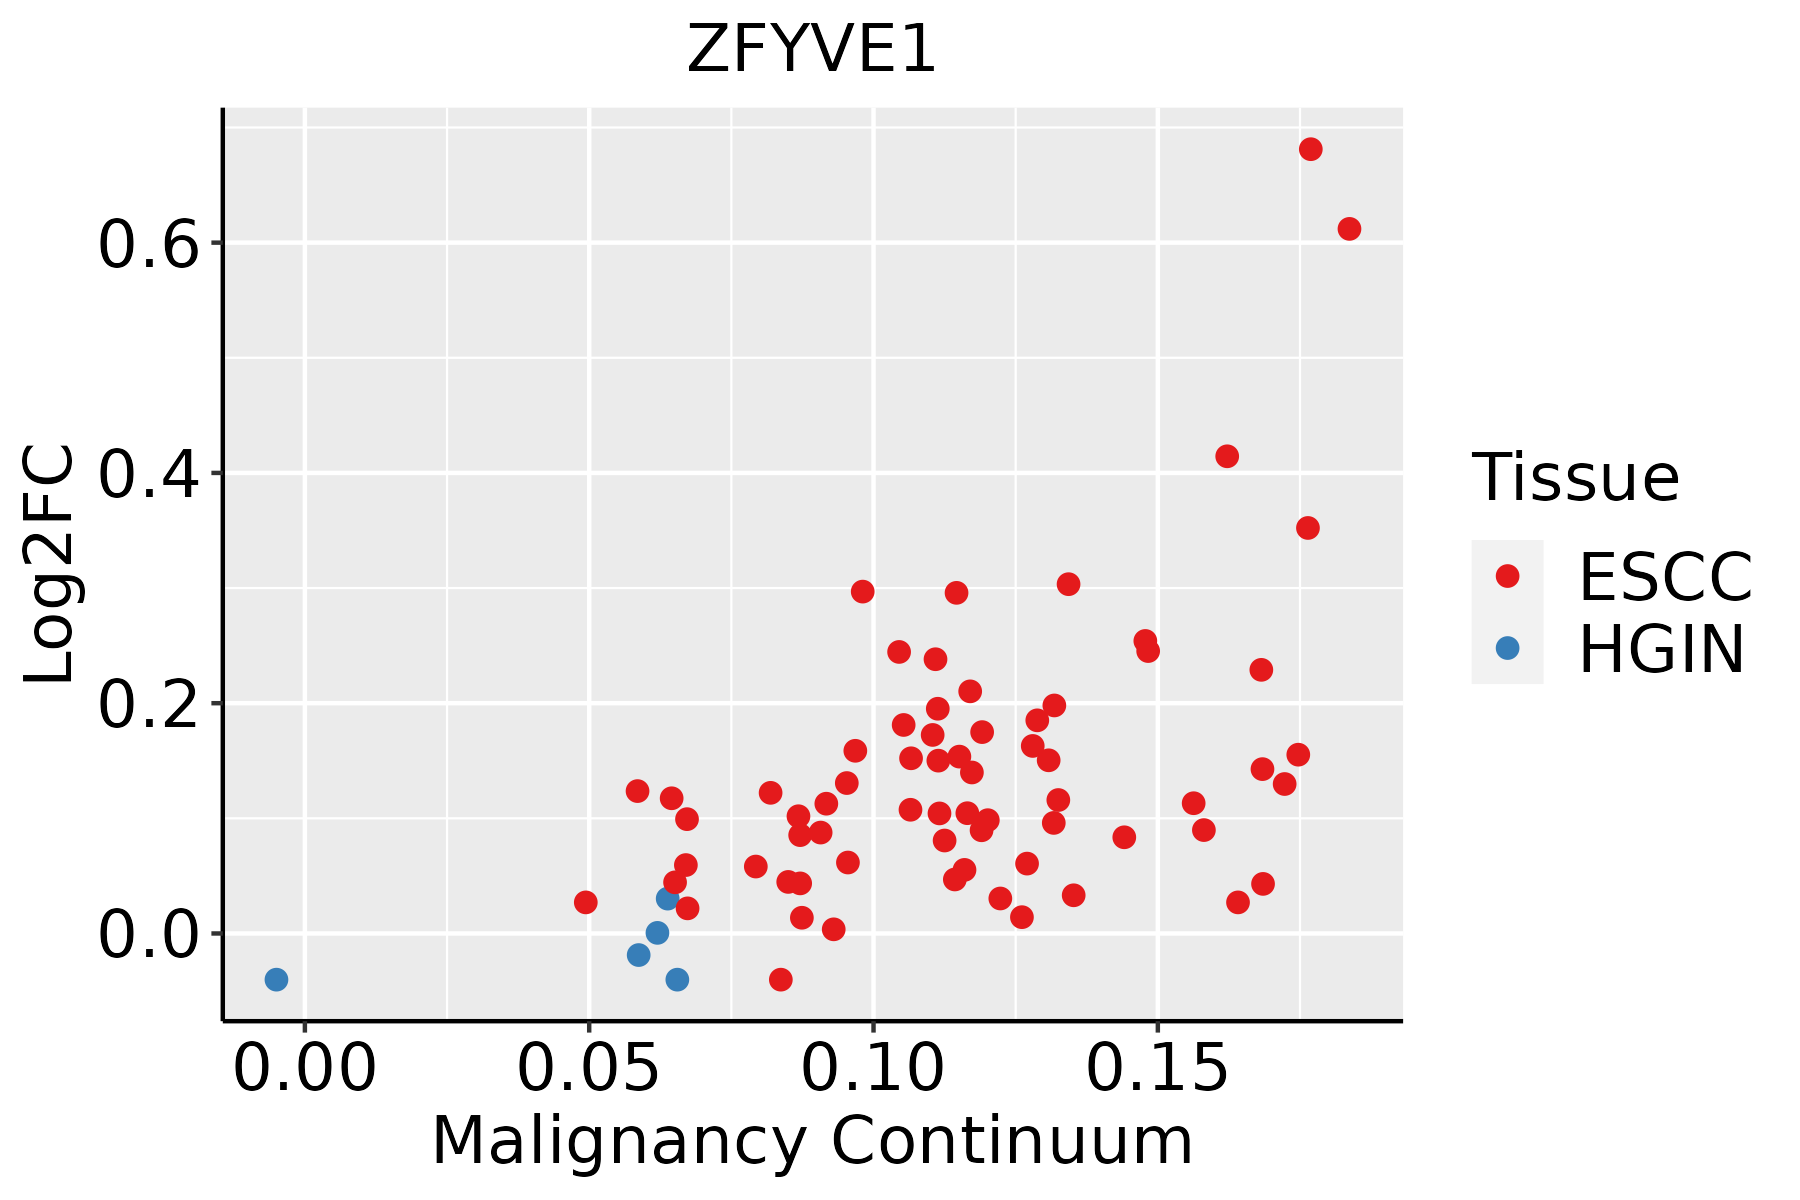 | ESCC: Esophageal squamous cell carcinoma |
| HGIN: High-grade intraepithelial neoplasias | ||
| LGIN: Low-grade intraepithelial neoplasias |
| ∗log2FC in expression of this searched gene in stem-like cells from each diseased tissue sample relative to stem-like cells in normal samples in each tissue plotted against the malignancy continuum. Samples are colored based on if they are from different disease stage. |
Top |
Malignant transformation related pathway analysis |
| Find out the enriched GO biological processes and KEGG pathways involved in transition from healthy to precancer to cancer |
| Tissue | Disease Stage | Enriched GO biological Processes |
| Colorectum | AD |  |
| Colorectum | SER |  |
| Colorectum | MSS |  |
| Colorectum | MSI-H |  |
| Colorectum | FAP |  |
| ∗Top 15 enriched GO BP terms are showed in the bar plot of each disease state in each tissue. Each row represents a significant GO biological process which is colored according to the -log10(p.adjust). |
| Page: 1 2 3 4 5 6 7 8 9 |
| GO ID | Tissue | Disease Stage | Description | Gene Ratio | Bg Ratio | pvalue | p.adjust | Count |
| GO:0072594110 | Esophagus | ESCC | establishment of protein localization to organelle | 311/8552 | 422/18723 | 3.02e-32 | 2.13e-29 | 311 |
| GO:001623617 | Esophagus | ESCC | macroautophagy | 216/8552 | 291/18723 | 1.94e-23 | 4.57e-21 | 216 |
| GO:0006605111 | Esophagus | ESCC | protein targeting | 229/8552 | 314/18723 | 4.93e-23 | 1.01e-20 | 229 |
| GO:001605014 | Esophagus | ESCC | vesicle organization | 211/8552 | 300/18723 | 2.85e-18 | 2.87e-16 | 211 |
| GO:004477216 | Esophagus | ESCC | mitotic cell cycle phase transition | 281/8552 | 424/18723 | 4.63e-18 | 4.45e-16 | 281 |
| GO:001619715 | Esophagus | ESCC | endosomal transport | 168/8552 | 230/18723 | 2.28e-17 | 1.93e-15 | 168 |
| GO:000734615 | Esophagus | ESCC | regulation of mitotic cell cycle | 293/8552 | 457/18723 | 8.00e-16 | 5.64e-14 | 293 |
| GO:0071496111 | Esophagus | ESCC | cellular response to external stimulus | 215/8552 | 320/18723 | 4.29e-15 | 2.43e-13 | 215 |
| GO:000703417 | Esophagus | ESCC | vacuolar transport | 119/8552 | 157/18723 | 1.16e-14 | 6.30e-13 | 119 |
| GO:0031668111 | Esophagus | ESCC | cellular response to extracellular stimulus | 168/8552 | 246/18723 | 4.93e-13 | 2.23e-11 | 168 |
| GO:0031669110 | Esophagus | ESCC | cellular response to nutrient levels | 148/8552 | 215/18723 | 4.58e-12 | 1.76e-10 | 148 |
| GO:0031667111 | Esophagus | ESCC | response to nutrient levels | 289/8552 | 474/18723 | 9.25e-12 | 3.47e-10 | 289 |
| GO:190198713 | Esophagus | ESCC | regulation of cell cycle phase transition | 242/8552 | 390/18723 | 3.86e-11 | 1.26e-09 | 242 |
| GO:190199013 | Esophagus | ESCC | regulation of mitotic cell cycle phase transition | 191/8552 | 299/18723 | 1.35e-10 | 3.94e-09 | 191 |
| GO:0009267110 | Esophagus | ESCC | cellular response to starvation | 110/8552 | 156/18723 | 2.63e-10 | 7.37e-09 | 110 |
| GO:00457865 | Esophagus | ESCC | negative regulation of cell cycle | 236/8552 | 385/18723 | 3.62e-10 | 9.93e-09 | 236 |
| GO:004259419 | Esophagus | ESCC | response to starvation | 133/8552 | 197/18723 | 4.31e-10 | 1.14e-08 | 133 |
| GO:00000754 | Esophagus | ESCC | cell cycle checkpoint | 117/8552 | 169/18723 | 4.47e-10 | 1.17e-08 | 117 |
| GO:00448394 | Esophagus | ESCC | cell cycle G2/M phase transition | 103/8552 | 148/18723 | 3.09e-09 | 6.67e-08 | 103 |
| GO:00070419 | Esophagus | ESCC | lysosomal transport | 83/8552 | 114/18723 | 3.52e-09 | 7.41e-08 | 83 |
| Page: 1 2 3 4 5 6 7 |
| Pathway ID | Tissue | Disease Stage | Description | Gene Ratio | Bg Ratio | pvalue | p.adjust | qvalue | Count |
| hsa05022210 | Esophagus | ESCC | Pathways of neurodegeneration - multiple diseases | 318/4205 | 476/8465 | 6.10e-15 | 2.04e-13 | 1.05e-13 | 318 |
| hsa0414010 | Esophagus | ESCC | Autophagy - animal | 101/4205 | 141/8465 | 7.60e-08 | 6.21e-07 | 3.18e-07 | 101 |
| hsa0502238 | Esophagus | ESCC | Pathways of neurodegeneration - multiple diseases | 318/4205 | 476/8465 | 6.10e-15 | 2.04e-13 | 1.05e-13 | 318 |
| hsa0414015 | Esophagus | ESCC | Autophagy - animal | 101/4205 | 141/8465 | 7.60e-08 | 6.21e-07 | 3.18e-07 | 101 |
| Page: 1 |
Top |
Cell-cell communication analysis |
| Identification of potential cell-cell interactions between two cell types and their ligand-receptor pairs for different disease states |
| Ligand | Receptor | LRpair | Pathway | Tissue | Disease Stage |
| Page: 1 |
Top |
Single-cell gene regulatory network inference analysis |
| Find out the significant the regulons (TFs) and the target genes of each regulon across cell types for different disease states |
| TF | Cell Type | Tissue | Disease Stage | Target Gene | RSS | Regulon Activity |
| ∗The dot plots of a searched regulon are shown for all cell subpopulations in each disease state of each tissue based on the regulon specific score inferred using pySCENIC and by calculating the average expression. |
| Page: 1 |
Top |
Somatic mutation of malignant transformation related genes |
| Annotation of somatic variants for genes involved in malignant transformation |
| Hugo Symbol | Variant Class | Variant Classification | dbSNP RS | HGVSc | HGVSp | HGVSp Short | SWISSPROT | BIOTYPE | SIFT | PolyPhen | Tumor Sample Barcode | Tissue | Histology | Sex | Age | Stage | Therapy Types | Drugs | Outcome |
| ZFYVE1 | SNV | Missense_Mutation | c.312N>C | p.Gln104His | p.Q104H | Q9HBF4 | protein_coding | deleterious(0.03) | possibly_damaging(0.459) | TCGA-D8-A1JA-01 | Breast | breast invasive carcinoma | Female | <65 | III/IV | Chemotherapy | adriamycin | PD | |
| ZFYVE1 | SNV | Missense_Mutation | novel | c.1742C>A | p.Ala581Asp | p.A581D | Q9HBF4 | protein_coding | deleterious(0.01) | possibly_damaging(0.88) | TCGA-S3-AA11-01 | Breast | breast invasive carcinoma | Female | >=65 | I/II | Hormone Therapy | letrozole | CR |
| ZFYVE1 | insertion | In_Frame_Ins | novel | c.1829_1830insATTCTTAGCTGCAGAGTTGCTTCTGGGGGAAGG | p.Phe611_Lys612insLeuAlaAlaGluLeuLeuLeuGlyGluGlyPhe | p.F611_K612insLAAELLLGEGF | Q9HBF4 | protein_coding | TCGA-A7-A0CJ-01 | Breast | breast invasive carcinoma | Female | <65 | I/II | Chemotherapy | cytoxan | SD | ||
| ZFYVE1 | insertion | Nonsense_Mutation | novel | c.800_801insATAGAAAGTGTTTCAAGGAGGATGGAG | p.Thr267_His268insTer | p.T267_H268ins* | Q9HBF4 | protein_coding | TCGA-A8-A07R-01 | Breast | breast invasive carcinoma | Female | >=65 | III/IV | Ancillary | zoledronic | SD | ||
| ZFYVE1 | insertion | Frame_Shift_Ins | novel | c.798_799insTTTCTGTCCAAAGAAG | p.Thr267PhefsTer13 | p.T267Ffs*13 | Q9HBF4 | protein_coding | TCGA-A8-A07R-01 | Breast | breast invasive carcinoma | Female | >=65 | III/IV | Ancillary | zoledronic | SD | ||
| ZFYVE1 | insertion | Frame_Shift_Ins | novel | c.1541_1542insGGCTGACCTGACCCACAGCACAGACCCTTGCAGTAGTTGC | p.Cys514TrpfsTer20 | p.C514Wfs*20 | Q9HBF4 | protein_coding | TCGA-A8-A09D-01 | Breast | breast invasive carcinoma | Female | <65 | I/II | Chemotherapy | doxorubicin | CR | ||
| ZFYVE1 | deletion | Frame_Shift_Del | c.968_975delNNNNNNNN | p.His323ProfsTer5 | p.H323Pfs*5 | Q9HBF4 | protein_coding | TCGA-AN-A0AT-01 | Breast | breast invasive carcinoma | Female | <65 | I/II | Unknown | Unknown | SD | |||
| ZFYVE1 | insertion | Nonsense_Mutation | novel | c.291_292insTTTTCTTAAAGCAGTCACCATTAACAATGAACTG | p.Asn98PhefsTer3 | p.N98Ffs*3 | Q9HBF4 | protein_coding | TCGA-AO-A0JB-01 | Breast | breast invasive carcinoma | Female | <65 | III/IV | Chemotherapy | cyclophosphamide | SD | ||
| ZFYVE1 | insertion | Nonsense_Mutation | novel | c.1683_1684insTGACAACTGCTACGAAGCCAGGAAC | p.Asp562Ter | p.D562* | Q9HBF4 | protein_coding | TCGA-BH-A0DS-01 | Breast | breast invasive carcinoma | Female | >=65 | III/IV | Chemotherapy | cyclophosphamide | SD | ||
| ZFYVE1 | deletion | Frame_Shift_Del | novel | c.1689delN | p.Met564Ter | p.M564* | Q9HBF4 | protein_coding | TCGA-D8-A27V-01 | Breast | breast invasive carcinoma | Female | <65 | I/II | Hormone Therapy | tamoxiphen | SD |
| Page: 1 2 3 4 5 6 7 8 9 |
Top |
Related drugs of malignant transformation related genes |
| Identification of chemicals and drugs interact with genes involved in malignant transfromation |
| (DGIdb 4.0) |
| Entrez ID | Symbol | Category | Interaction Types | Drug Claim Name | Drug Name | PMIDs |
| Page: 1 |

Copyright 2023-Present -The University of Texas Health Science Center at Houston |