
|
|||||
|
 | |
| |
| |
| |
| |
| |
|
Gene: ZFX |
Gene summary for ZFX |
| Gene information | Species | Human | Gene symbol | ZFX | Gene ID | 7543 |
| Gene name | zinc finger protein X-linked | |
| Gene Alias | ZNF926 | |
| Cytomap | Xp22.11 | |
| Gene Type | protein-coding | GO ID | GO:0000003 | UniProtAcc | A0A024RC04 |
Top |
Malignant transformation analysis |
| Identification of the aberrant gene expression in precancerous and cancerous lesions by comparing the gene expression of stem-like cells in diseased tissues with normal stem cells |
| Entrez ID | Symbol | Replicates | Species | Organ | Tissue | Adj P-value | Log2FC | Malignancy |
| 7543 | ZFX | LZE4T | Human | Esophagus | ESCC | 4.98e-09 | 4.44e-01 | 0.0811 |
| 7543 | ZFX | LZE5T | Human | Esophagus | ESCC | 3.51e-03 | 2.92e-01 | 0.0514 |
| 7543 | ZFX | LZE20T | Human | Esophagus | ESCC | 5.40e-03 | 1.26e-01 | 0.0662 |
| 7543 | ZFX | LZE22T | Human | Esophagus | ESCC | 1.12e-03 | 2.65e-01 | 0.068 |
| 7543 | ZFX | LZE24T | Human | Esophagus | ESCC | 7.86e-06 | 1.14e-01 | 0.0596 |
| 7543 | ZFX | LZE21T | Human | Esophagus | ESCC | 1.93e-03 | 1.83e-01 | 0.0655 |
| 7543 | ZFX | LZE6T | Human | Esophagus | ESCC | 6.71e-03 | 1.49e-01 | 0.0845 |
| 7543 | ZFX | P2T-E | Human | Esophagus | ESCC | 1.35e-34 | 6.54e-01 | 0.1177 |
| 7543 | ZFX | P4T-E | Human | Esophagus | ESCC | 9.11e-17 | 3.72e-01 | 0.1323 |
| 7543 | ZFX | P5T-E | Human | Esophagus | ESCC | 4.04e-05 | 9.46e-02 | 0.1327 |
| 7543 | ZFX | P8T-E | Human | Esophagus | ESCC | 5.66e-17 | 3.70e-01 | 0.0889 |
| 7543 | ZFX | P9T-E | Human | Esophagus | ESCC | 1.62e-09 | 2.31e-01 | 0.1131 |
| 7543 | ZFX | P10T-E | Human | Esophagus | ESCC | 6.55e-09 | 2.61e-01 | 0.116 |
| 7543 | ZFX | P11T-E | Human | Esophagus | ESCC | 2.40e-13 | 6.03e-01 | 0.1426 |
| 7543 | ZFX | P12T-E | Human | Esophagus | ESCC | 1.65e-09 | 2.39e-01 | 0.1122 |
| 7543 | ZFX | P15T-E | Human | Esophagus | ESCC | 4.15e-14 | 4.01e-01 | 0.1149 |
| 7543 | ZFX | P16T-E | Human | Esophagus | ESCC | 2.43e-06 | 2.77e-01 | 0.1153 |
| 7543 | ZFX | P17T-E | Human | Esophagus | ESCC | 1.64e-03 | 2.58e-01 | 0.1278 |
| 7543 | ZFX | P20T-E | Human | Esophagus | ESCC | 1.71e-10 | 2.26e-01 | 0.1124 |
| 7543 | ZFX | P21T-E | Human | Esophagus | ESCC | 3.63e-13 | 1.74e-01 | 0.1617 |
| Page: 1 2 3 4 5 |
| Tissue | Expression Dynamics | Abbreviation |
| Esophagus | 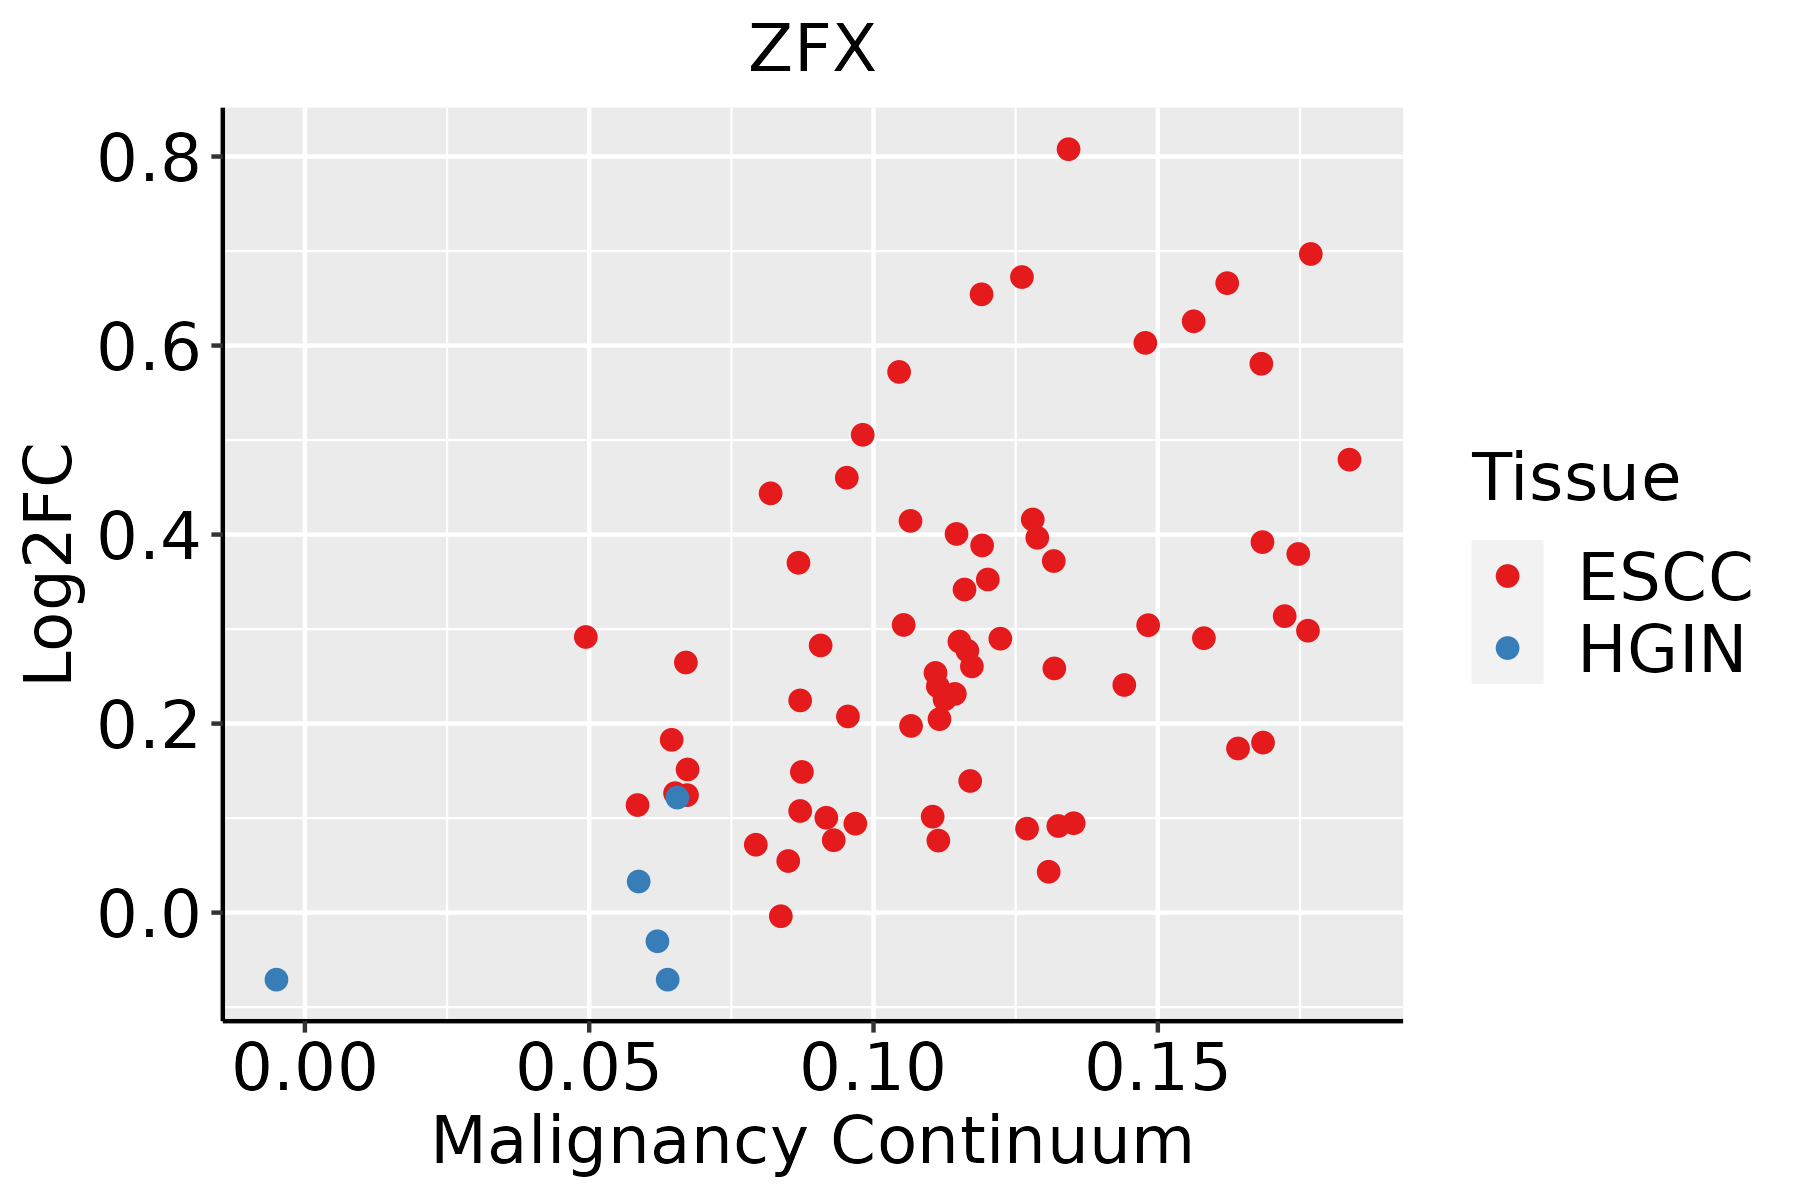 | ESCC: Esophageal squamous cell carcinoma |
| HGIN: High-grade intraepithelial neoplasias | ||
| LGIN: Low-grade intraepithelial neoplasias | ||
| Liver | 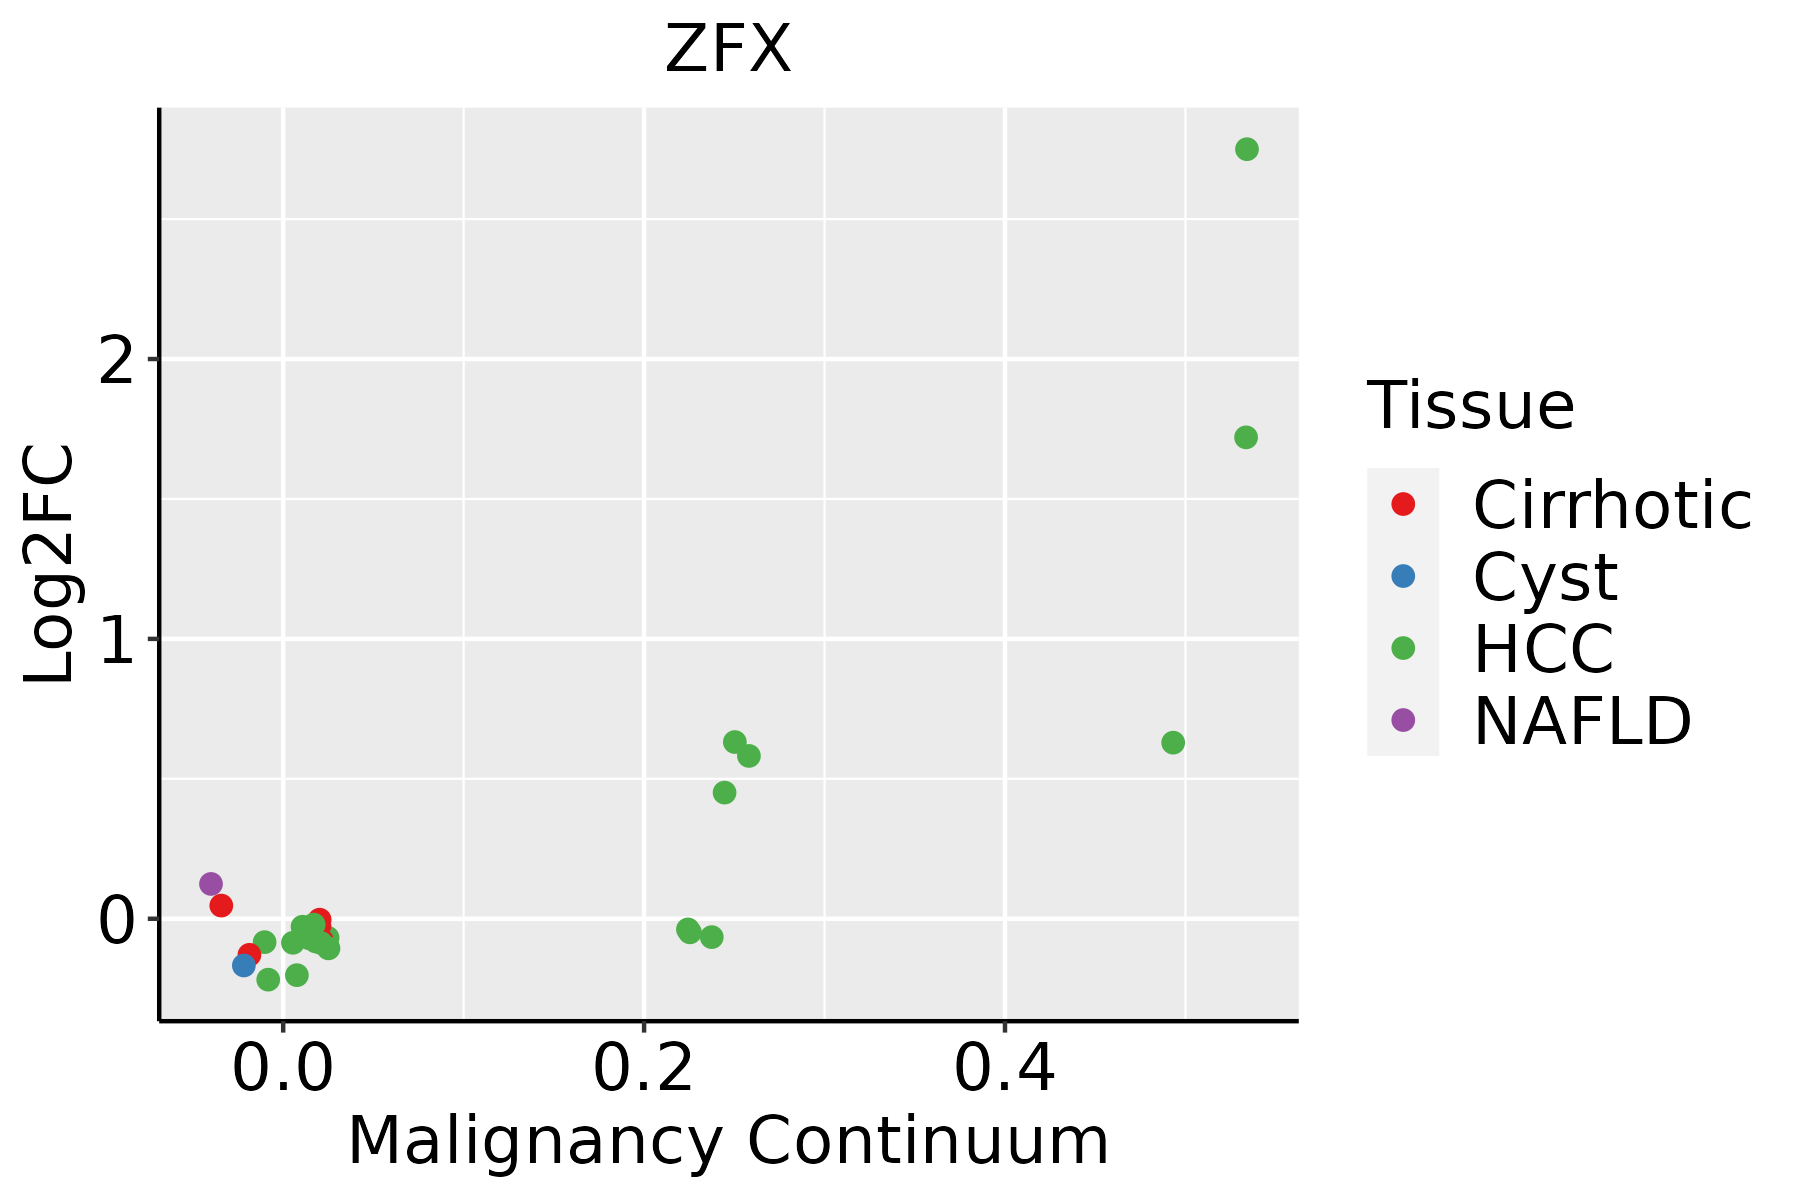 | HCC: Hepatocellular carcinoma |
| NAFLD: Non-alcoholic fatty liver disease | ||
| Lung | 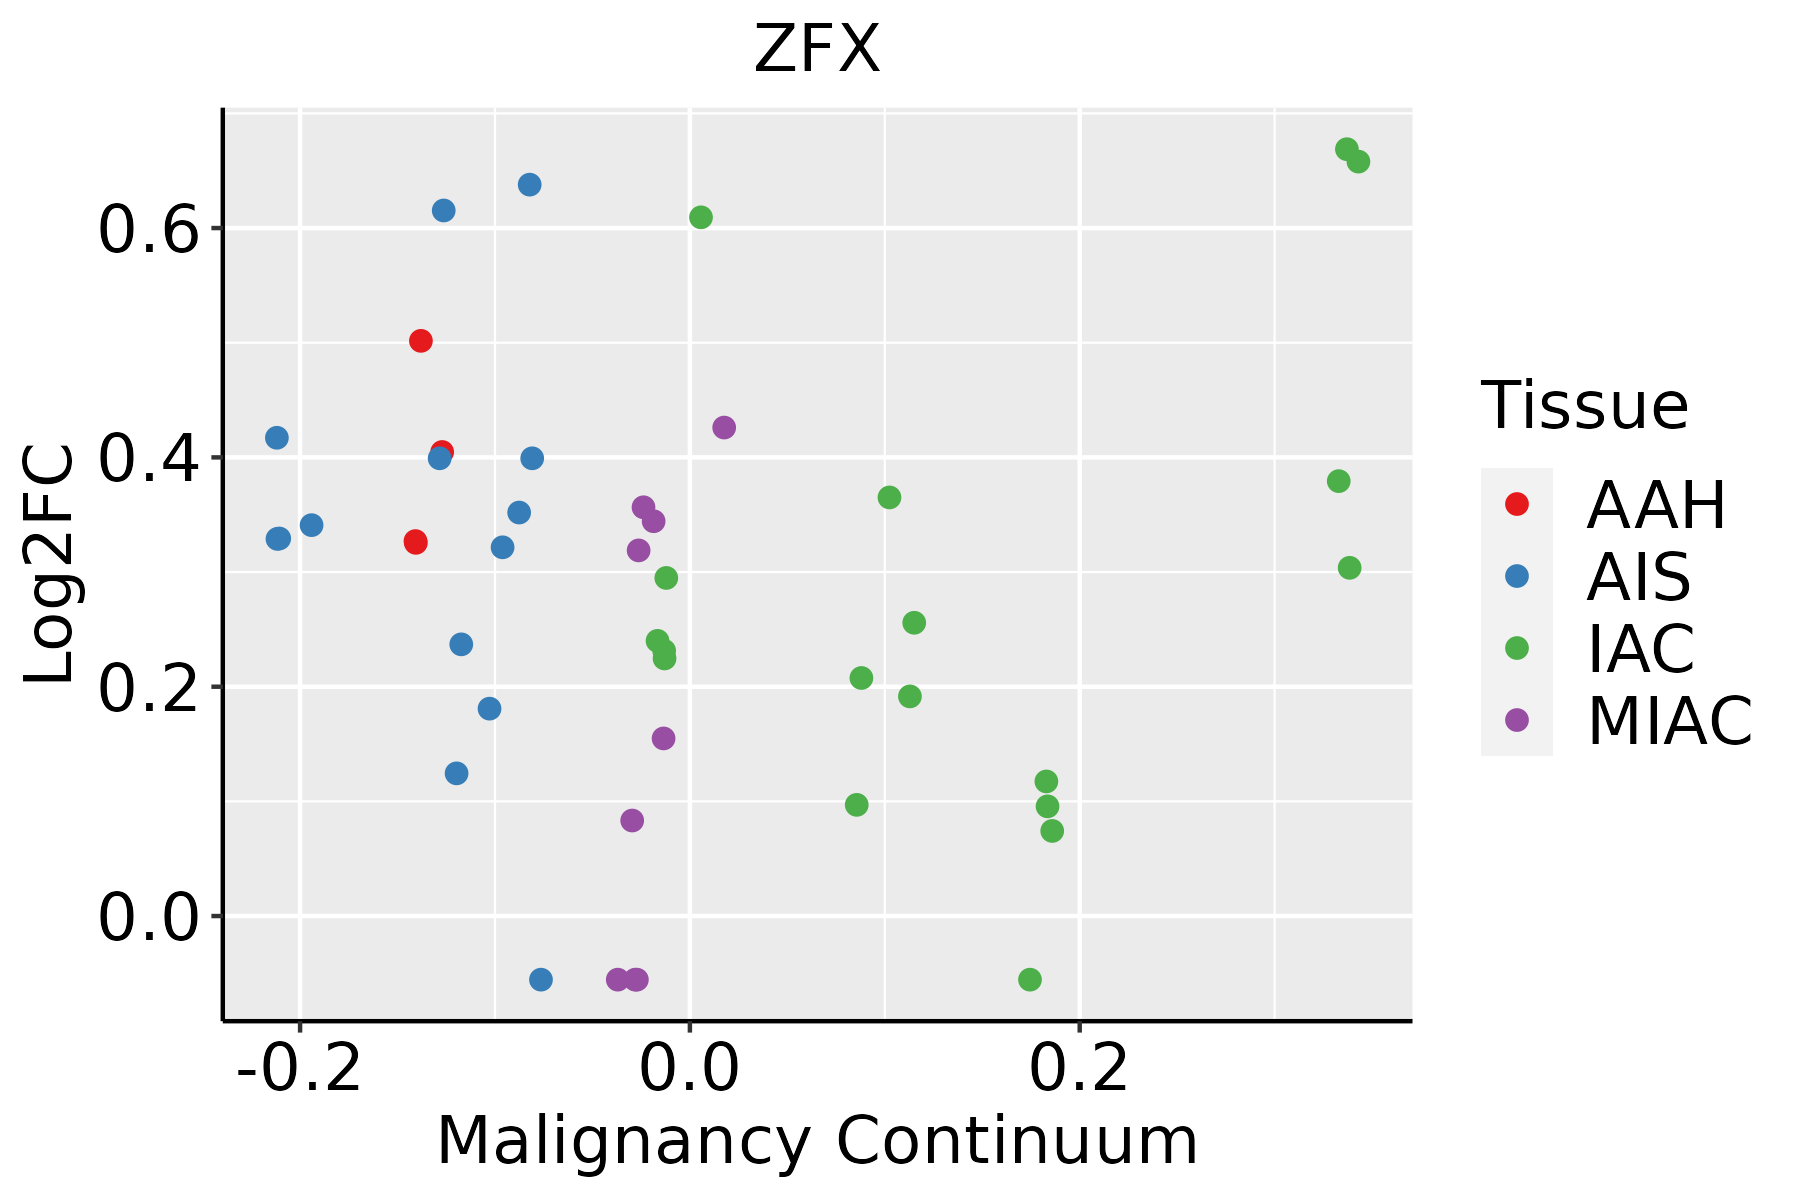 | AAH: Atypical adenomatous hyperplasia |
| AIS: Adenocarcinoma in situ | ||
| IAC: Invasive lung adenocarcinoma | ||
| MIA: Minimally invasive adenocarcinoma | ||
| Thyroid | 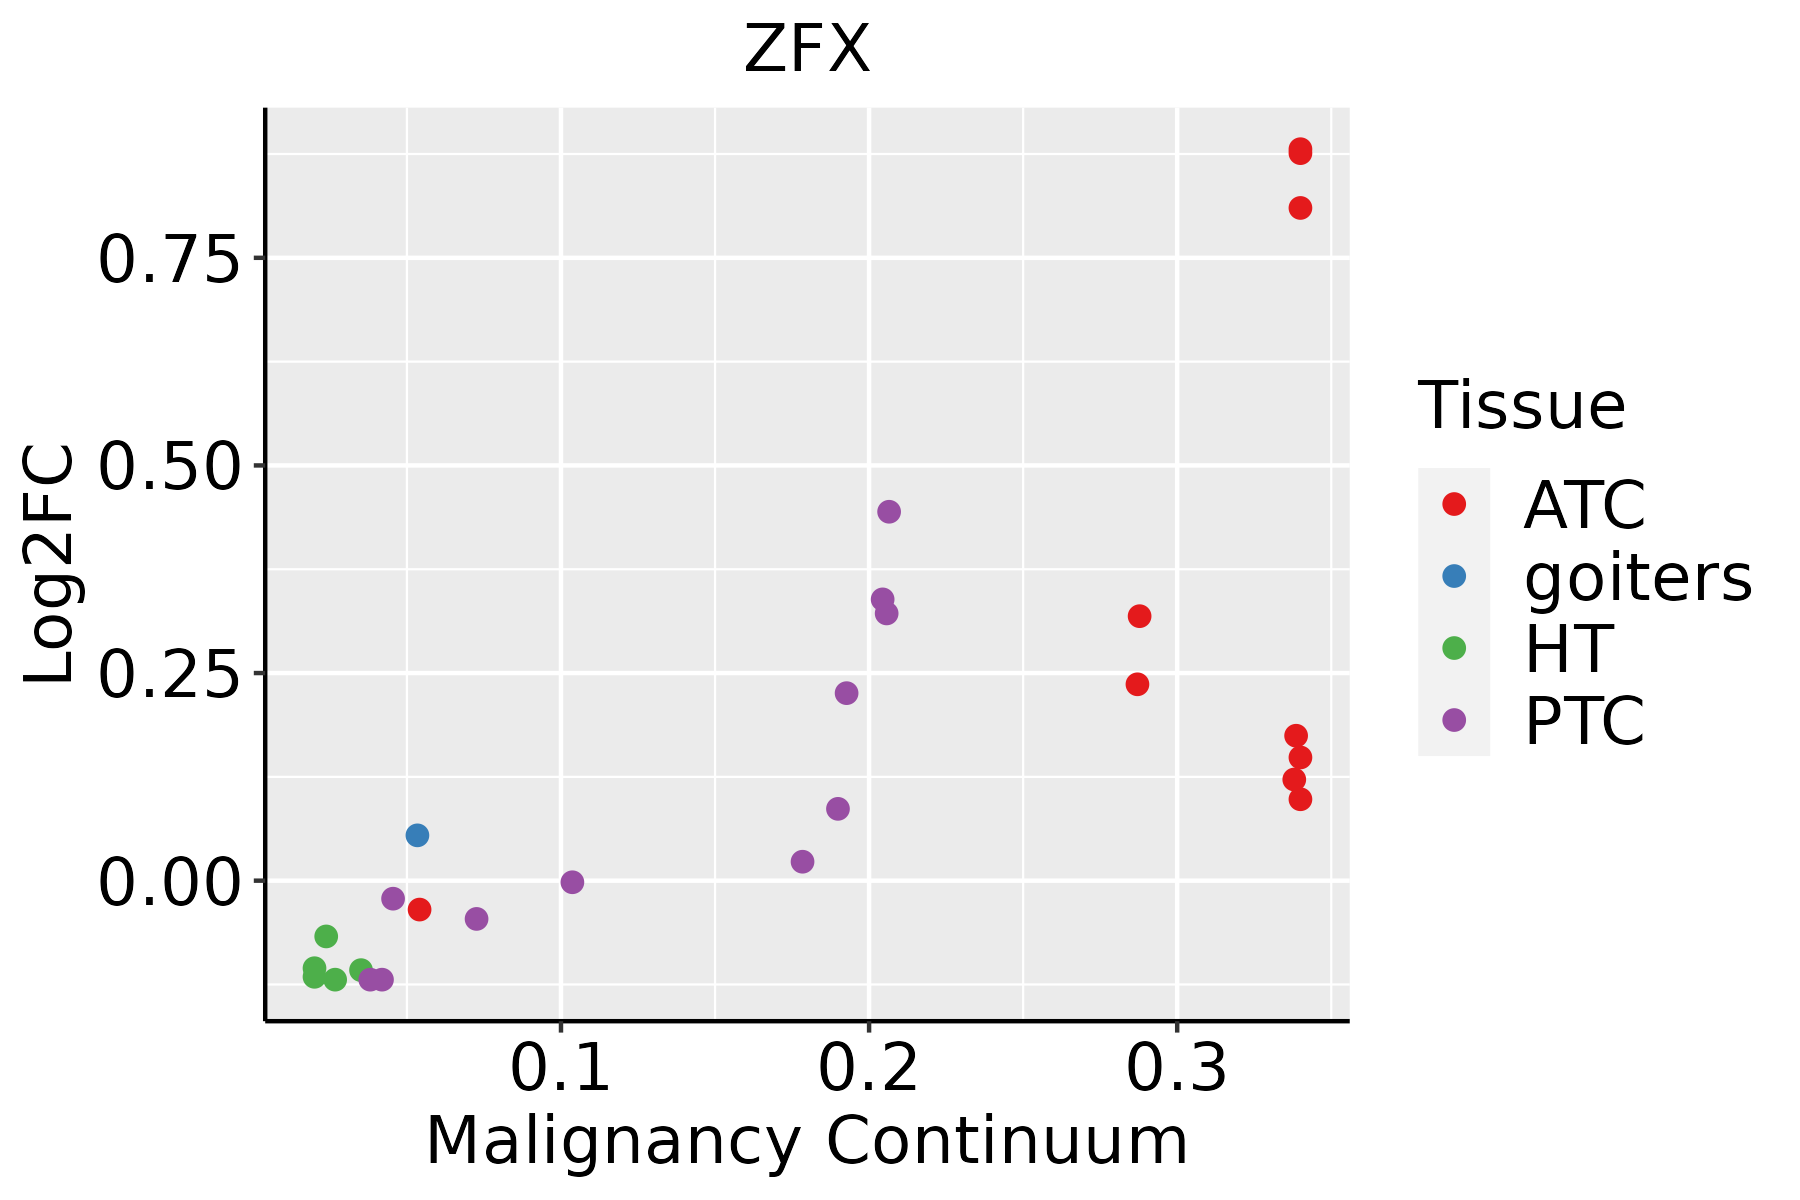 | ATC: Anaplastic thyroid cancer |
| HT: Hashimoto's thyroiditis | ||
| PTC: Papillary thyroid cancer |
| ∗log2FC in expression of this searched gene in stem-like cells from each diseased tissue sample relative to stem-like cells in normal samples in each tissue plotted against the malignancy continuum. Samples are colored based on if they are from different disease stage. |
Top |
Malignant transformation related pathway analysis |
| Find out the enriched GO biological processes and KEGG pathways involved in transition from healthy to precancer to cancer |
| Tissue | Disease Stage | Enriched GO biological Processes |
| Colorectum | AD |  |
| Colorectum | SER |  |
| Colorectum | MSS |  |
| Colorectum | MSI-H |  |
| Colorectum | FAP |  |
| ∗Top 15 enriched GO BP terms are showed in the bar plot of each disease state in each tissue. Each row represents a significant GO biological process which is colored according to the -log10(p.adjust). |
| Page: 1 2 3 4 5 6 7 8 9 |
| GO ID | Tissue | Disease Stage | Description | Gene Ratio | Bg Ratio | pvalue | p.adjust | Count |
| GO:0061458110 | Esophagus | ESCC | reproductive system development | 247/8552 | 427/18723 | 2.24e-07 | 3.42e-06 | 247 |
| GO:004860818 | Esophagus | ESCC | reproductive structure development | 245/8552 | 424/18723 | 2.82e-07 | 4.14e-06 | 245 |
| GO:0048872111 | Esophagus | ESCC | homeostasis of number of cells | 163/8552 | 272/18723 | 1.40e-06 | 1.69e-05 | 163 |
| GO:00097919 | Esophagus | ESCC | post-embryonic development | 56/8552 | 80/18723 | 9.08e-06 | 8.71e-05 | 56 |
| GO:00352647 | Esophagus | ESCC | multicellular organism growth | 80/8552 | 132/18723 | 3.84e-04 | 2.22e-03 | 80 |
| GO:004887212 | Liver | Cirrhotic | homeostasis of number of cells | 89/4634 | 272/18723 | 1.76e-03 | 1.12e-02 | 89 |
| GO:00614585 | Liver | Cirrhotic | reproductive system development | 132/4634 | 427/18723 | 2.07e-03 | 1.28e-02 | 132 |
| GO:00486085 | Liver | Cirrhotic | reproductive structure development | 131/4634 | 424/18723 | 2.19e-03 | 1.34e-02 | 131 |
| GO:003526411 | Liver | Cirrhotic | multicellular organism growth | 47/4634 | 132/18723 | 3.40e-03 | 1.89e-02 | 47 |
| GO:004887222 | Liver | HCC | homeostasis of number of cells | 147/7958 | 272/18723 | 7.48e-05 | 6.70e-04 | 147 |
| GO:003526421 | Liver | HCC | multicellular organism growth | 70/7958 | 132/18723 | 9.29e-03 | 3.57e-02 | 70 |
| GO:006145811 | Liver | HCC | reproductive system development | 205/7958 | 427/18723 | 1.16e-02 | 4.27e-02 | 205 |
| GO:00614586 | Lung | IAC | reproductive system development | 79/2061 | 427/18723 | 2.39e-06 | 1.06e-04 | 79 |
| GO:00486086 | Lung | IAC | reproductive structure development | 78/2061 | 424/18723 | 3.44e-06 | 1.44e-04 | 78 |
| GO:00488728 | Lung | IAC | homeostasis of number of cells | 54/2061 | 272/18723 | 1.20e-05 | 3.64e-04 | 54 |
| GO:00352644 | Lung | IAC | multicellular organism growth | 25/2061 | 132/18723 | 4.69e-03 | 3.68e-02 | 25 |
| GO:006145812 | Lung | AIS | reproductive system development | 70/1849 | 427/18723 | 1.52e-05 | 5.50e-04 | 70 |
| GO:004860811 | Lung | AIS | reproductive structure development | 69/1849 | 424/18723 | 2.23e-05 | 7.42e-04 | 69 |
| GO:004887213 | Lung | AIS | homeostasis of number of cells | 47/1849 | 272/18723 | 1.03e-04 | 2.50e-03 | 47 |
| GO:0008585 | Lung | AIS | female gonad development | 19/1849 | 95/18723 | 2.13e-03 | 2.30e-02 | 19 |
| Page: 1 2 |
| Pathway ID | Tissue | Disease Stage | Description | Gene Ratio | Bg Ratio | pvalue | p.adjust | qvalue | Count |
| Page: 1 |
Top |
Cell-cell communication analysis |
| Identification of potential cell-cell interactions between two cell types and their ligand-receptor pairs for different disease states |
| Ligand | Receptor | LRpair | Pathway | Tissue | Disease Stage |
| Page: 1 |
Top |
Single-cell gene regulatory network inference analysis |
| Find out the significant the regulons (TFs) and the target genes of each regulon across cell types for different disease states |
| TF | Cell Type | Tissue | Disease Stage | Target Gene | RSS | Regulon Activity |
| ZFX | BMEM | Esophagus | ADJ | ATG7,PPM1F,MRPL57, etc. | 3.95e-01 |  |
| ZFX | BN | Esophagus | ADJ | ATG7,PPM1F,MRPL57, etc. | 6.03e-02 | |
| ZFX | BN | Esophagus | ESCC | ATG7,PPM1F,MRPL57, etc. | 1.74e-01 |  |
| ZFX | CAF | Stomach | CSG | GJA4,VEGFC,HMBS, etc. | 1.83e-01 |  |
| ZFX | MVA | Stomach | SIM | GJA4,VEGFC,HMBS, etc. | 1.00e-01 |  |
| ZFX | CAF | Stomach | WIM | GJA4,VEGFC,HMBS, etc. | 1.23e-01 |  |
| ZFX | END | Thyroid | Healthy | LRRC1,KRT8,FAM111A-DT, etc. | 2.19e-01 |  |
| ZFX | END | Thyroid | HT | LRRC1,KRT8,FAM111A-DT, etc. | 5.16e-01 |  |
| ∗The dot plots of a searched regulon are shown for all cell subpopulations in each disease state of each tissue based on the regulon specific score inferred using pySCENIC and by calculating the average expression. |
| Page: 1 |
Top |
Somatic mutation of malignant transformation related genes |
| Annotation of somatic variants for genes involved in malignant transformation |
| Hugo Symbol | Variant Class | Variant Classification | dbSNP RS | HGVSc | HGVSp | HGVSp Short | SWISSPROT | BIOTYPE | SIFT | PolyPhen | Tumor Sample Barcode | Tissue | Histology | Sex | Age | Stage | Therapy Types | Drugs | Outcome |
| ZFX | SNV | Missense_Mutation | novel | c.1220N>T | p.Ser407Phe | p.S407F | P17010 | protein_coding | tolerated(0.71) | possibly_damaging(0.748) | TCGA-5L-AAT1-01 | Breast | breast invasive carcinoma | Female | <65 | III/IV | Hormone Therapy | letrozol | SD |
| ZFX | SNV | Missense_Mutation | c.577N>A | p.Glu193Lys | p.E193K | P17010 | protein_coding | deleterious(0.03) | probably_damaging(0.994) | TCGA-AC-A23H-01 | Breast | breast invasive carcinoma | Female | >=65 | I/II | Unknown | Unknown | PD | |
| ZFX | SNV | Missense_Mutation | c.946N>C | p.Glu316Gln | p.E316Q | P17010 | protein_coding | tolerated(0.3) | possibly_damaging(0.886) | TCGA-D8-A27G-01 | Breast | breast invasive carcinoma | Female | >=65 | I/II | Unknown | Unknown | SD | |
| ZFX | insertion | In_Frame_Ins | novel | c.2356_2357insTTTCGTCACCCGTCAGAGCTCAAAAAGCACATGAGA | p.Tyr786delinsPheSerSerProValArgAlaGlnLysAlaHisGluAsn | p.Y786delinsFSSPVRAQKAHEN | P17010 | protein_coding | TCGA-A8-A09E-01 | Breast | breast invasive carcinoma | Female | >=65 | III/IV | Hormone Therapy | anastrozole | SD | ||
| ZFX | deletion | Frame_Shift_Del | novel | c.963delT | p.Glu322AsnfsTer19 | p.E322Nfs*19 | P17010 | protein_coding | TCGA-D8-A27V-01 | Breast | breast invasive carcinoma | Female | <65 | I/II | Hormone Therapy | tamoxiphen | SD | ||
| ZFX | SNV | Missense_Mutation | c.1051G>C | p.Asp351His | p.D351H | P17010 | protein_coding | deleterious(0.03) | possibly_damaging(0.859) | TCGA-EK-A2PG-01 | Cervix | cervical & endocervical cancer | Female | >=65 | I/II | Unknown | Unknown | SD | |
| ZFX | SNV | Missense_Mutation | c.2141N>T | p.Ser714Leu | p.S714L | P17010 | protein_coding | deleterious(0) | probably_damaging(0.992) | TCGA-IR-A3LA-01 | Cervix | cervical & endocervical cancer | Female | <65 | I/II | Chemotherapy | cisplatin | CR | |
| ZFX | SNV | Missense_Mutation | rs758426142 | c.824N>T | p.Ser275Leu | p.S275L | P17010 | protein_coding | tolerated(0.36) | benign(0.125) | TCGA-IR-A3LF-01 | Cervix | cervical & endocervical cancer | Female | <65 | I/II | Unknown | Unknown | SD |
| ZFX | SNV | Missense_Mutation | c.416N>T | p.Ser139Leu | p.S139L | P17010 | protein_coding | tolerated(0.2) | benign(0.006) | TCGA-IR-A3LI-01 | Cervix | cervical & endocervical cancer | Female | <65 | I/II | Chemotherapy | cisplatin | CR | |
| ZFX | SNV | Missense_Mutation | novel | c.1042N>C | p.Glu348Gln | p.E348Q | P17010 | protein_coding | tolerated(0.08) | possibly_damaging(0.893) | TCGA-MA-AA3Y-01 | Cervix | cervical & endocervical cancer | Female | <65 | I/II | Unknown | Unknown | SD |
| Page: 1 2 3 4 5 6 7 8 9 |
Top |
Related drugs of malignant transformation related genes |
| Identification of chemicals and drugs interact with genes involved in malignant transfromation |
| (DGIdb 4.0) |
| Entrez ID | Symbol | Category | Interaction Types | Drug Claim Name | Drug Name | PMIDs |
| Page: 1 |

Copyright 2023-Present -The University of Texas Health Science Center at Houston |