
|
|||||
|
 | |
| |
| |
| |
| |
| |
|
Gene: ZFR2 |
Gene summary for ZFR2 |
| Gene information | Species | Human | Gene symbol | ZFR2 | Gene ID | 23217 |
| Gene name | zinc finger RNA binding protein 2 | |
| Gene Alias | KIAA1086 | |
| Cytomap | 19p13.3 | |
| Gene Type | protein-coding | GO ID | GO:0003674 | UniProtAcc | Q9UPR6 |
Top |
Malignant transformation analysis |
| Identification of the aberrant gene expression in precancerous and cancerous lesions by comparing the gene expression of stem-like cells in diseased tissues with normal stem cells |
| Entrez ID | Symbol | Replicates | Species | Organ | Tissue | Adj P-value | Log2FC | Malignancy |
| 23217 | ZFR2 | C43 | Human | Oral cavity | OSCC | 1.06e-36 | 6.15e-01 | 0.1704 |
| 23217 | ZFR2 | C46 | Human | Oral cavity | OSCC | 2.20e-33 | 5.91e-01 | 0.1673 |
| 23217 | ZFR2 | C57 | Human | Oral cavity | OSCC | 1.42e-24 | 5.13e-01 | 0.1679 |
| 23217 | ZFR2 | C86 | Human | Oral cavity | OSCC | 4.47e-05 | 4.84e-01 | 0.161 |
| 23217 | ZFR2 | LN22 | Human | Oral cavity | OSCC | 2.52e-10 | 7.71e-01 | 0.1733 |
| 23217 | ZFR2 | LN46 | Human | Oral cavity | OSCC | 7.43e-28 | 8.15e-01 | 0.1666 |
| Page: 1 |
| Tissue | Expression Dynamics | Abbreviation |
| Oral Cavity | 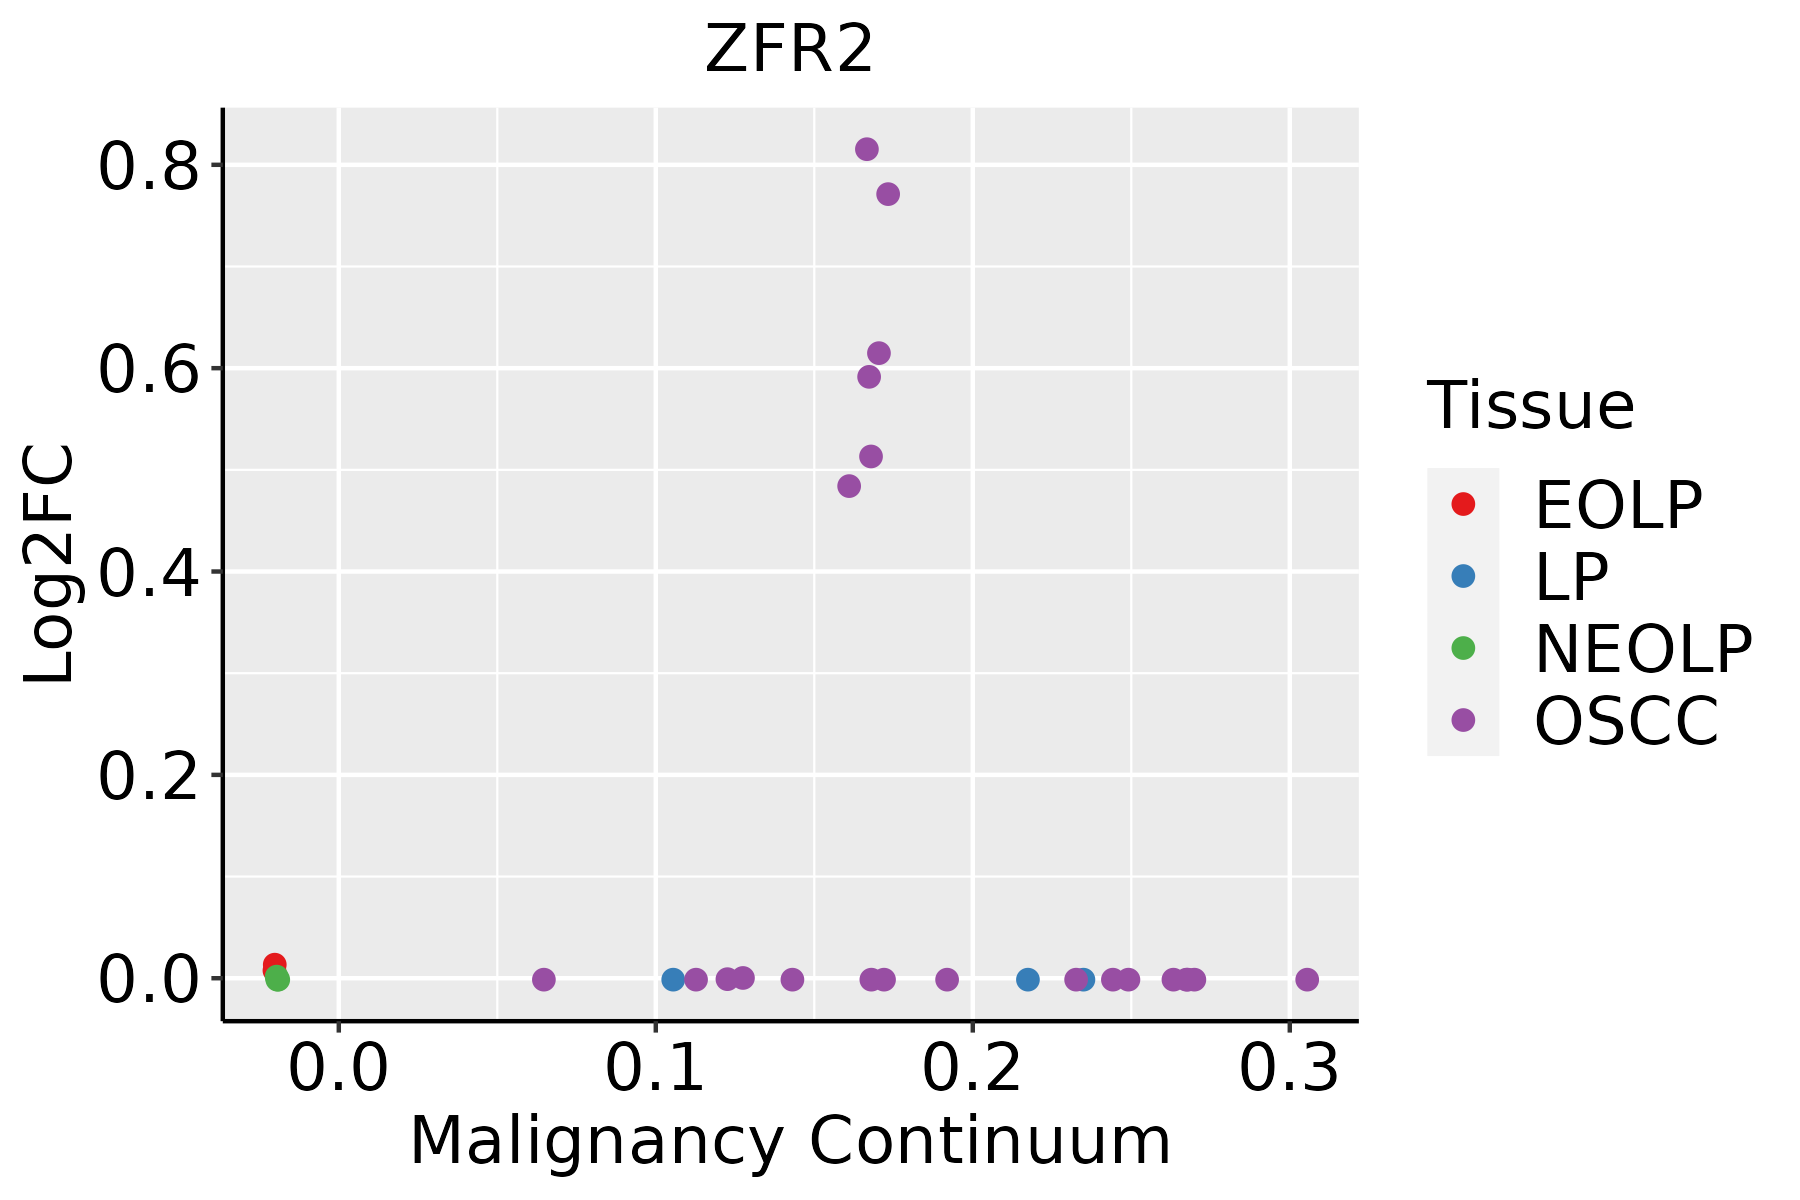 | EOLP: Erosive Oral lichen planus |
| LP: leukoplakia | ||
| NEOLP: Non-erosive oral lichen planus | ||
| OSCC: Oral squamous cell carcinoma |
| ∗log2FC in expression of this searched gene in stem-like cells from each diseased tissue sample relative to stem-like cells in normal samples in each tissue plotted against the malignancy continuum. Samples are colored based on if they are from different disease stage. |
Top |
Malignant transformation related pathway analysis |
| Find out the enriched GO biological processes and KEGG pathways involved in transition from healthy to precancer to cancer |
| Tissue | Disease Stage | Enriched GO biological Processes |
| Colorectum | AD |  |
| Colorectum | SER |  |
| Colorectum | MSS |  |
| Colorectum | MSI-H |  |
| Colorectum | FAP |  |
| ∗Top 15 enriched GO BP terms are showed in the bar plot of each disease state in each tissue. Each row represents a significant GO biological process which is colored according to the -log10(p.adjust). |
| Page: 1 2 3 4 5 6 7 8 9 |
| GO ID | Tissue | Disease Stage | Description | Gene Ratio | Bg Ratio | pvalue | p.adjust | Count |
| Page: 1 |
| Pathway ID | Tissue | Disease Stage | Description | Gene Ratio | Bg Ratio | pvalue | p.adjust | qvalue | Count |
| Page: 1 |
Top |
Cell-cell communication analysis |
| Identification of potential cell-cell interactions between two cell types and their ligand-receptor pairs for different disease states |
| Ligand | Receptor | LRpair | Pathway | Tissue | Disease Stage |
| Page: 1 |
Top |
Single-cell gene regulatory network inference analysis |
| Find out the significant the regulons (TFs) and the target genes of each regulon across cell types for different disease states |
| TF | Cell Type | Tissue | Disease Stage | Target Gene | RSS | Regulon Activity |
| ∗The dot plots of a searched regulon are shown for all cell subpopulations in each disease state of each tissue based on the regulon specific score inferred using pySCENIC and by calculating the average expression. |
| Page: 1 |
Top |
Somatic mutation of malignant transformation related genes |
| Annotation of somatic variants for genes involved in malignant transformation |
| Hugo Symbol | Variant Class | Variant Classification | dbSNP RS | HGVSc | HGVSp | HGVSp Short | SWISSPROT | BIOTYPE | SIFT | PolyPhen | Tumor Sample Barcode | Tissue | Histology | Sex | Age | Stage | Therapy Types | Drugs | Outcome |
| ZFR2 | SNV | Missense_Mutation | c.2488C>T | p.Pro830Ser | p.P830S | Q9UPR6 | protein_coding | deleterious(0) | probably_damaging(1) | TCGA-D8-A1J8-01 | Breast | breast invasive carcinoma | Female | >=65 | I/II | Hormone Therapy | nolvadex | SD | |
| ZFR2 | SNV | Missense_Mutation | rs185400185 | c.1324N>A | p.Ala442Thr | p.A442T | Q9UPR6 | protein_coding | tolerated(0.19) | benign(0.127) | TCGA-WT-AB44-01 | Breast | breast invasive carcinoma | Female | >=65 | I/II | Hormone Therapy | arimidex | SD |
| ZFR2 | deletion | Frame_Shift_Del | novel | c.2151delN | p.Asn717LysfsTer22 | p.N717Kfs*22 | Q9UPR6 | protein_coding | TCGA-D8-A27V-01 | Breast | breast invasive carcinoma | Female | <65 | I/II | Hormone Therapy | tamoxiphen | SD | ||
| ZFR2 | SNV | Missense_Mutation | novel | c.2524N>A | p.Ala842Thr | p.A842T | Q9UPR6 | protein_coding | deleterious(0) | probably_damaging(0.977) | TCGA-2W-A8YY-01 | Cervix | cervical & endocervical cancer | Female | <65 | I/II | Chemotherapy | cisplatin | CR |
| ZFR2 | SNV | Missense_Mutation | novel | c.1234G>T | p.Ala412Ser | p.A412S | Q9UPR6 | protein_coding | tolerated(0.08) | benign(0.109) | TCGA-EA-A3HU-01 | Cervix | cervical & endocervical cancer | Female | <65 | I/II | Unknown | Unknown | SD |
| ZFR2 | SNV | Missense_Mutation | novel | c.1051G>A | p.Ala351Thr | p.A351T | Q9UPR6 | protein_coding | tolerated(1) | benign(0) | TCGA-EA-A3HU-01 | Cervix | cervical & endocervical cancer | Female | <65 | I/II | Unknown | Unknown | SD |
| ZFR2 | SNV | Missense_Mutation | c.1478N>A | p.Arg493Gln | p.R493Q | Q9UPR6 | protein_coding | deleterious(0) | probably_damaging(0.999) | TCGA-JW-A852-01 | Cervix | cervical & endocervical cancer | Female | <65 | I/II | Unknown | Unknown | PD | |
| ZFR2 | SNV | Missense_Mutation | rs763887729 | c.193N>A | p.Gly65Ser | p.G65S | Q9UPR6 | protein_coding | tolerated(0.54) | benign(0) | TCGA-MA-AA42-01 | Cervix | cervical & endocervical cancer | Female | >=65 | I/II | Unknown | Unknown | SD |
| ZFR2 | SNV | Missense_Mutation | novel | c.2788C>T | p.Arg930Trp | p.R930W | Q9UPR6 | protein_coding | deleterious(0) | possibly_damaging(0.824) | TCGA-5M-AAT6-01 | Colorectum | colon adenocarcinoma | Female | <65 | III/IV | Unknown | Unknown | PD |
| ZFR2 | SNV | Missense_Mutation | rs751547243 | c.622G>A | p.Ala208Thr | p.A208T | Q9UPR6 | protein_coding | deleterious(0.02) | benign(0.006) | TCGA-A6-2679-01 | Colorectum | colon adenocarcinoma | Female | >=65 | I/II | Unknown | Unknown | SD |
| Page: 1 2 3 4 5 6 7 8 |
Top |
Related drugs of malignant transformation related genes |
| Identification of chemicals and drugs interact with genes involved in malignant transfromation |
| (DGIdb 4.0) |
| Entrez ID | Symbol | Category | Interaction Types | Drug Claim Name | Drug Name | PMIDs |
| Page: 1 |

Copyright 2023-Present -The University of Texas Health Science Center at Houston |