
|
|||||
|
 | |
| |
| |
| |
| |
| |
|
Gene: ZFR |
Gene summary for ZFR |
| Gene information | Species | Human | Gene symbol | ZFR | Gene ID | 51663 |
| Gene name | zinc finger RNA binding protein | |
| Gene Alias | SPG71 | |
| Cytomap | 5p13.3 | |
| Gene Type | protein-coding | GO ID | GO:0005575 | UniProtAcc | Q05D65 |
Top |
Malignant transformation analysis |
| Identification of the aberrant gene expression in precancerous and cancerous lesions by comparing the gene expression of stem-like cells in diseased tissues with normal stem cells |
| Entrez ID | Symbol | Replicates | Species | Organ | Tissue | Adj P-value | Log2FC | Malignancy |
| 51663 | ZFR | CA_HPV_1 | Human | Cervix | CC | 4.86e-04 | -9.13e-02 | 0.0264 |
| 51663 | ZFR | CCI_1 | Human | Cervix | CC | 3.18e-05 | 6.63e-01 | 0.528 |
| 51663 | ZFR | CCI_2 | Human | Cervix | CC | 1.10e-04 | 8.79e-01 | 0.5249 |
| 51663 | ZFR | CCI_3 | Human | Cervix | CC | 1.23e-12 | 1.01e+00 | 0.516 |
| 51663 | ZFR | HTA11_3410_2000001011 | Human | Colorectum | AD | 9.31e-12 | -4.79e-01 | 0.0155 |
| 51663 | ZFR | HTA11_347_2000001011 | Human | Colorectum | AD | 7.98e-05 | 5.02e-01 | -0.1954 |
| 51663 | ZFR | HTA11_3361_2000001011 | Human | Colorectum | AD | 5.99e-03 | -4.39e-01 | -0.1207 |
| 51663 | ZFR | HTA11_10623_2000001011 | Human | Colorectum | AD | 3.86e-02 | -1.51e-01 | -0.0177 |
| 51663 | ZFR | HTA11_10711_2000001011 | Human | Colorectum | AD | 2.73e-03 | -4.30e-01 | 0.0338 |
| 51663 | ZFR | HTA11_99999974143_84620 | Human | Colorectum | MSS | 5.27e-09 | -4.50e-01 | 0.3005 |
| 51663 | ZFR | F007 | Human | Colorectum | FAP | 1.69e-08 | -5.74e-01 | 0.1176 |
| 51663 | ZFR | A001-C-207 | Human | Colorectum | FAP | 7.76e-06 | -3.44e-01 | 0.1278 |
| 51663 | ZFR | A015-C-203 | Human | Colorectum | FAP | 1.30e-37 | -6.94e-01 | -0.1294 |
| 51663 | ZFR | A015-C-204 | Human | Colorectum | FAP | 1.90e-11 | -4.45e-01 | -0.0228 |
| 51663 | ZFR | A014-C-040 | Human | Colorectum | FAP | 6.86e-09 | -6.60e-01 | -0.1184 |
| 51663 | ZFR | A002-C-201 | Human | Colorectum | FAP | 5.50e-23 | -5.56e-01 | 0.0324 |
| 51663 | ZFR | A002-C-203 | Human | Colorectum | FAP | 5.62e-06 | -2.92e-01 | 0.2786 |
| 51663 | ZFR | A001-C-119 | Human | Colorectum | FAP | 5.41e-14 | -5.91e-01 | -0.1557 |
| 51663 | ZFR | A001-C-108 | Human | Colorectum | FAP | 3.55e-20 | -3.74e-01 | -0.0272 |
| 51663 | ZFR | A002-C-205 | Human | Colorectum | FAP | 5.41e-34 | -6.32e-01 | -0.1236 |
| Page: 1 2 3 4 5 6 7 8 9 |
| Tissue | Expression Dynamics | Abbreviation |
| Cervix | 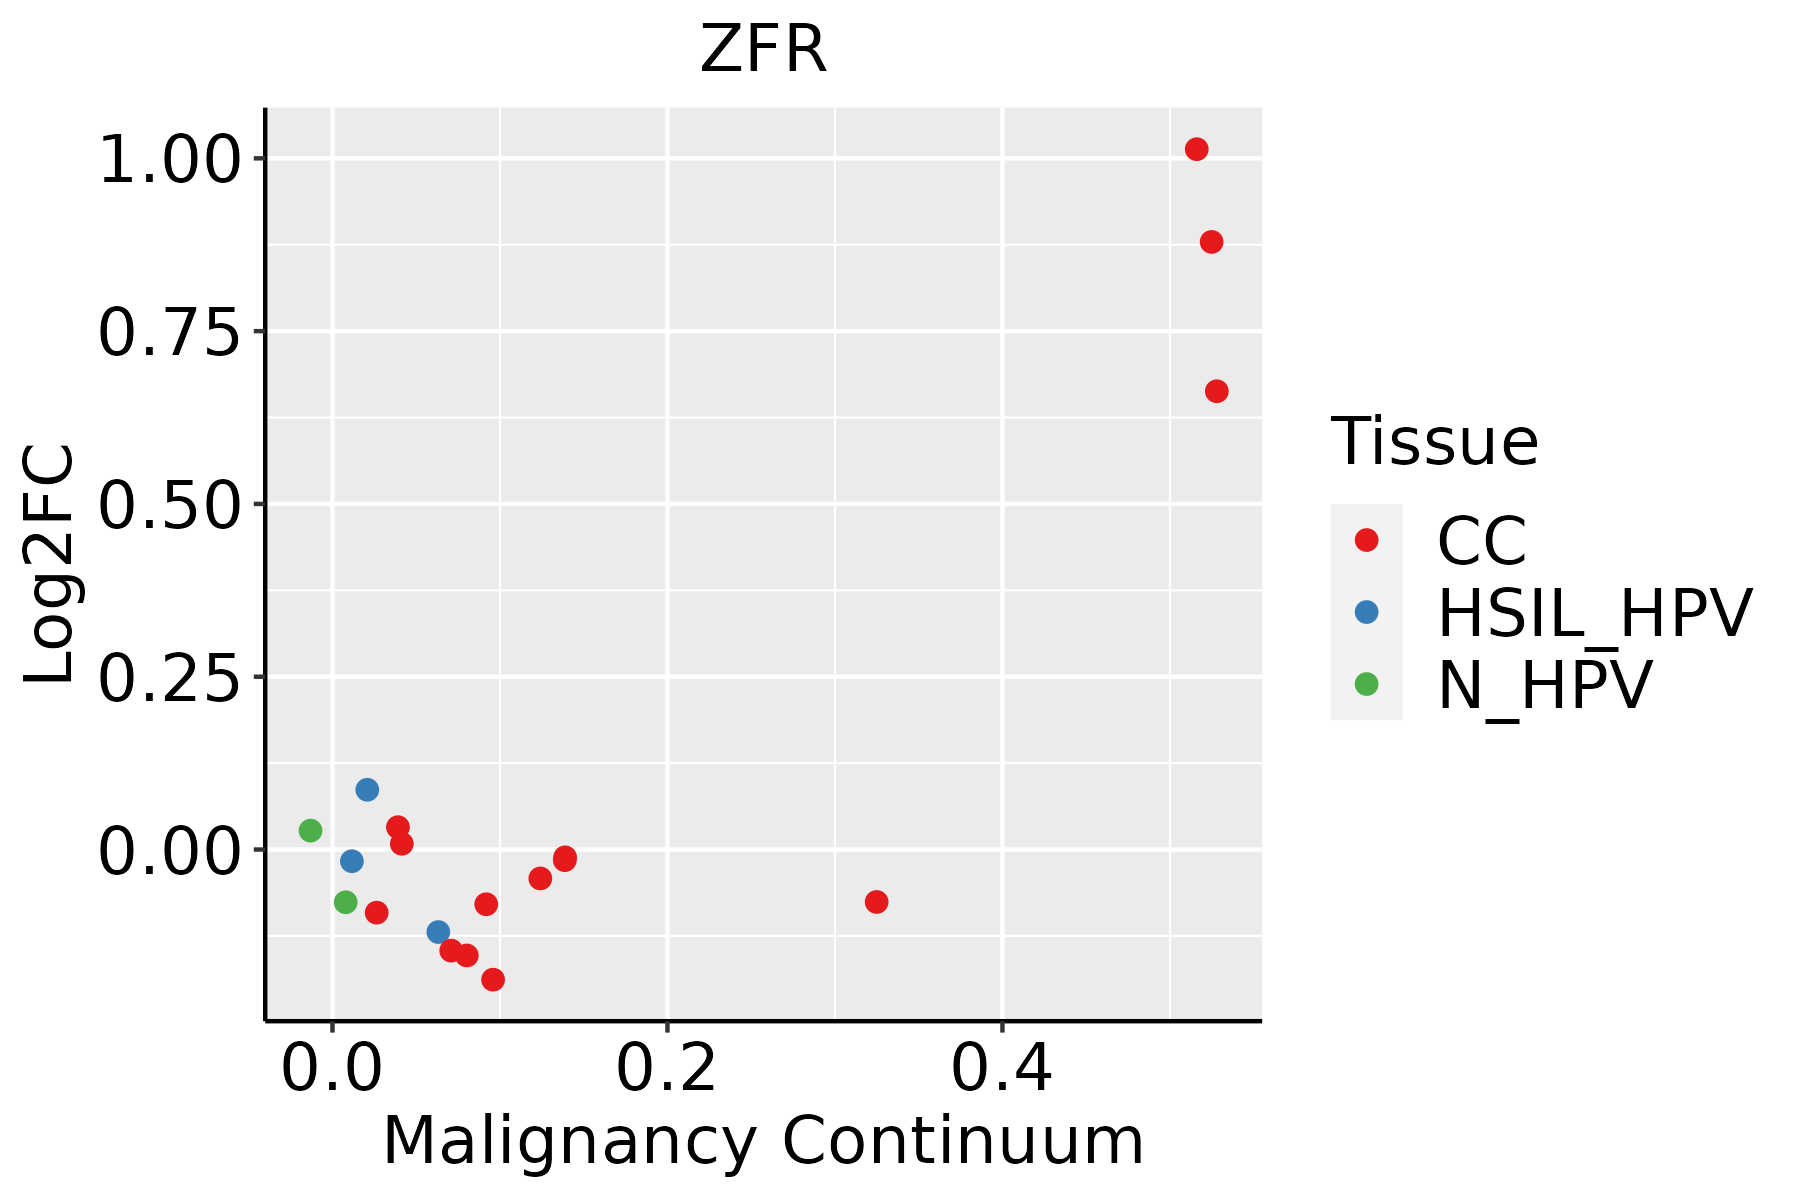 | CC: Cervix cancer |
| HSIL_HPV: HPV-infected high-grade squamous intraepithelial lesions | ||
| N_HPV: HPV-infected normal cervix | ||
| Colorectum (GSE201348) |  | FAP: Familial adenomatous polyposis |
| CRC: Colorectal cancer | ||
| Colorectum (HTA11) | 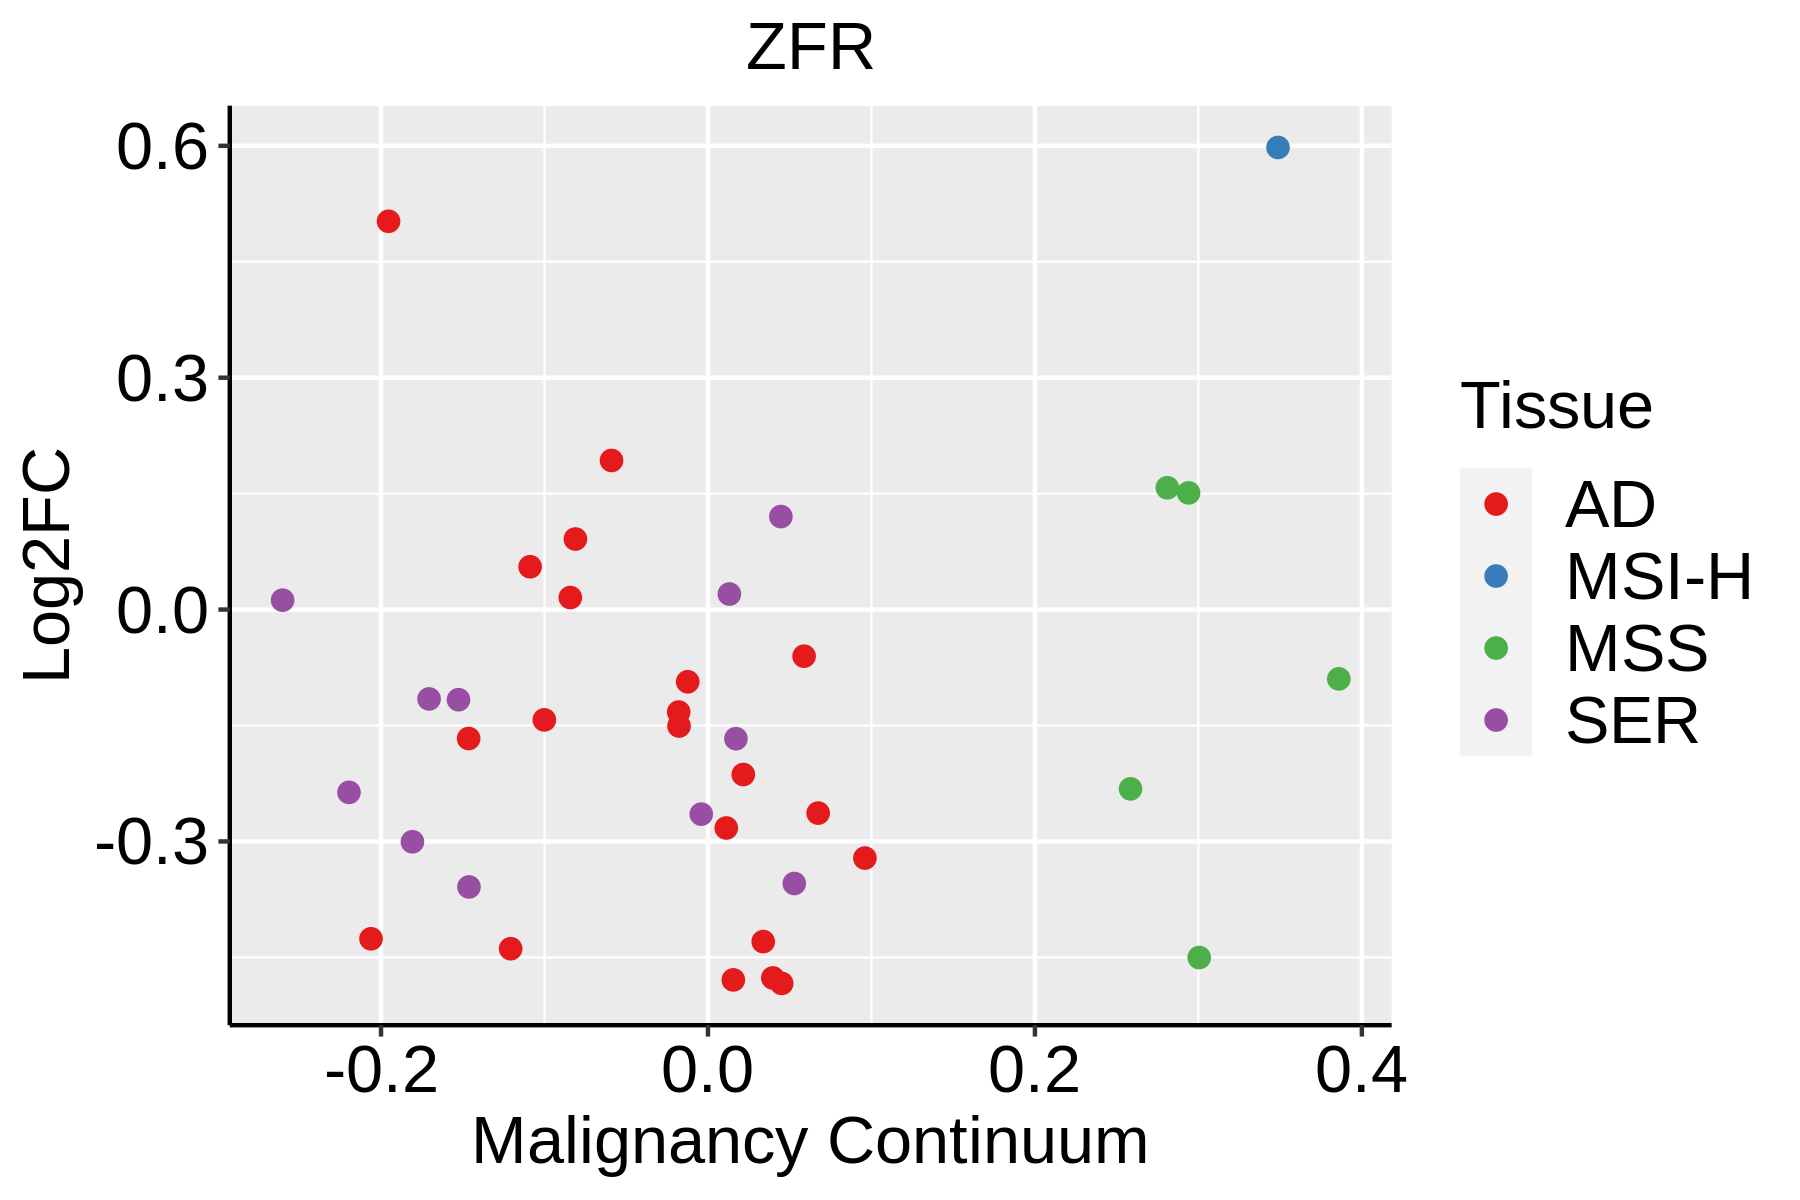 | AD: Adenomas |
| SER: Sessile serrated lesions | ||
| MSI-H: Microsatellite-high colorectal cancer | ||
| MSS: Microsatellite stable colorectal cancer | ||
| Esophagus | 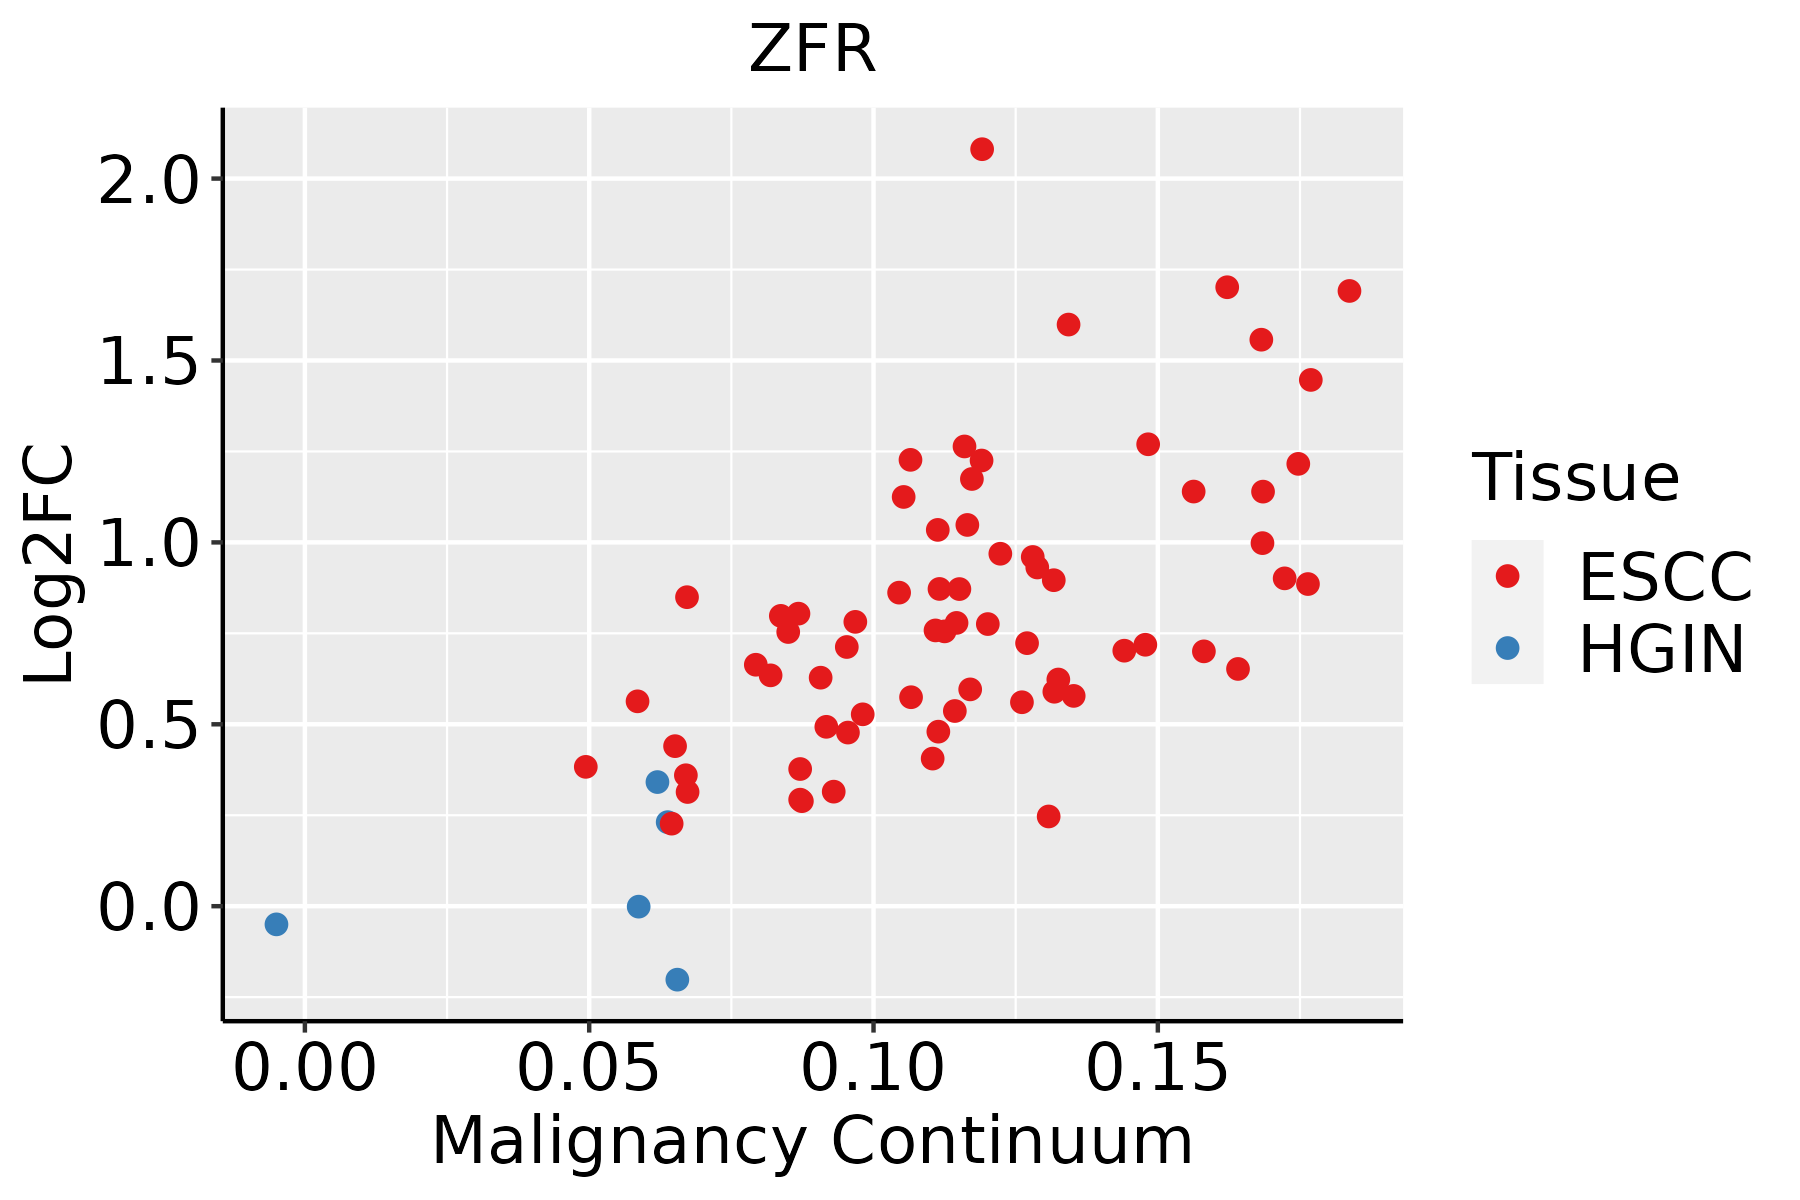 | ESCC: Esophageal squamous cell carcinoma |
| HGIN: High-grade intraepithelial neoplasias | ||
| LGIN: Low-grade intraepithelial neoplasias | ||
| Liver | 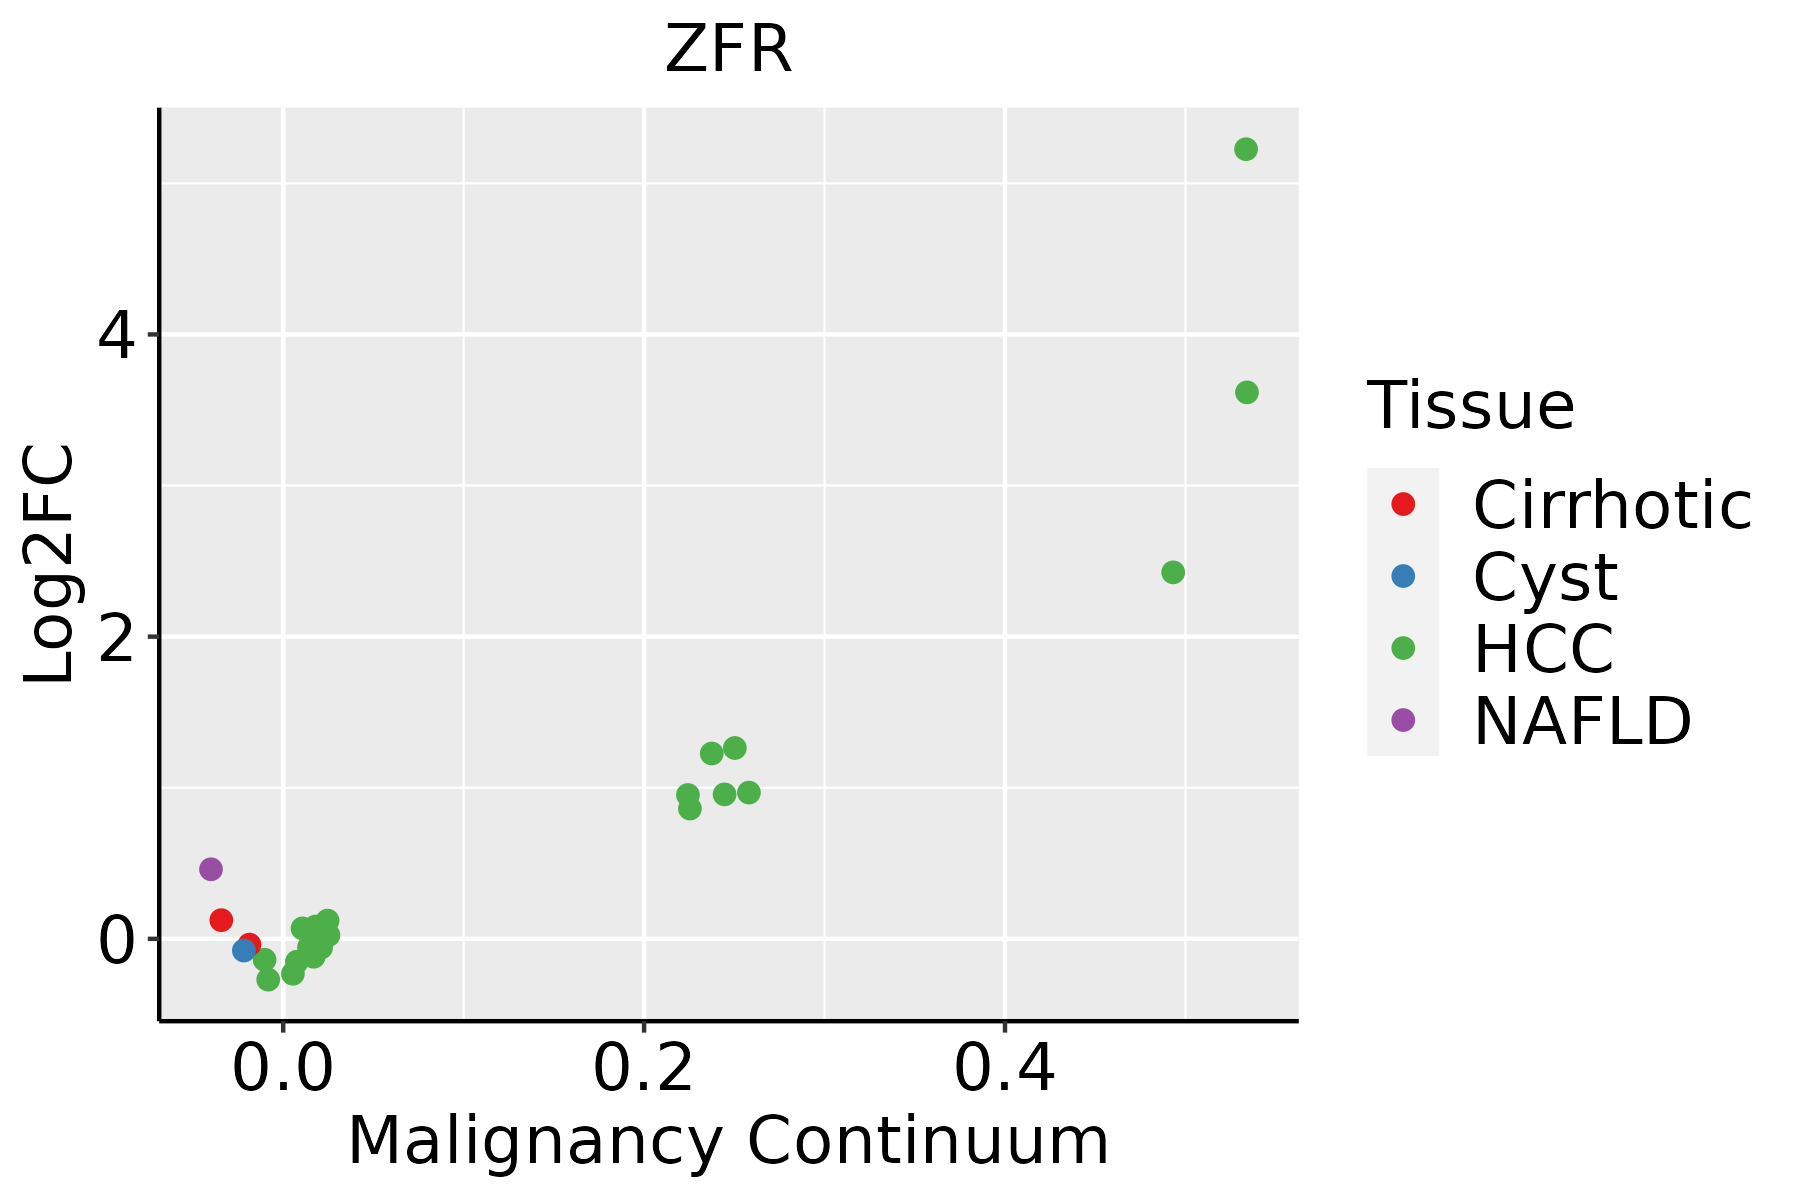 | HCC: Hepatocellular carcinoma |
| NAFLD: Non-alcoholic fatty liver disease | ||
| Oral Cavity | 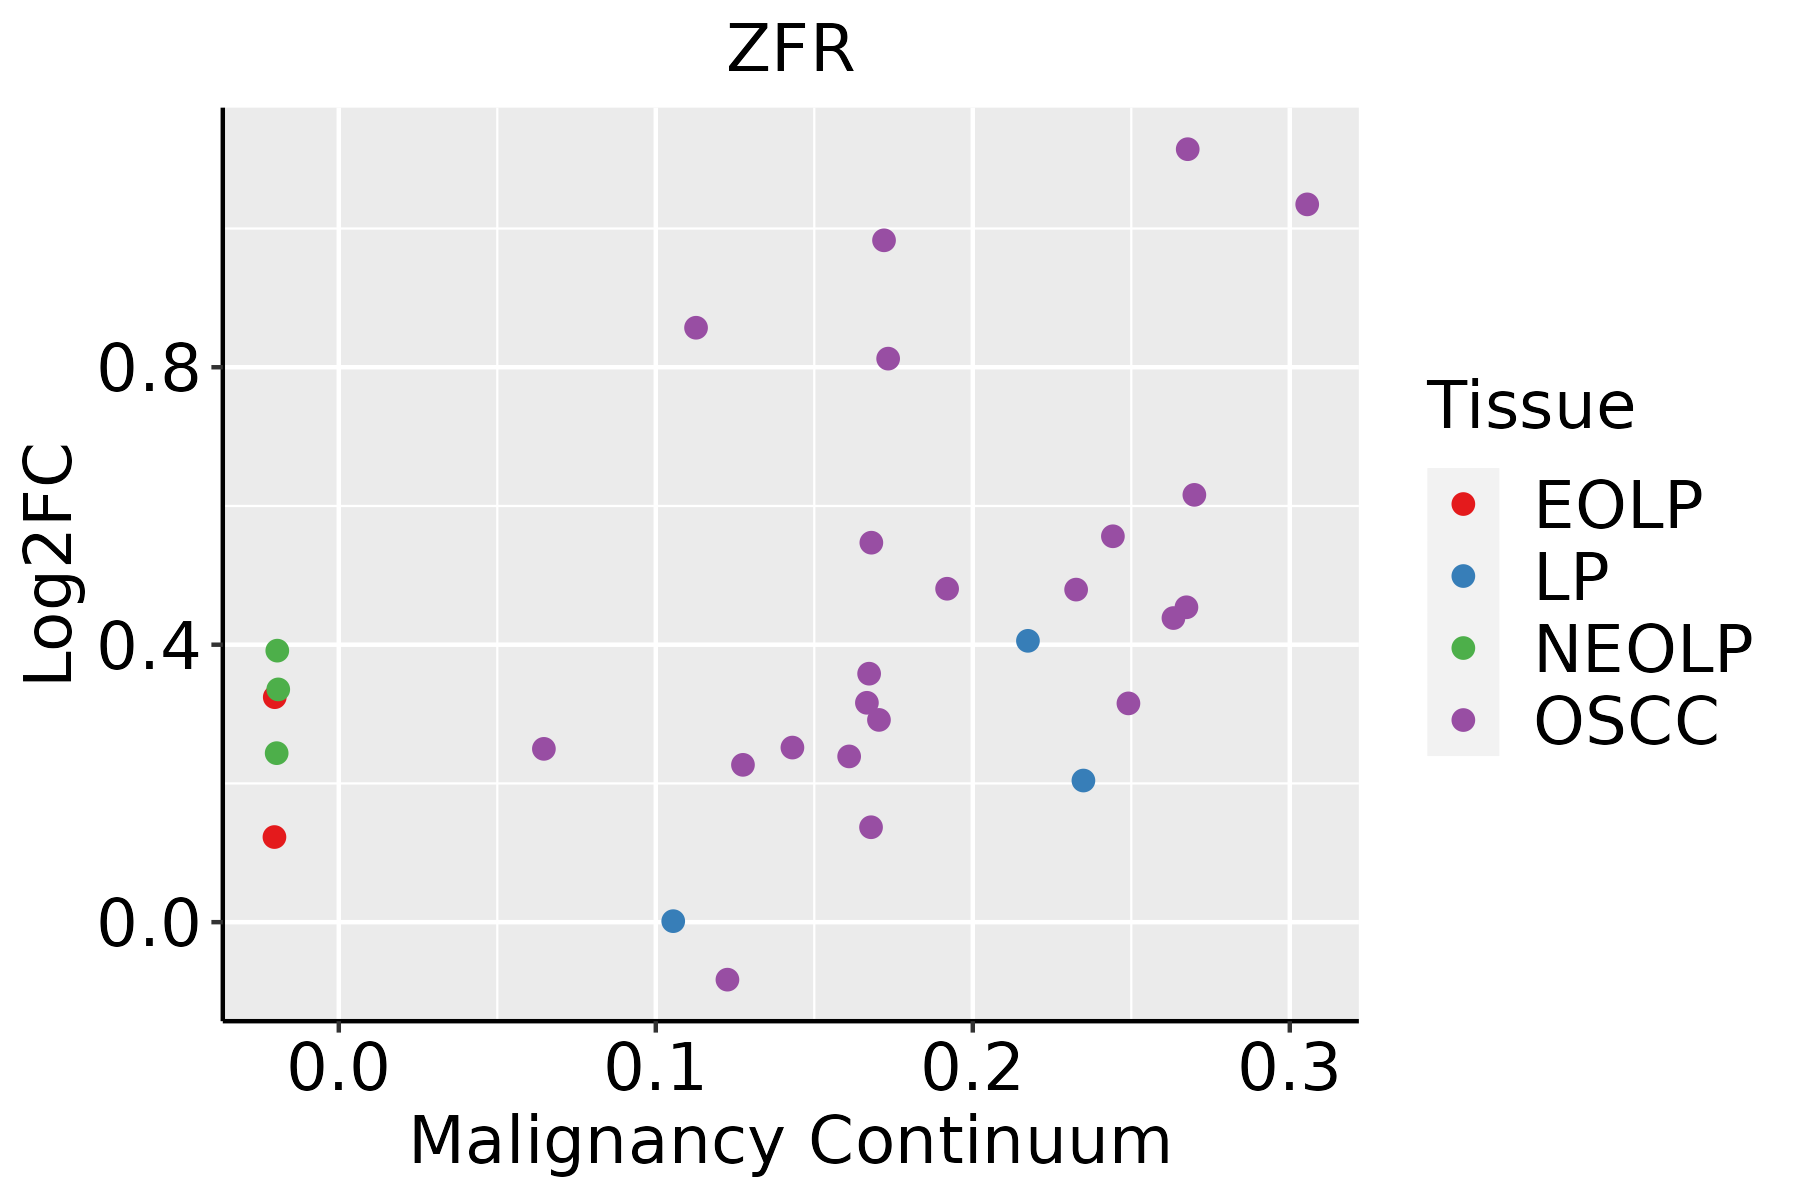 | EOLP: Erosive Oral lichen planus |
| LP: leukoplakia | ||
| NEOLP: Non-erosive oral lichen planus | ||
| OSCC: Oral squamous cell carcinoma | ||
| Prostate |  | BPH: Benign Prostatic Hyperplasia |
| Skin | 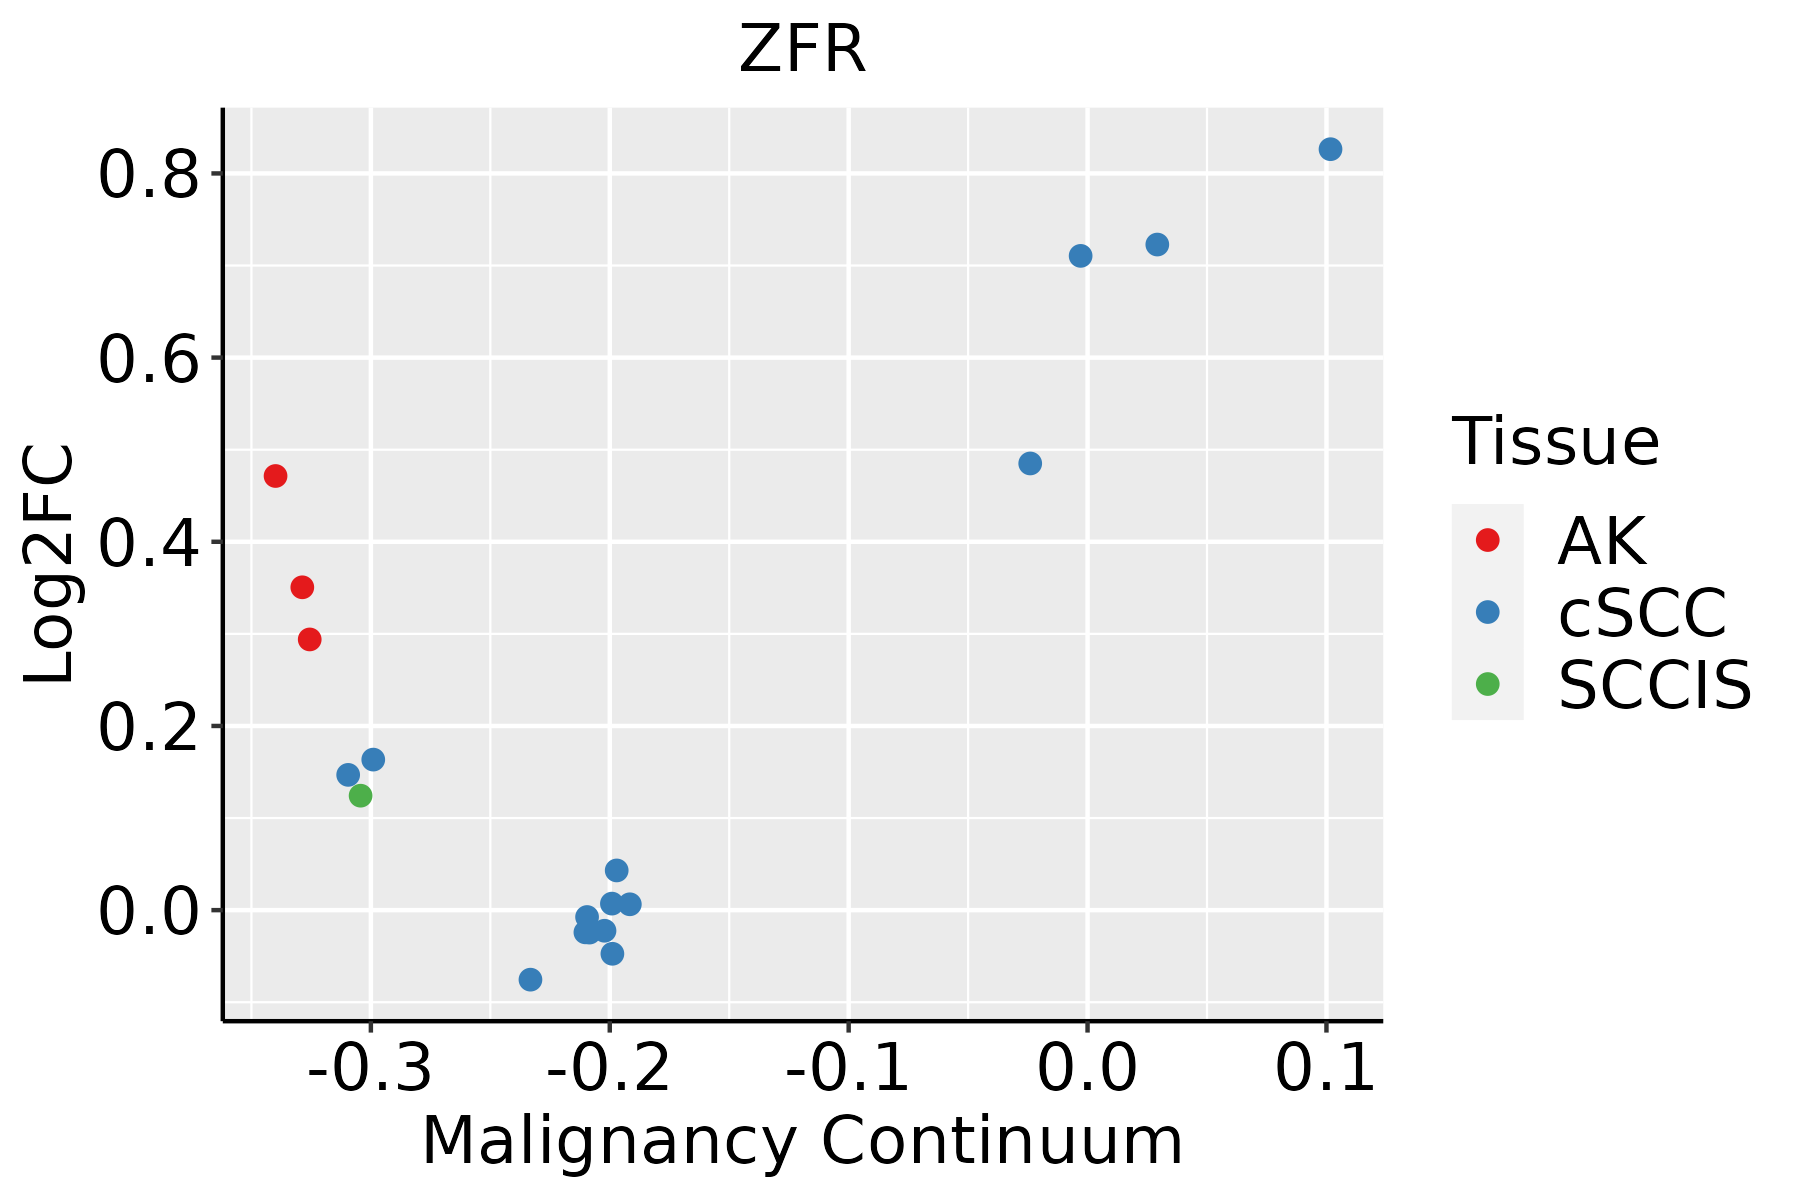 | AK: Actinic keratosis |
| cSCC: Cutaneous squamous cell carcinoma | ||
| SCCIS:squamous cell carcinoma in situ | ||
| Thyroid |  | ATC: Anaplastic thyroid cancer |
| HT: Hashimoto's thyroiditis | ||
| PTC: Papillary thyroid cancer |
| ∗log2FC in expression of this searched gene in stem-like cells from each diseased tissue sample relative to stem-like cells in normal samples in each tissue plotted against the malignancy continuum. Samples are colored based on if they are from different disease stage. |
Top |
Malignant transformation related pathway analysis |
| Find out the enriched GO biological processes and KEGG pathways involved in transition from healthy to precancer to cancer |
| Tissue | Disease Stage | Enriched GO biological Processes |
| Colorectum | AD |  |
| Colorectum | SER |  |
| Colorectum | MSS |  |
| Colorectum | MSI-H |  |
| Colorectum | FAP |  |
| ∗Top 15 enriched GO BP terms are showed in the bar plot of each disease state in each tissue. Each row represents a significant GO biological process which is colored according to the -log10(p.adjust). |
| Page: 1 2 3 4 5 6 7 8 9 |
| GO ID | Tissue | Disease Stage | Description | Gene Ratio | Bg Ratio | pvalue | p.adjust | Count |
| Page: 1 |
| Pathway ID | Tissue | Disease Stage | Description | Gene Ratio | Bg Ratio | pvalue | p.adjust | qvalue | Count |
| Page: 1 |
Top |
Cell-cell communication analysis |
| Identification of potential cell-cell interactions between two cell types and their ligand-receptor pairs for different disease states |
| Ligand | Receptor | LRpair | Pathway | Tissue | Disease Stage |
| Page: 1 |
Top |
Single-cell gene regulatory network inference analysis |
| Find out the significant the regulons (TFs) and the target genes of each regulon across cell types for different disease states |
| TF | Cell Type | Tissue | Disease Stage | Target Gene | RSS | Regulon Activity |
| ∗The dot plots of a searched regulon are shown for all cell subpopulations in each disease state of each tissue based on the regulon specific score inferred using pySCENIC and by calculating the average expression. |
| Page: 1 |
Top |
Somatic mutation of malignant transformation related genes |
| Annotation of somatic variants for genes involved in malignant transformation |
| Hugo Symbol | Variant Class | Variant Classification | dbSNP RS | HGVSc | HGVSp | HGVSp Short | SWISSPROT | BIOTYPE | SIFT | PolyPhen | Tumor Sample Barcode | Tissue | Histology | Sex | Age | Stage | Therapy Types | Drugs | Outcome |
| ZFR | SNV | Missense_Mutation | c.2909N>C | p.Arg970Thr | p.R970T | Q96KR1 | protein_coding | deleterious(0) | probably_damaging(0.977) | TCGA-AC-A23H-01 | Breast | breast invasive carcinoma | Female | >=65 | I/II | Unknown | Unknown | PD | |
| ZFR | SNV | Missense_Mutation | rs867948868 | c.226G>T | p.Val76Phe | p.V76F | Q96KR1 | protein_coding | deleterious(0) | probably_damaging(0.969) | TCGA-AO-A1KR-01 | Breast | breast invasive carcinoma | Female | <65 | I/II | Chemotherapy | cyclophosphamide | SD |
| ZFR | SNV | Missense_Mutation | c.1316N>T | p.Ala439Val | p.A439V | Q96KR1 | protein_coding | tolerated(0.06) | benign(0.001) | TCGA-BH-A0HF-01 | Breast | breast invasive carcinoma | Female | >=65 | I/II | Hormone Therapy | arimidex | SD | |
| ZFR | SNV | Missense_Mutation | c.2369N>C | p.Arg790Pro | p.R790P | Q96KR1 | protein_coding | deleterious(0) | probably_damaging(0.995) | TCGA-C8-A26Y-01 | Breast | breast invasive carcinoma | Female | >=65 | I/II | Unknown | Unknown | SD | |
| ZFR | SNV | Missense_Mutation | c.3088C>G | p.Leu1030Val | p.L1030V | Q96KR1 | protein_coding | deleterious(0) | probably_damaging(0.973) | TCGA-D8-A13Z-01 | Breast | breast invasive carcinoma | Female | <65 | I/II | Chemotherapy | doxorubicine | SD | |
| ZFR | SNV | Missense_Mutation | novel | c.128C>A | p.Ala43Asp | p.A43D | Q96KR1 | protein_coding | deleterious(0.01) | benign(0.247) | TCGA-D8-A1XK-01 | Breast | breast invasive carcinoma | Female | <65 | I/II | Chemotherapy | doxorubicine+cyclophosphamide | SD |
| ZFR | SNV | Missense_Mutation | rs762336583 | c.3094N>G | p.Met1032Val | p.M1032V | Q96KR1 | protein_coding | deleterious(0) | possibly_damaging(0.59) | TCGA-E2-A14S-01 | Breast | breast invasive carcinoma | Female | >=65 | I/II | Chemotherapy | cytoxan | SD |
| ZFR | SNV | Missense_Mutation | novel | c.3187G>A | p.Glu1063Lys | p.E1063K | Q96KR1 | protein_coding | tolerated(0.1) | benign(0.074) | TCGA-LL-A6FR-01 | Breast | breast invasive carcinoma | Female | <65 | I/II | Chemotherapy | adriamycin | SD |
| ZFR | insertion | Nonsense_Mutation | novel | c.846_847insTAGGTGTTTTTTTCCCACACACC | p.Gln283Ter | p.Q283* | Q96KR1 | protein_coding | TCGA-A2-A0EV-01 | Breast | breast invasive carcinoma | Female | >=65 | I/II | Unknown | Unknown | SD | ||
| ZFR | insertion | Frame_Shift_Ins | novel | c.163_164insTTACATTTATCCTGTCAAGATGTTCTTTTTTAATACATATTATAAC | p.Tyr55PhefsTer24 | p.Y55Ffs*24 | Q96KR1 | protein_coding | TCGA-A8-A09Q-01 | Breast | breast invasive carcinoma | Female | >=65 | III/IV | Hormone Therapy | anastrozole | SD |
| Page: 1 2 3 4 5 6 7 8 9 10 11 12 13 14 15 |
Top |
Related drugs of malignant transformation related genes |
| Identification of chemicals and drugs interact with genes involved in malignant transfromation |
| (DGIdb 4.0) |
| Entrez ID | Symbol | Category | Interaction Types | Drug Claim Name | Drug Name | PMIDs |
| Page: 1 |

Copyright 2023-Present -The University of Texas Health Science Center at Houston |