| Tissue | Expression Dynamics | Abbreviation |
| Cervix | 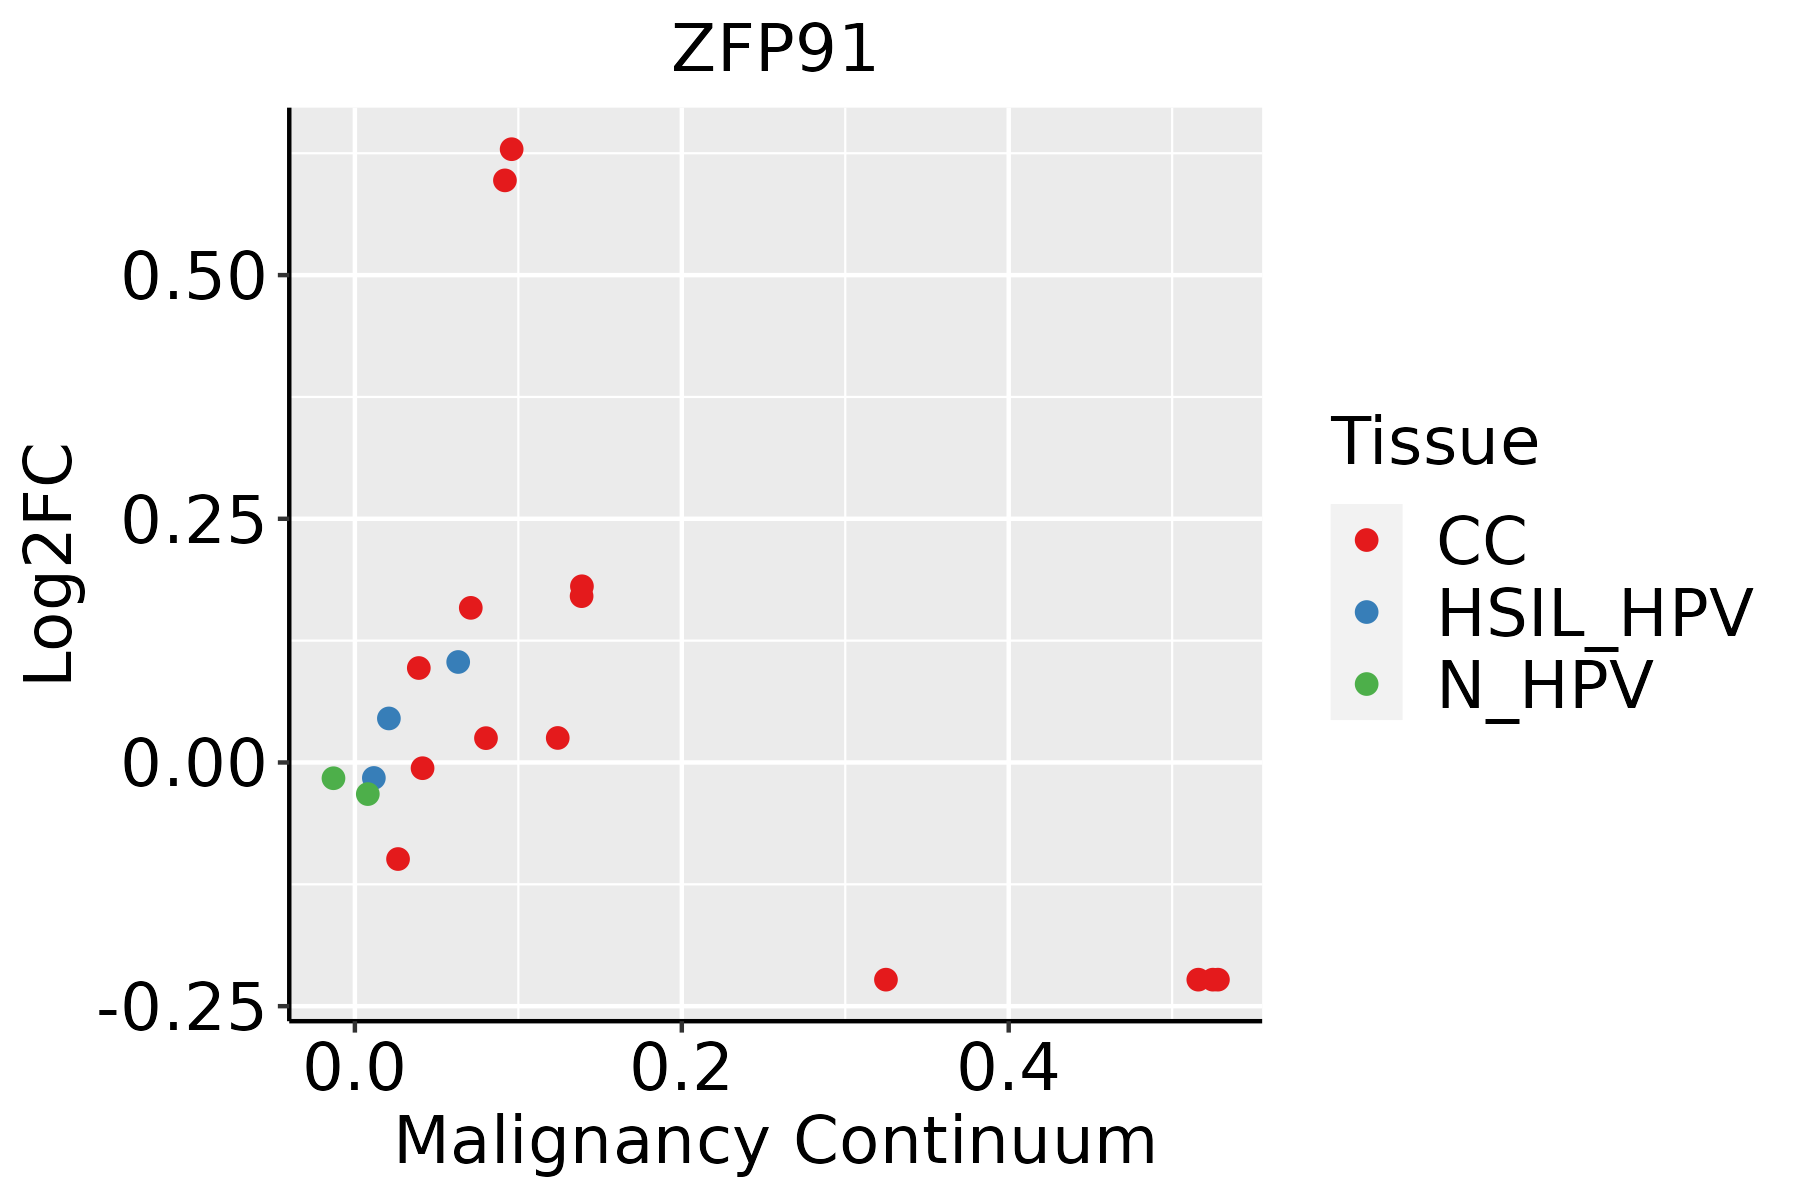 | CC: Cervix cancer |
| HSIL_HPV: HPV-infected high-grade squamous intraepithelial lesions |
| N_HPV: HPV-infected normal cervix |
| Colorectum (GSE201348) |  | FAP: Familial adenomatous polyposis |
| CRC: Colorectal cancer |
| Colorectum (HTA11) |  | AD: Adenomas |
| SER: Sessile serrated lesions |
| MSI-H: Microsatellite-high colorectal cancer |
| MSS: Microsatellite stable colorectal cancer |
| Esophagus | 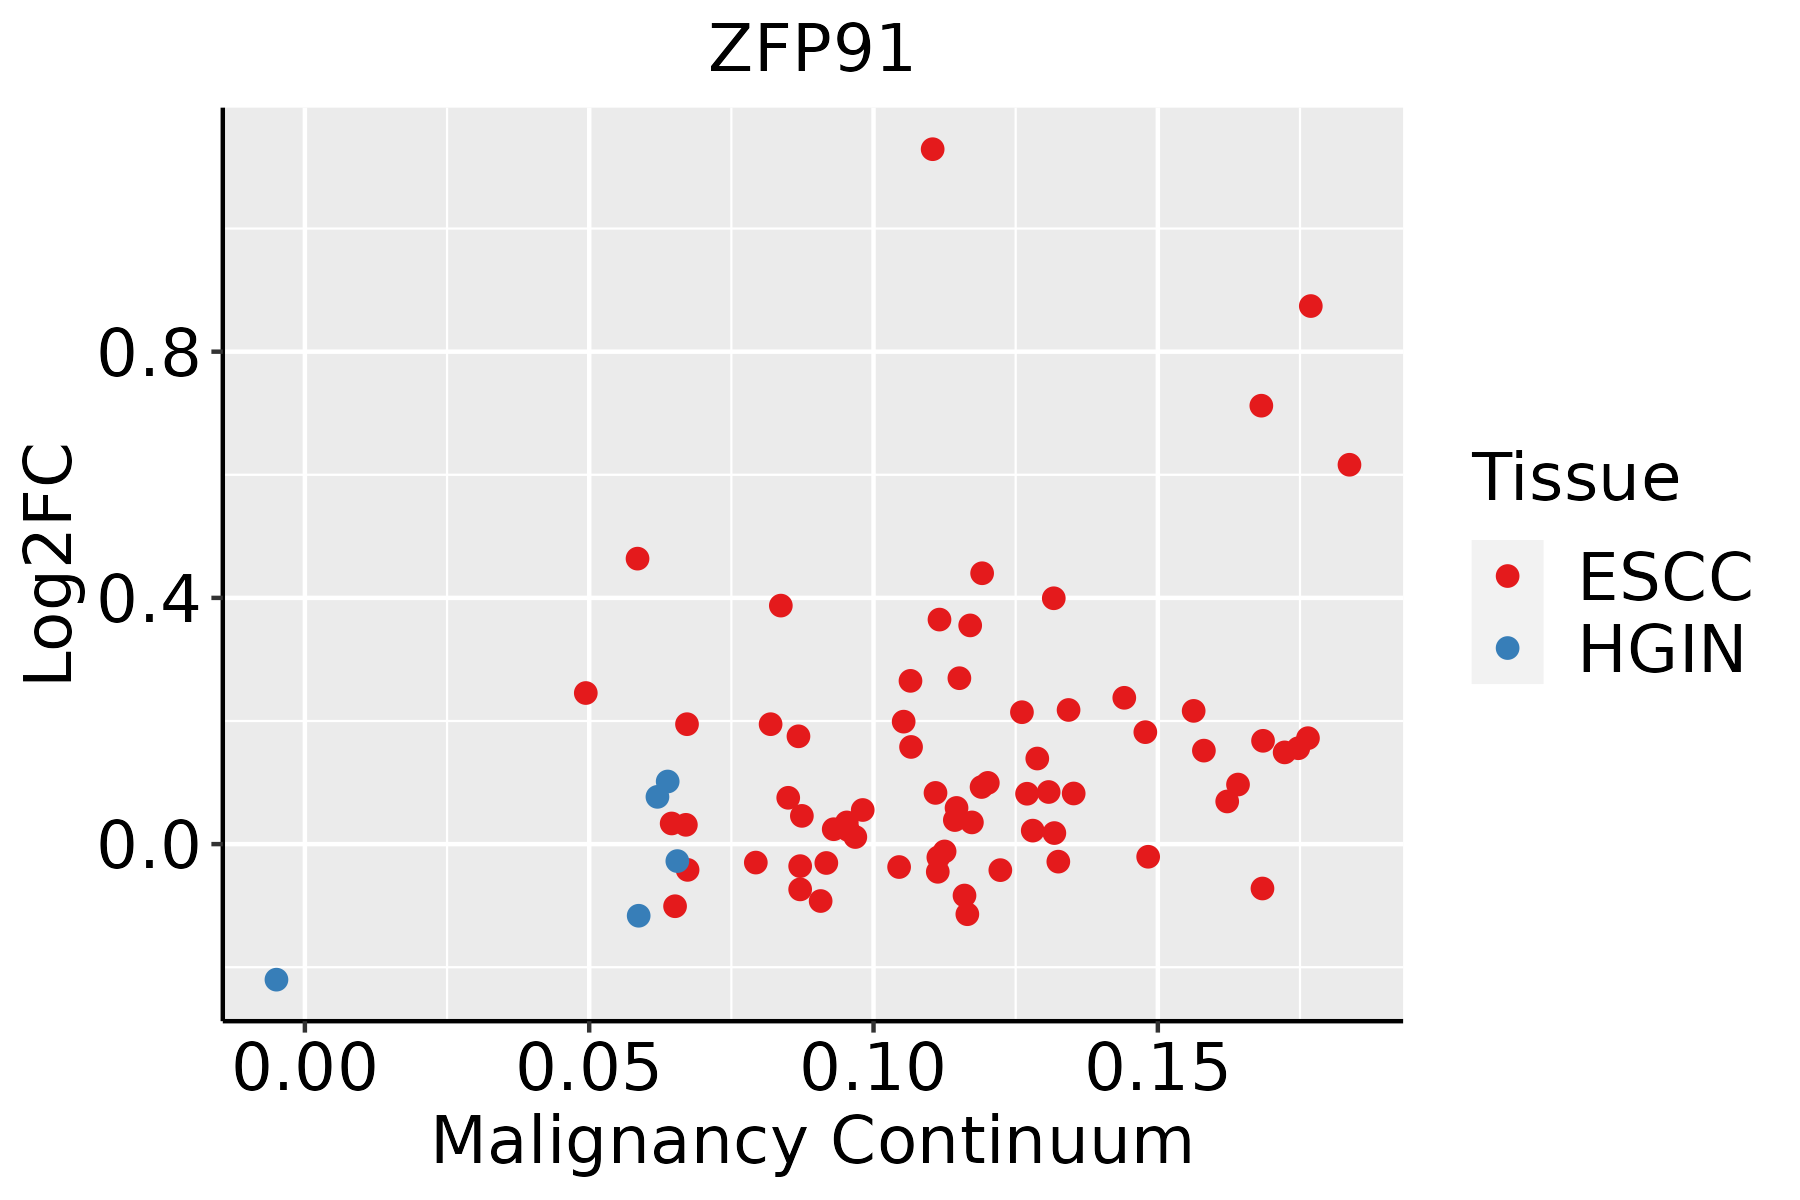 | ESCC: Esophageal squamous cell carcinoma |
| HGIN: High-grade intraepithelial neoplasias |
| LGIN: Low-grade intraepithelial neoplasias |
| Liver | 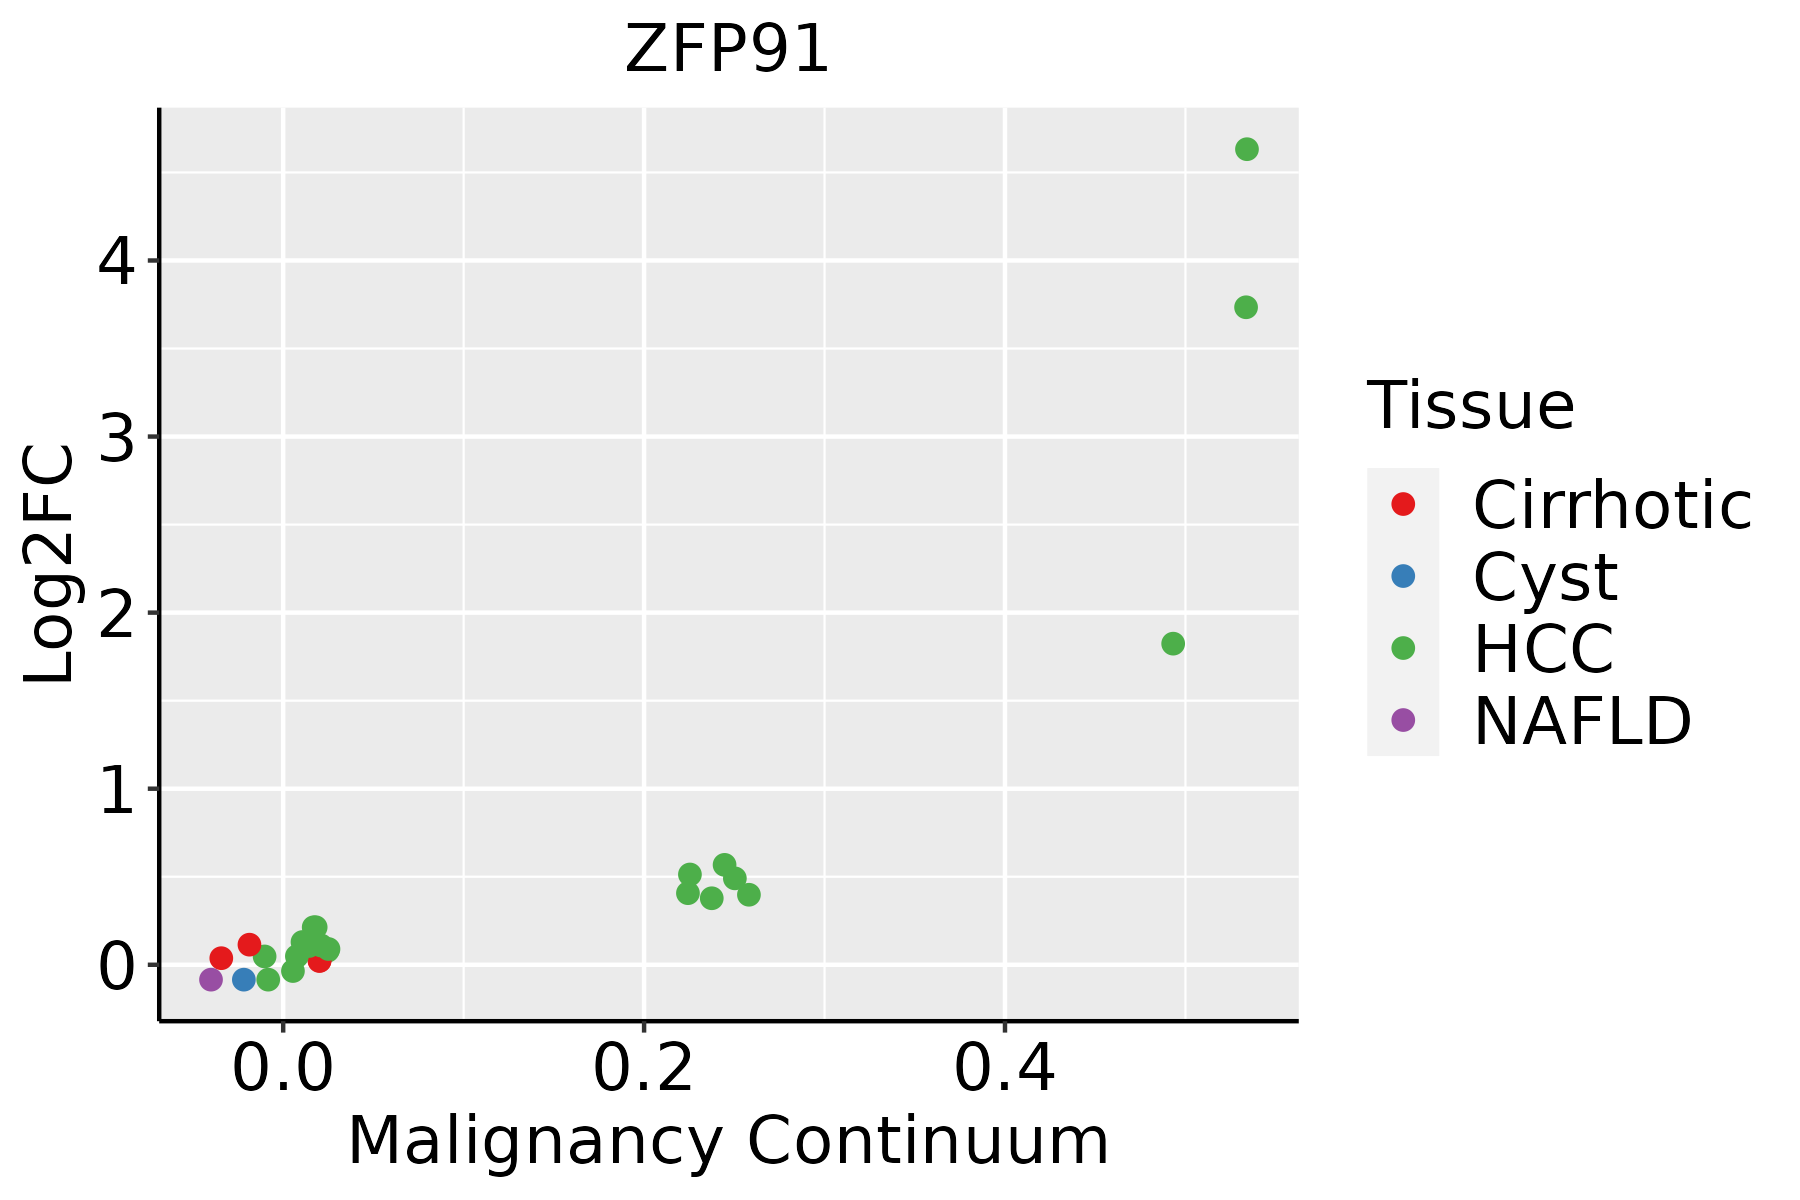 | HCC: Hepatocellular carcinoma |
| NAFLD: Non-alcoholic fatty liver disease |
| Oral Cavity |  | EOLP: Erosive Oral lichen planus |
| LP: leukoplakia |
| NEOLP: Non-erosive oral lichen planus |
| OSCC: Oral squamous cell carcinoma |
| Skin |  | AK: Actinic keratosis |
| cSCC: Cutaneous squamous cell carcinoma |
| SCCIS:squamous cell carcinoma in situ |
| Thyroid | 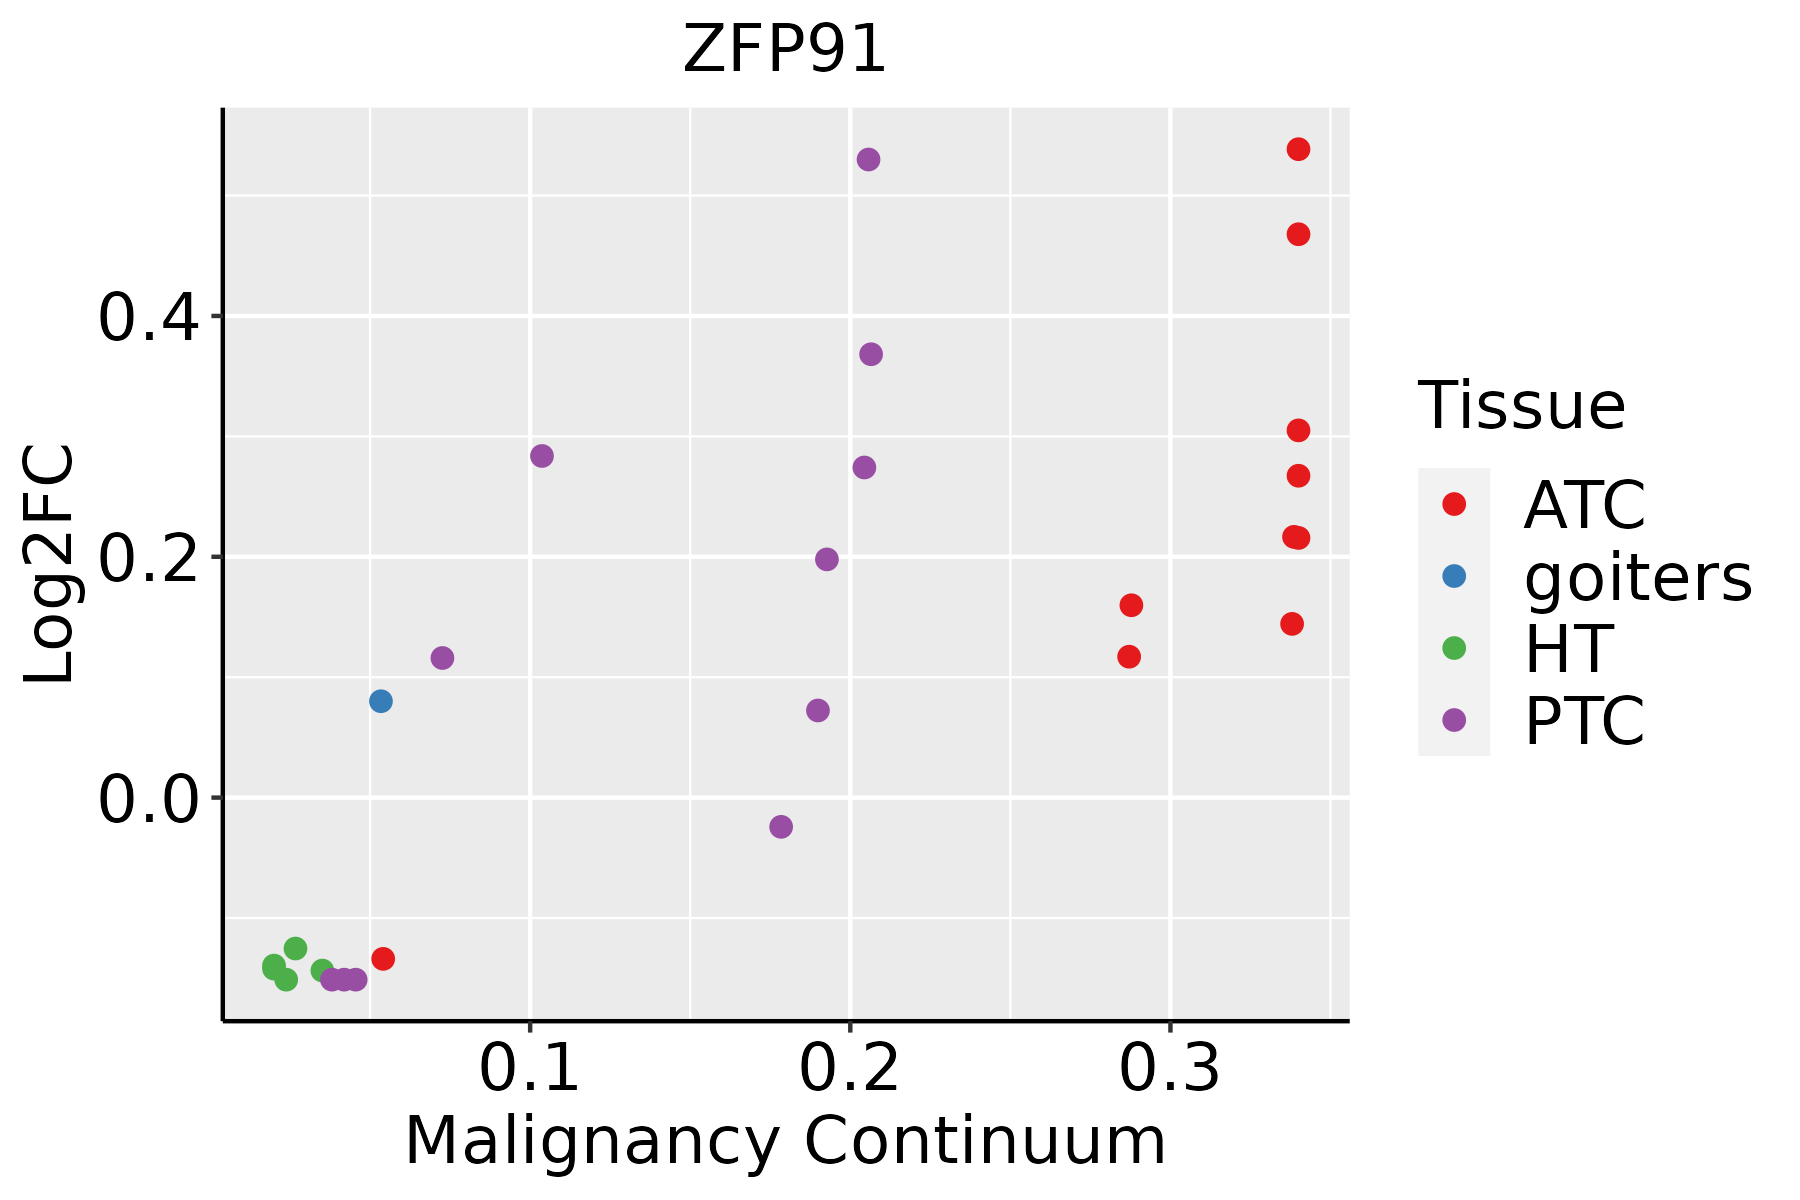 | ATC: Anaplastic thyroid cancer |
| HT: Hashimoto's thyroiditis |
| PTC: Papillary thyroid cancer |
| GO ID | Tissue | Disease Stage | Description | Gene Ratio | Bg Ratio | pvalue | p.adjust | Count |
| GO:003367410 | Cervix | CC | positive regulation of kinase activity | 101/2311 | 467/18723 | 8.66e-09 | 7.22e-07 | 101 |
| GO:00458608 | Cervix | CC | positive regulation of protein kinase activity | 85/2311 | 386/18723 | 5.61e-08 | 3.29e-06 | 85 |
| GO:00002097 | Cervix | CC | protein polyubiquitination | 58/2311 | 236/18723 | 1.57e-07 | 7.41e-06 | 58 |
| GO:00705343 | Cervix | CC | protein K63-linked ubiquitination | 14/2311 | 56/18723 | 6.93e-03 | 3.74e-02 | 14 |
| GO:0000209 | Colorectum | AD | protein polyubiquitination | 78/3918 | 236/18723 | 8.71e-06 | 2.06e-04 | 78 |
| GO:0033674 | Colorectum | AD | positive regulation of kinase activity | 131/3918 | 467/18723 | 1.28e-04 | 1.85e-03 | 131 |
| GO:0045860 | Colorectum | AD | positive regulation of protein kinase activity | 107/3918 | 386/18723 | 8.01e-04 | 7.92e-03 | 107 |
| GO:0070534 | Colorectum | AD | protein K63-linked ubiquitination | 20/3918 | 56/18723 | 7.57e-03 | 4.58e-02 | 20 |
| GO:00002091 | Colorectum | SER | protein polyubiquitination | 58/2897 | 236/18723 | 1.69e-04 | 3.18e-03 | 58 |
| GO:00336741 | Colorectum | SER | positive regulation of kinase activity | 95/2897 | 467/18723 | 2.62e-03 | 2.41e-02 | 95 |
| GO:00458601 | Colorectum | SER | positive regulation of protein kinase activity | 79/2897 | 386/18723 | 4.85e-03 | 3.79e-02 | 79 |
| GO:00002092 | Colorectum | MSS | protein polyubiquitination | 72/3467 | 236/18723 | 5.19e-06 | 1.42e-04 | 72 |
| GO:00336742 | Colorectum | MSS | positive regulation of kinase activity | 122/3467 | 467/18723 | 2.50e-05 | 5.21e-04 | 122 |
| GO:00458602 | Colorectum | MSS | positive regulation of protein kinase activity | 102/3467 | 386/18723 | 6.93e-05 | 1.20e-03 | 102 |
| GO:00705341 | Colorectum | MSS | protein K63-linked ubiquitination | 21/3467 | 56/18723 | 6.51e-04 | 7.06e-03 | 21 |
| GO:00336743 | Colorectum | MSI-H | positive regulation of kinase activity | 53/1319 | 467/18723 | 3.99e-04 | 8.98e-03 | 53 |
| GO:00458603 | Colorectum | MSI-H | positive regulation of protein kinase activity | 45/1319 | 386/18723 | 6.03e-04 | 1.19e-02 | 45 |
| GO:000020917 | Esophagus | ESCC | protein polyubiquitination | 170/8552 | 236/18723 | 1.40e-16 | 1.09e-14 | 170 |
| GO:007053413 | Esophagus | ESCC | protein K63-linked ubiquitination | 44/8552 | 56/18723 | 4.84e-07 | 6.50e-06 | 44 |
| GO:004586018 | Esophagus | ESCC | positive regulation of protein kinase activity | 219/8552 | 386/18723 | 6.91e-06 | 6.97e-05 | 219 |
| Hugo Symbol | Variant Class | Variant Classification | dbSNP RS | HGVSc | HGVSp | HGVSp Short | SWISSPROT | BIOTYPE | SIFT | PolyPhen | Tumor Sample Barcode | Tissue | Histology | Sex | Age | Stage | Therapy Types | Drugs | Outcome |
| ZFP91 | SNV | Missense_Mutation | novel | c.1024T>A | p.Tyr342Asn | p.Y342N | Q96JP5 | protein_coding | deleterious(0) | possibly_damaging(0.829) | TCGA-A1-A0SD-01 | Breast | breast invasive carcinoma | Female | <65 | I/II | Unknown | Unknown | SD |
| ZFP91 | SNV | Missense_Mutation | novel | c.1307G>C | p.Gly436Ala | p.G436A | Q96JP5 | protein_coding | deleterious(0.02) | benign(0.299) | TCGA-A7-A2KD-01 | Breast | breast invasive carcinoma | Female | <65 | III/IV | Chemotherapy | cytoxan | SD |
| ZFP91 | SNV | Missense_Mutation | | c.1006N>T | p.His336Tyr | p.H336Y | Q96JP5 | protein_coding | deleterious(0) | possibly_damaging(0.714) | TCGA-A8-A09Z-01 | Breast | breast invasive carcinoma | Female | >=65 | I/II | Unknown | Unknown | SD |
| ZFP91 | SNV | Missense_Mutation | | c.1562G>A | p.Ser521Asn | p.S521N | Q96JP5 | protein_coding | tolerated_low_confidence(0.11) | benign(0.038) | TCGA-AC-A23H-01 | Breast | breast invasive carcinoma | Female | >=65 | I/II | Unknown | Unknown | PD |
| ZFP91 | SNV | Missense_Mutation | novel | c.1151C>T | p.Ser384Phe | p.S384F | Q96JP5 | protein_coding | deleterious(0) | probably_damaging(0.964) | TCGA-AC-A5XS-01 | Breast | breast invasive carcinoma | Female | >=65 | I/II | Hormone Therapy | femara | SD |
| ZFP91 | SNV | Missense_Mutation | rs371090648 | c.449N>A | p.Arg150Gln | p.R150Q | Q96JP5 | protein_coding | deleterious_low_confidence(0) | probably_damaging(0.921) | TCGA-BH-A0HF-01 | Breast | breast invasive carcinoma | Female | >=65 | I/II | Hormone Therapy | arimidex | SD |
| ZFP91 | SNV | Missense_Mutation | | c.1441N>A | p.Glu481Lys | p.E481K | Q96JP5 | protein_coding | deleterious_low_confidence(0) | probably_damaging(0.98) | TCGA-D8-A1JD-01 | Breast | breast invasive carcinoma | Female | <65 | I/II | Chemotherapy | adriamycin | SD |
| ZFP91 | SNV | Missense_Mutation | novel | c.1217N>T | p.Gly406Val | p.G406V | Q96JP5 | protein_coding | deleterious(0) | probably_damaging(0.999) | TCGA-EW-A1OZ-01 | Breast | breast invasive carcinoma | Female | <65 | I/II | Targeted Molecular therapy | trastuzumab | SD |
| ZFP91 | insertion | Frame_Shift_Ins | novel | c.1314dupA | p.Phe439IlefsTer2 | p.F439Ifs*2 | Q96JP5 | protein_coding | | | TCGA-AN-A04D-01 | Breast | breast invasive carcinoma | Female | <65 | I/II | Unknown | Unknown | SD |
| ZFP91 | SNV | Missense_Mutation | | c.718N>C | p.Glu240Gln | p.E240Q | Q96JP5 | protein_coding | deleterious(0.04) | benign(0.026) | TCGA-DR-A0ZM-01 | Cervix | cervical & endocervical cancer | Female | <65 | III/IV | Unspecific | Cisplatin | SD |


