
|
|||||
|
 | |
| |
| |
| |
| |
| |
|
Gene: ZFP90 |
Gene summary for ZFP90 |
| Gene information | Species | Human | Gene symbol | ZFP90 | Gene ID | 146198 |
| Gene name | ZFP90 zinc finger protein | |
| Gene Alias | FIK | |
| Cytomap | 16q22.1 | |
| Gene Type | protein-coding | GO ID | GO:0000122 | UniProtAcc | Q8TF47 |
Top |
Malignant transformation analysis |
| Identification of the aberrant gene expression in precancerous and cancerous lesions by comparing the gene expression of stem-like cells in diseased tissues with normal stem cells |
| Entrez ID | Symbol | Replicates | Species | Organ | Tissue | Adj P-value | Log2FC | Malignancy |
| 146198 | ZFP90 | LZE2T | Human | Esophagus | ESCC | 1.36e-04 | 3.85e-01 | 0.082 |
| 146198 | ZFP90 | LZE4T | Human | Esophagus | ESCC | 4.44e-08 | 2.60e-01 | 0.0811 |
| 146198 | ZFP90 | LZE7T | Human | Esophagus | ESCC | 4.16e-03 | 1.47e-01 | 0.0667 |
| 146198 | ZFP90 | LZE8T | Human | Esophagus | ESCC | 3.08e-02 | 9.15e-02 | 0.067 |
| 146198 | ZFP90 | LZE20T | Human | Esophagus | ESCC | 2.87e-05 | 1.35e-01 | 0.0662 |
| 146198 | ZFP90 | LZE24T | Human | Esophagus | ESCC | 7.51e-12 | 3.06e-01 | 0.0596 |
| 146198 | ZFP90 | LZE21T | Human | Esophagus | ESCC | 4.66e-03 | 1.77e-01 | 0.0655 |
| 146198 | ZFP90 | P1T-E | Human | Esophagus | ESCC | 2.34e-07 | 3.52e-01 | 0.0875 |
| 146198 | ZFP90 | P2T-E | Human | Esophagus | ESCC | 4.40e-28 | 3.96e-01 | 0.1177 |
| 146198 | ZFP90 | P4T-E | Human | Esophagus | ESCC | 1.70e-16 | 4.13e-01 | 0.1323 |
| 146198 | ZFP90 | P5T-E | Human | Esophagus | ESCC | 1.81e-11 | 1.92e-01 | 0.1327 |
| 146198 | ZFP90 | P8T-E | Human | Esophagus | ESCC | 6.56e-22 | 3.37e-01 | 0.0889 |
| 146198 | ZFP90 | P10T-E | Human | Esophagus | ESCC | 1.70e-13 | 2.72e-01 | 0.116 |
| 146198 | ZFP90 | P11T-E | Human | Esophagus | ESCC | 3.15e-09 | 3.72e-01 | 0.1426 |
| 146198 | ZFP90 | P12T-E | Human | Esophagus | ESCC | 1.24e-22 | 3.85e-01 | 0.1122 |
| 146198 | ZFP90 | P15T-E | Human | Esophagus | ESCC | 1.73e-12 | 2.54e-01 | 0.1149 |
| 146198 | ZFP90 | P16T-E | Human | Esophagus | ESCC | 5.63e-12 | 2.21e-01 | 0.1153 |
| 146198 | ZFP90 | P17T-E | Human | Esophagus | ESCC | 6.11e-03 | 1.60e-01 | 0.1278 |
| 146198 | ZFP90 | P20T-E | Human | Esophagus | ESCC | 3.08e-13 | 2.08e-01 | 0.1124 |
| 146198 | ZFP90 | P21T-E | Human | Esophagus | ESCC | 2.32e-25 | 3.69e-01 | 0.1617 |
| Page: 1 2 3 4 |
| Tissue | Expression Dynamics | Abbreviation |
| Esophagus |  | ESCC: Esophageal squamous cell carcinoma |
| HGIN: High-grade intraepithelial neoplasias | ||
| LGIN: Low-grade intraepithelial neoplasias | ||
| Thyroid | 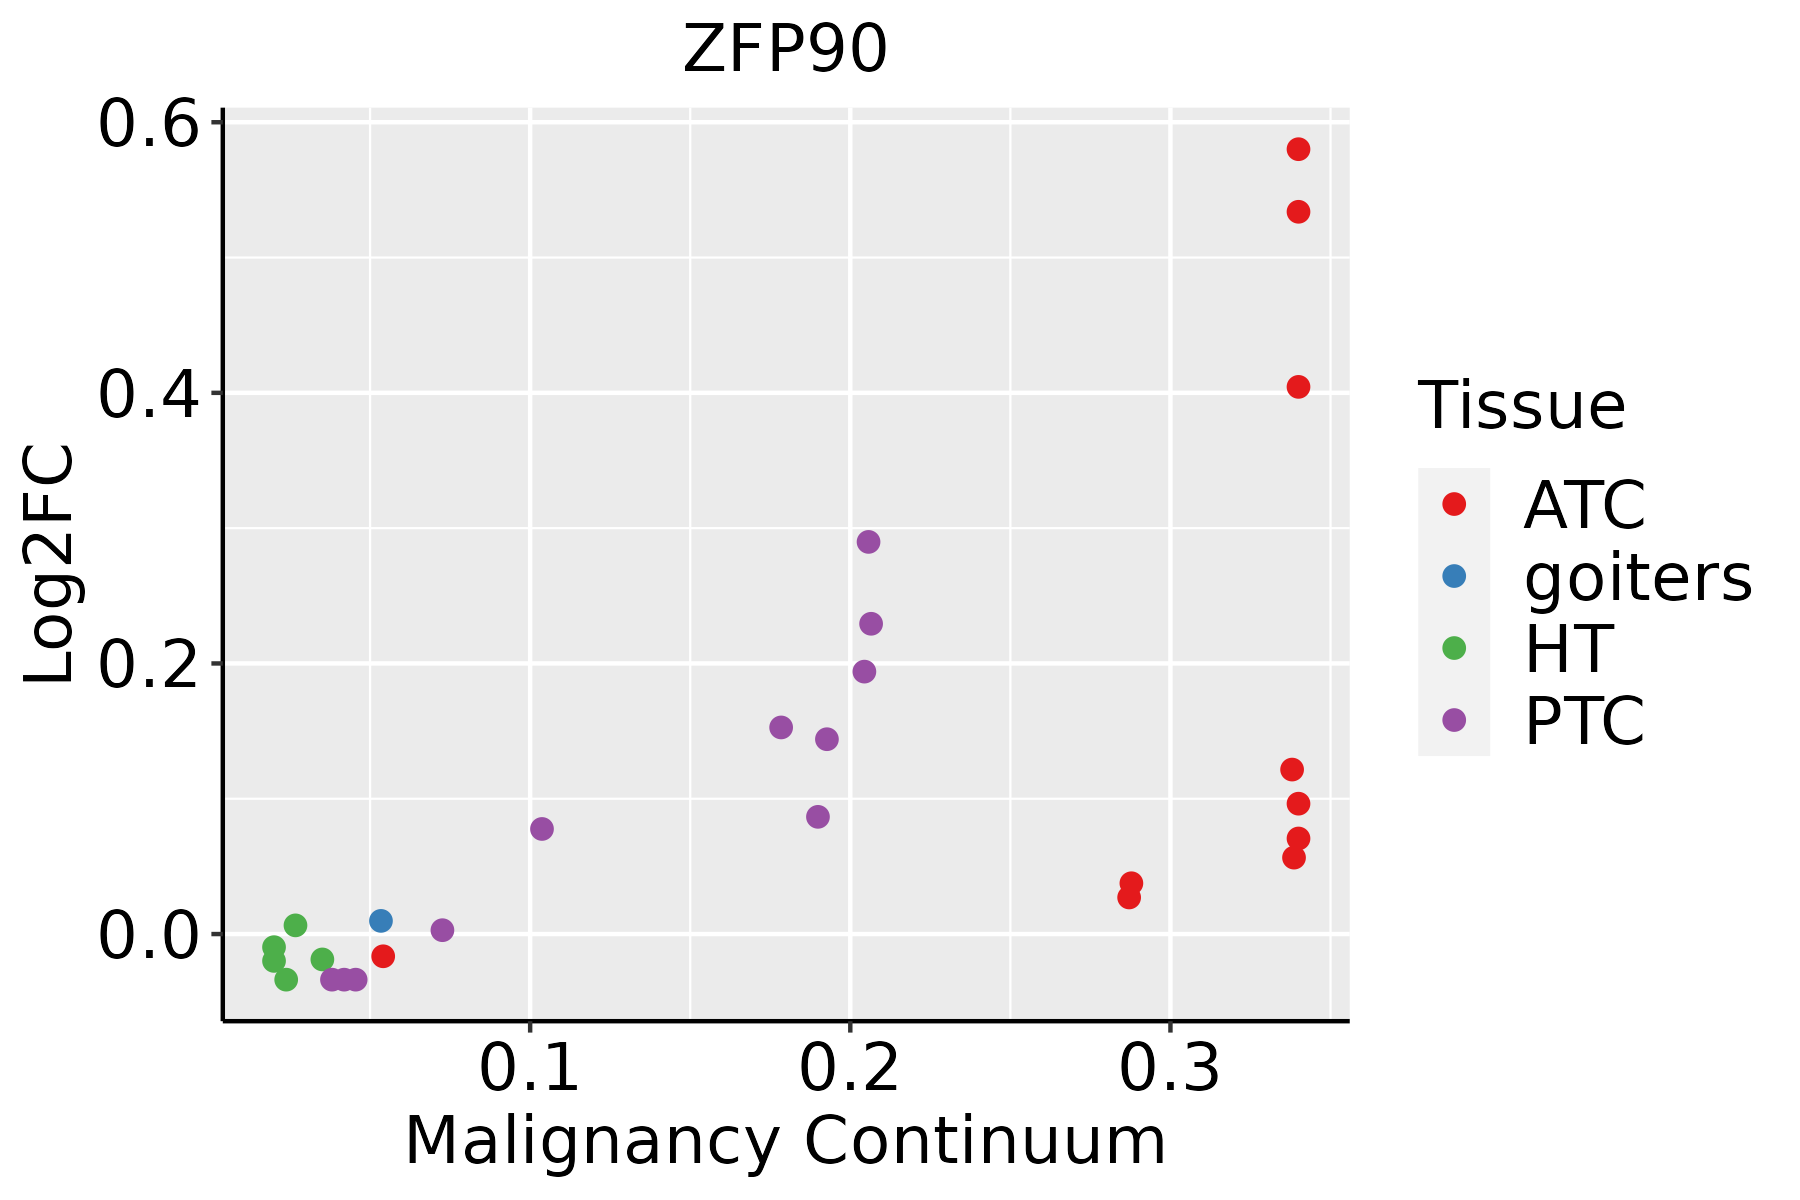 | ATC: Anaplastic thyroid cancer |
| HT: Hashimoto's thyroiditis | ||
| PTC: Papillary thyroid cancer |
| ∗log2FC in expression of this searched gene in stem-like cells from each diseased tissue sample relative to stem-like cells in normal samples in each tissue plotted against the malignancy continuum. Samples are colored based on if they are from different disease stage. |
Top |
Malignant transformation related pathway analysis |
| Find out the enriched GO biological processes and KEGG pathways involved in transition from healthy to precancer to cancer |
| Tissue | Disease Stage | Enriched GO biological Processes |
| Colorectum | AD |  |
| Colorectum | SER |  |
| Colorectum | MSS |  |
| Colorectum | MSI-H |  |
| Colorectum | FAP |  |
| ∗Top 15 enriched GO BP terms are showed in the bar plot of each disease state in each tissue. Each row represents a significant GO biological process which is colored according to the -log10(p.adjust). |
| Page: 1 2 3 4 5 6 7 8 9 |
| GO ID | Tissue | Disease Stage | Description | Gene Ratio | Bg Ratio | pvalue | p.adjust | Count |
| GO:0051098111 | Esophagus | ESCC | regulation of binding | 251/8552 | 363/18723 | 6.73e-20 | 8.46e-18 | 251 |
| GO:0051101111 | Esophagus | ESCC | regulation of DNA binding | 84/8552 | 118/18723 | 1.64e-08 | 3.21e-07 | 84 |
| GO:0051100111 | Esophagus | ESCC | negative regulation of binding | 109/8552 | 162/18723 | 2.10e-08 | 4.03e-07 | 109 |
| GO:00433924 | Esophagus | ESCC | negative regulation of DNA binding | 37/8552 | 52/18723 | 1.75e-04 | 1.14e-03 | 37 |
| GO:0051098113 | Thyroid | PTC | regulation of binding | 195/5968 | 363/18723 | 3.21e-18 | 3.37e-16 | 195 |
| GO:0051101113 | Thyroid | PTC | regulation of DNA binding | 63/5968 | 118/18723 | 1.00e-06 | 1.50e-05 | 63 |
| GO:0051100113 | Thyroid | PTC | negative regulation of binding | 81/5968 | 162/18723 | 1.14e-06 | 1.67e-05 | 81 |
| GO:00433926 | Thyroid | PTC | negative regulation of DNA binding | 29/5968 | 52/18723 | 3.09e-04 | 2.15e-03 | 29 |
| GO:005109834 | Thyroid | ATC | regulation of binding | 203/6293 | 363/18723 | 1.18e-18 | 1.55e-16 | 203 |
| GO:005110027 | Thyroid | ATC | negative regulation of binding | 86/6293 | 162/18723 | 2.41e-07 | 3.73e-06 | 86 |
| GO:005110133 | Thyroid | ATC | regulation of DNA binding | 64/6293 | 118/18723 | 3.10e-06 | 3.54e-05 | 64 |
| GO:004339214 | Thyroid | ATC | negative regulation of DNA binding | 30/6293 | 52/18723 | 3.08e-04 | 1.94e-03 | 30 |
| Page: 1 |
| Pathway ID | Tissue | Disease Stage | Description | Gene Ratio | Bg Ratio | pvalue | p.adjust | qvalue | Count |
| Page: 1 |
Top |
Cell-cell communication analysis |
| Identification of potential cell-cell interactions between two cell types and their ligand-receptor pairs for different disease states |
| Ligand | Receptor | LRpair | Pathway | Tissue | Disease Stage |
| Page: 1 |
Top |
Single-cell gene regulatory network inference analysis |
| Find out the significant the regulons (TFs) and the target genes of each regulon across cell types for different disease states |
| TF | Cell Type | Tissue | Disease Stage | Target Gene | RSS | Regulon Activity |
| ZFP90 | MSC | Stomach | ADJ | MOK,AC026979.2,ZNF212, etc. | 4.73e-02 |  |
| ZFP90 | FIB | Stomach | ADJ | MOK,AC026979.2,ZNF212, etc. | 2.59e-02 | |
| ZFP90 | MVA | Stomach | CAG with IM | MOK,AC026979.2,ZNF212, etc. | 1.12e-01 |  |
| ZFP90 | MSC | Stomach | CSG | MOK,AC026979.2,ZNF212, etc. | 3.95e-02 |  |
| ZFP90 | MSC | Stomach | Healthy | MOK,AC026979.2,ZNF212, etc. | 1.89e-02 |  |
| ZFP90 | LYMEND | Stomach | Healthy | MOK,AC026979.2,ZNF212, etc. | 5.22e-02 | |
| ZFP90 | NKT | Thyroid | ATC | COL1A2,P4HA2,MDK, etc. | 1.68e-01 |  |
| ZFP90 | CD8TEXINT | Thyroid | Healthy | COL1A2,P4HA2,MDK, etc. | 1.66e-02 |  |
| ZFP90 | TFH | Thyroid | HT | COL1A2,P4HA2,MDK, etc. | 1.74e-02 |  |
| ∗The dot plots of a searched regulon are shown for all cell subpopulations in each disease state of each tissue based on the regulon specific score inferred using pySCENIC and by calculating the average expression. |
| Page: 1 |
Top |
Somatic mutation of malignant transformation related genes |
| Annotation of somatic variants for genes involved in malignant transformation |
| Hugo Symbol | Variant Class | Variant Classification | dbSNP RS | HGVSc | HGVSp | HGVSp Short | SWISSPROT | BIOTYPE | SIFT | PolyPhen | Tumor Sample Barcode | Tissue | Histology | Sex | Age | Stage | Therapy Types | Drugs | Outcome |
| ZFP90 | SNV | Missense_Mutation | c.64G>T | p.Asp22Tyr | p.D22Y | Q8TF47 | protein_coding | tolerated(0.16) | benign(0.009) | TCGA-A2-A0ET-01 | Breast | breast invasive carcinoma | Female | <65 | III/IV | Chemotherapy | cytoxan | SD | |
| ZFP90 | insertion | In_Frame_Ins | novel | c.1769_1770insTGGTCAGAG | p.Phe590_Arg591insGlyGlnSer | p.F590_R591insGQS | Q8TF47 | protein_coding | TCGA-A8-A07R-01 | Breast | breast invasive carcinoma | Female | >=65 | III/IV | Ancillary | zoledronic | SD | ||
| ZFP90 | insertion | In_Frame_Ins | novel | c.1019_1020insGAC | p.Cys340delinsTrpThr | p.C340delinsWT | Q8TF47 | protein_coding | TCGA-B6-A0IE-01 | Breast | breast invasive carcinoma | Female | <65 | III/IV | Unknown | Unknown | PD | ||
| ZFP90 | insertion | Nonsense_Mutation | novel | c.1020_1021insAGGCCATGAAGGGCTCTGAAGCTCACACTGAGG | p.Cys340_Asn341insArgProTerArgAlaLeuLysLeuThrLeuArg | p.C340_N341insRP*RALKLTLR | Q8TF47 | protein_coding | TCGA-B6-A0IE-01 | Breast | breast invasive carcinoma | Female | <65 | III/IV | Unknown | Unknown | PD | ||
| ZFP90 | SNV | Missense_Mutation | c.1562G>C | p.Gly521Ala | p.G521A | Q8TF47 | protein_coding | deleterious(0) | probably_damaging(0.999) | TCGA-FU-A3HY-01 | Cervix | cervical & endocervical cancer | Female | <65 | I/II | Chemotherapy | cisplatin | CR | |
| ZFP90 | SNV | Missense_Mutation | c.1636A>G | p.Thr546Ala | p.T546A | Q8TF47 | protein_coding | deleterious(0.04) | benign(0.251) | TCGA-AA-3977-01 | Colorectum | colon adenocarcinoma | Male | >=65 | I/II | Unknown | Unknown | SD | |
| ZFP90 | SNV | Missense_Mutation | c.989G>A | p.Arg330Gln | p.R330Q | Q8TF47 | protein_coding | deleterious(0.01) | probably_damaging(0.999) | TCGA-AA-3984-01 | Colorectum | colon adenocarcinoma | Female | <65 | I/II | Unknown | Unknown | SD | |
| ZFP90 | SNV | Missense_Mutation | c.989N>A | p.Arg330Gln | p.R330Q | Q8TF47 | protein_coding | deleterious(0.01) | probably_damaging(0.999) | TCGA-AA-A00N-01 | Colorectum | colon adenocarcinoma | Male | >=65 | I/II | Unknown | Unknown | PD | |
| ZFP90 | SNV | Missense_Mutation | c.500N>G | p.Asn167Ser | p.N167S | Q8TF47 | protein_coding | tolerated(0.93) | benign(0) | TCGA-AA-A010-01 | Colorectum | colon adenocarcinoma | Female | <65 | I/II | Chemotherapy | folinic | CR | |
| ZFP90 | SNV | Missense_Mutation | c.1643N>A | p.Thr548Asn | p.T548N | Q8TF47 | protein_coding | deleterious(0) | probably_damaging(0.975) | TCGA-AU-6004-01 | Colorectum | colon adenocarcinoma | Female | >=65 | I/II | Unknown | Unknown | SD |
| Page: 1 2 3 4 5 6 7 8 9 |
Top |
Related drugs of malignant transformation related genes |
| Identification of chemicals and drugs interact with genes involved in malignant transfromation |
| (DGIdb 4.0) |
| Entrez ID | Symbol | Category | Interaction Types | Drug Claim Name | Drug Name | PMIDs |
| Page: 1 |

Copyright 2023-Present -The University of Texas Health Science Center at Houston |