
|
|||||
|
 | |
| |
| |
| |
| |
| |
|
Gene: ZFP64 |
Gene summary for ZFP64 |
| Gene information | Species | Human | Gene symbol | ZFP64 | Gene ID | 55734 |
| Gene name | ZFP64 zinc finger protein | |
| Gene Alias | ZNF338 | |
| Cytomap | 20q13.2 | |
| Gene Type | protein-coding | GO ID | GO:0006139 | UniProtAcc | Q9NTW7 |
Top |
Malignant transformation analysis |
| Identification of the aberrant gene expression in precancerous and cancerous lesions by comparing the gene expression of stem-like cells in diseased tissues with normal stem cells |
| Entrez ID | Symbol | Replicates | Species | Organ | Tissue | Adj P-value | Log2FC | Malignancy |
| 55734 | ZFP64 | LZE2T | Human | Esophagus | ESCC | 6.63e-03 | 2.73e-01 | 0.082 |
| 55734 | ZFP64 | LZE4T | Human | Esophagus | ESCC | 2.16e-10 | 2.73e-01 | 0.0811 |
| 55734 | ZFP64 | LZE5T | Human | Esophagus | ESCC | 1.15e-02 | 1.57e-01 | 0.0514 |
| 55734 | ZFP64 | LZE7T | Human | Esophagus | ESCC | 3.14e-13 | 4.41e-01 | 0.0667 |
| 55734 | ZFP64 | LZE8T | Human | Esophagus | ESCC | 1.78e-02 | 6.24e-02 | 0.067 |
| 55734 | ZFP64 | LZE20T | Human | Esophagus | ESCC | 4.41e-07 | 1.18e-01 | 0.0662 |
| 55734 | ZFP64 | LZE24T | Human | Esophagus | ESCC | 2.60e-17 | 3.80e-01 | 0.0596 |
| 55734 | ZFP64 | LZE22D3 | Human | Esophagus | HGIN | 4.80e-02 | 3.27e-01 | 0.0653 |
| 55734 | ZFP64 | LZE21T | Human | Esophagus | ESCC | 1.59e-05 | 3.30e-01 | 0.0655 |
| 55734 | ZFP64 | P1T-E | Human | Esophagus | ESCC | 9.57e-14 | 4.28e-01 | 0.0875 |
| 55734 | ZFP64 | P2T-E | Human | Esophagus | ESCC | 1.02e-24 | 4.60e-01 | 0.1177 |
| 55734 | ZFP64 | P4T-E | Human | Esophagus | ESCC | 2.36e-51 | 1.08e+00 | 0.1323 |
| 55734 | ZFP64 | P5T-E | Human | Esophagus | ESCC | 6.87e-15 | 2.87e-01 | 0.1327 |
| 55734 | ZFP64 | P8T-E | Human | Esophagus | ESCC | 2.90e-24 | 3.41e-01 | 0.0889 |
| 55734 | ZFP64 | P9T-E | Human | Esophagus | ESCC | 1.70e-20 | 4.81e-01 | 0.1131 |
| 55734 | ZFP64 | P10T-E | Human | Esophagus | ESCC | 8.51e-48 | 7.70e-01 | 0.116 |
| 55734 | ZFP64 | P11T-E | Human | Esophagus | ESCC | 9.72e-20 | 5.38e-01 | 0.1426 |
| 55734 | ZFP64 | P12T-E | Human | Esophagus | ESCC | 1.18e-44 | 9.09e-01 | 0.1122 |
| 55734 | ZFP64 | P15T-E | Human | Esophagus | ESCC | 6.80e-38 | 7.84e-01 | 0.1149 |
| 55734 | ZFP64 | P16T-E | Human | Esophagus | ESCC | 9.87e-25 | 5.66e-01 | 0.1153 |
| Page: 1 2 3 4 5 |
| Tissue | Expression Dynamics | Abbreviation |
| Esophagus | 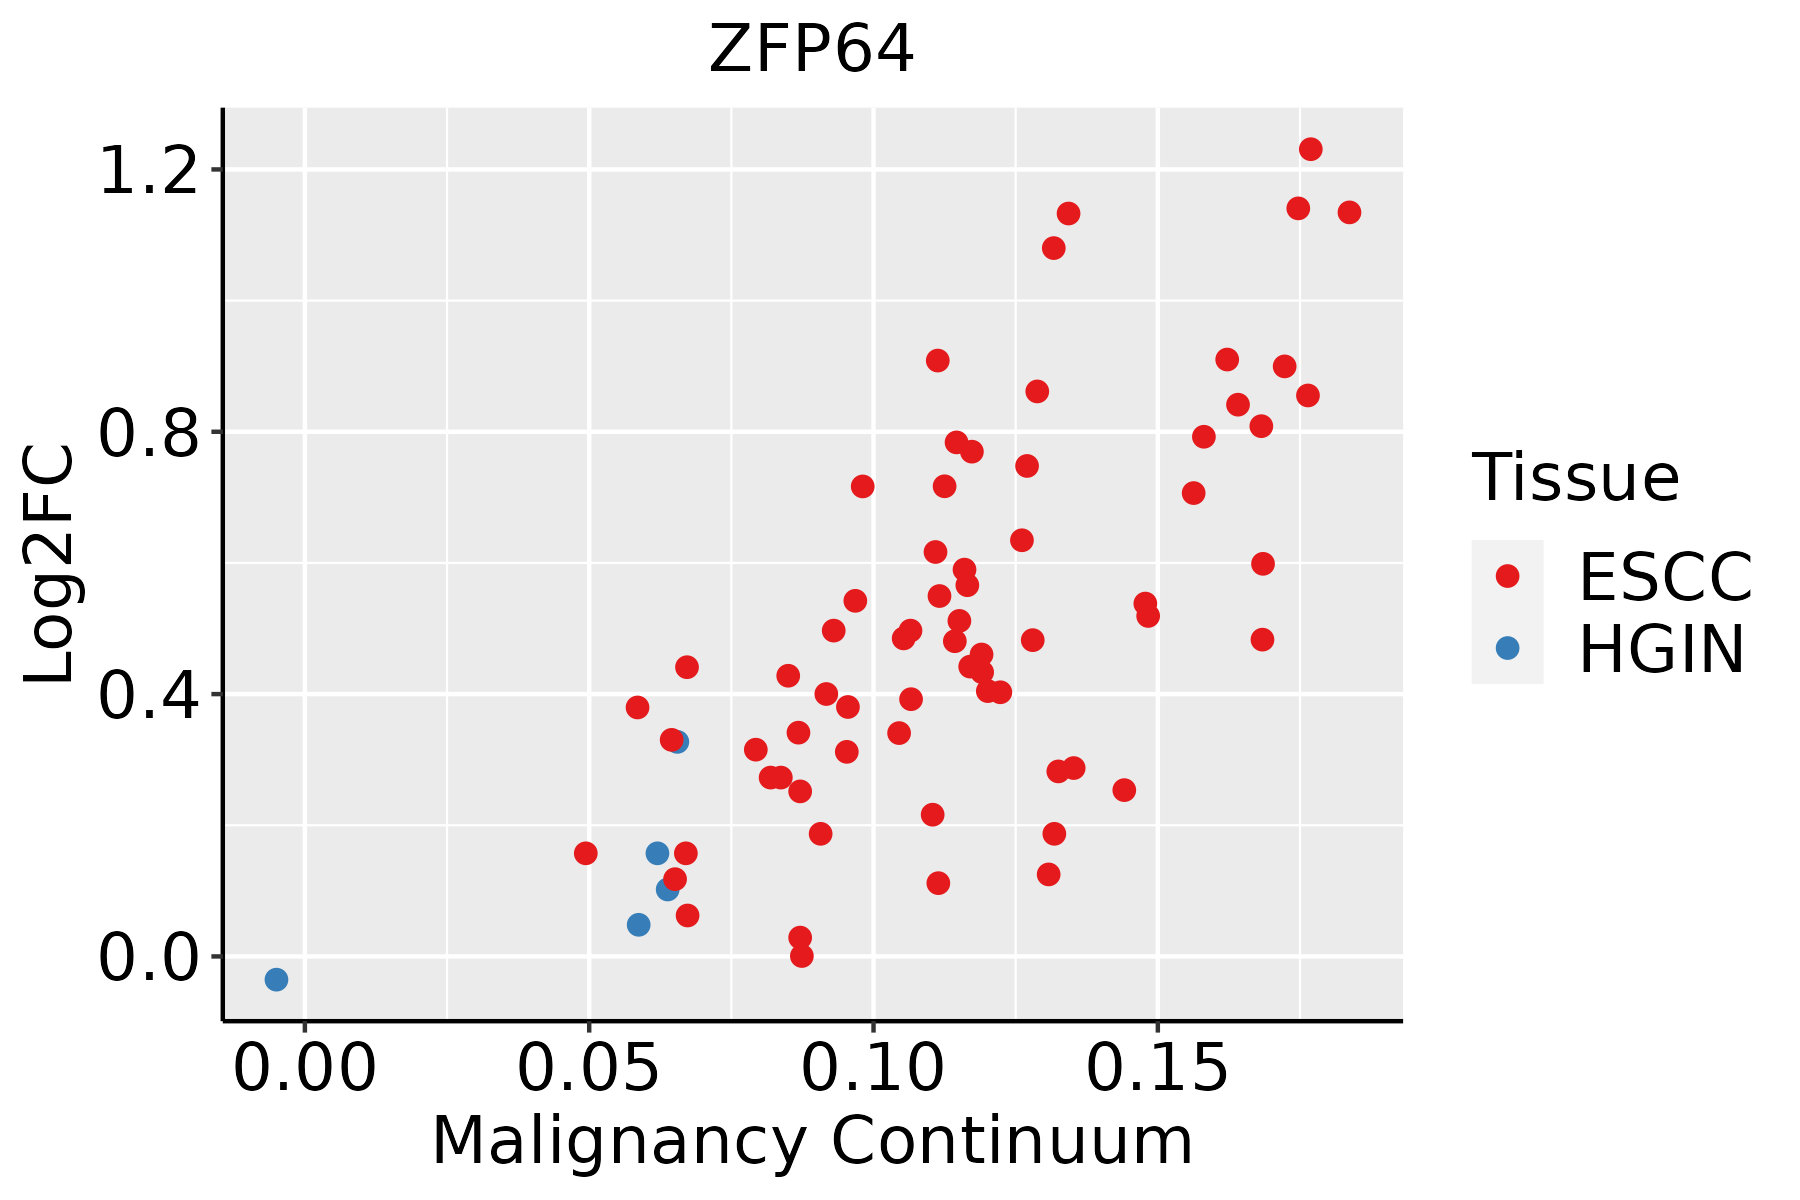 | ESCC: Esophageal squamous cell carcinoma |
| HGIN: High-grade intraepithelial neoplasias | ||
| LGIN: Low-grade intraepithelial neoplasias | ||
| Liver | 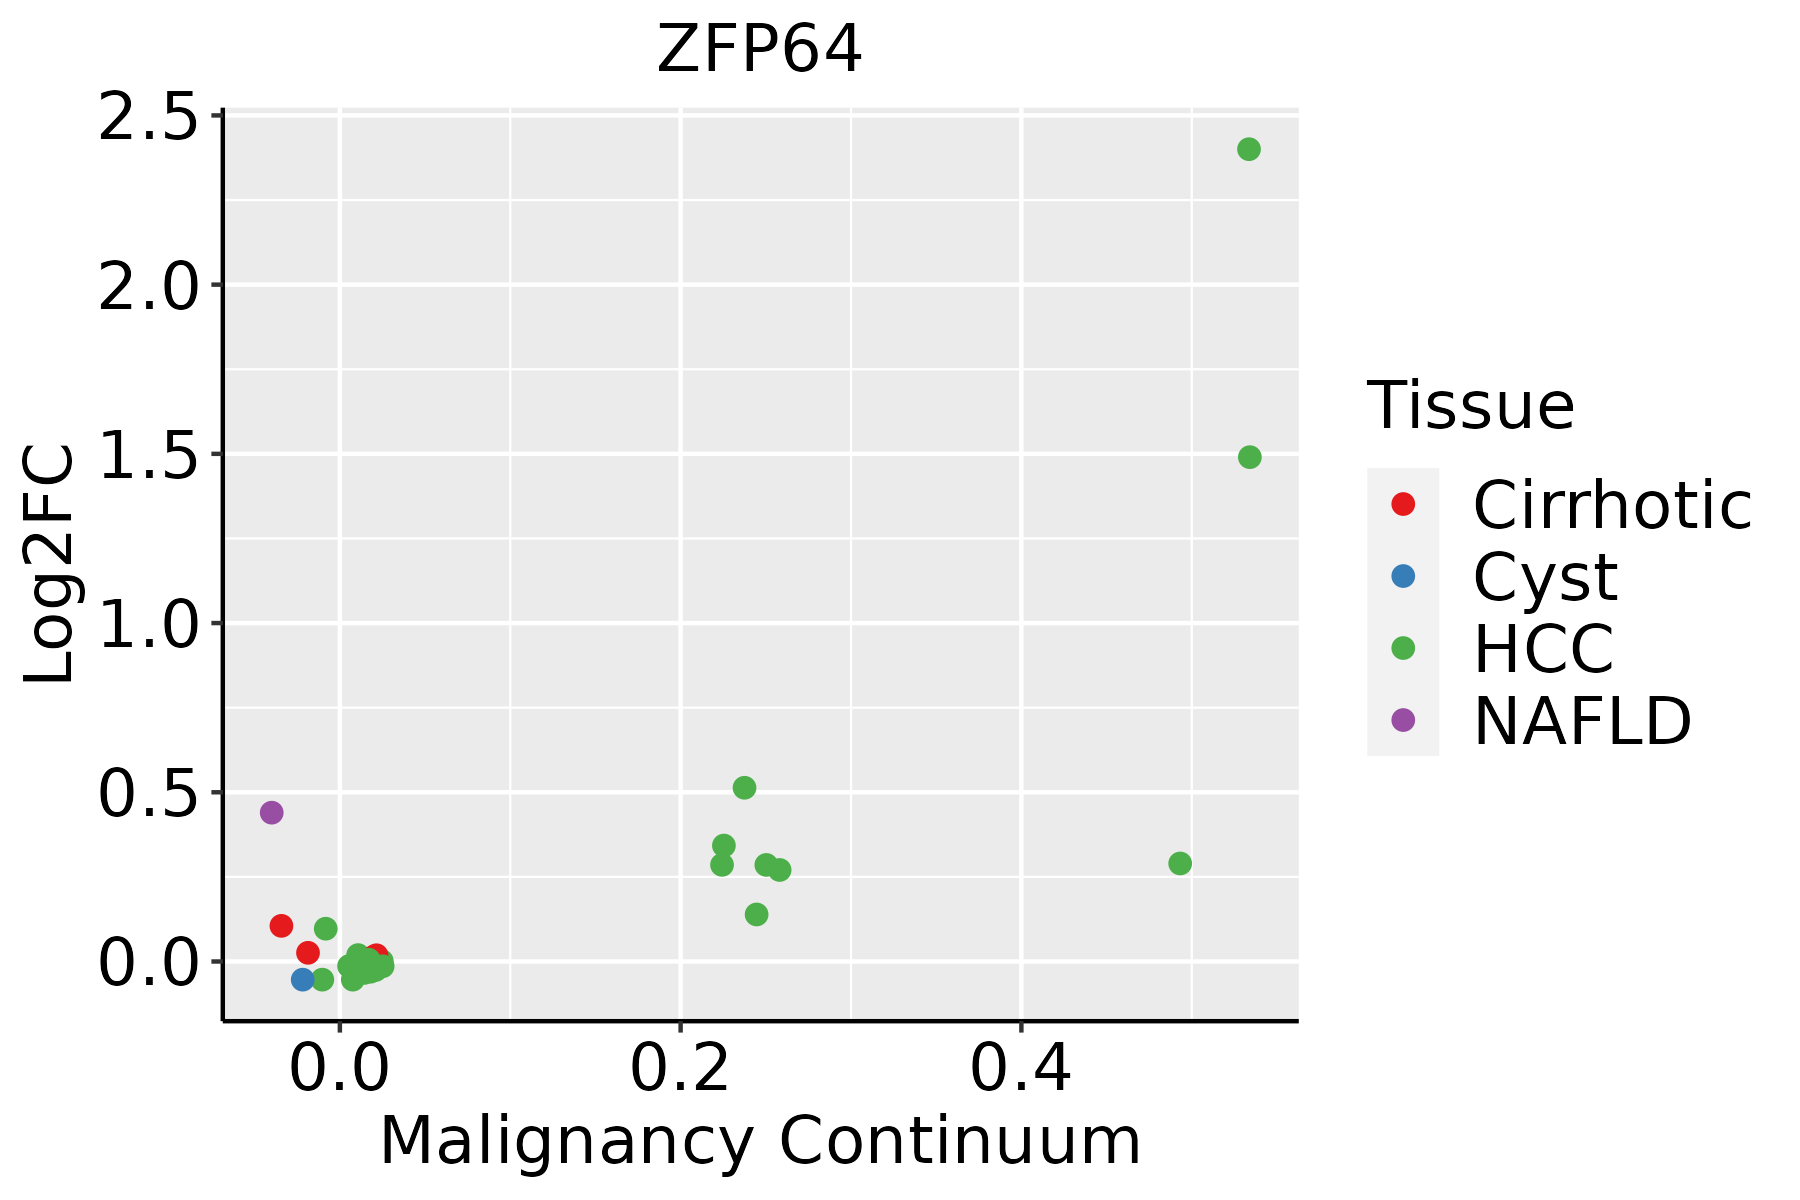 | HCC: Hepatocellular carcinoma |
| NAFLD: Non-alcoholic fatty liver disease | ||
| Oral Cavity | 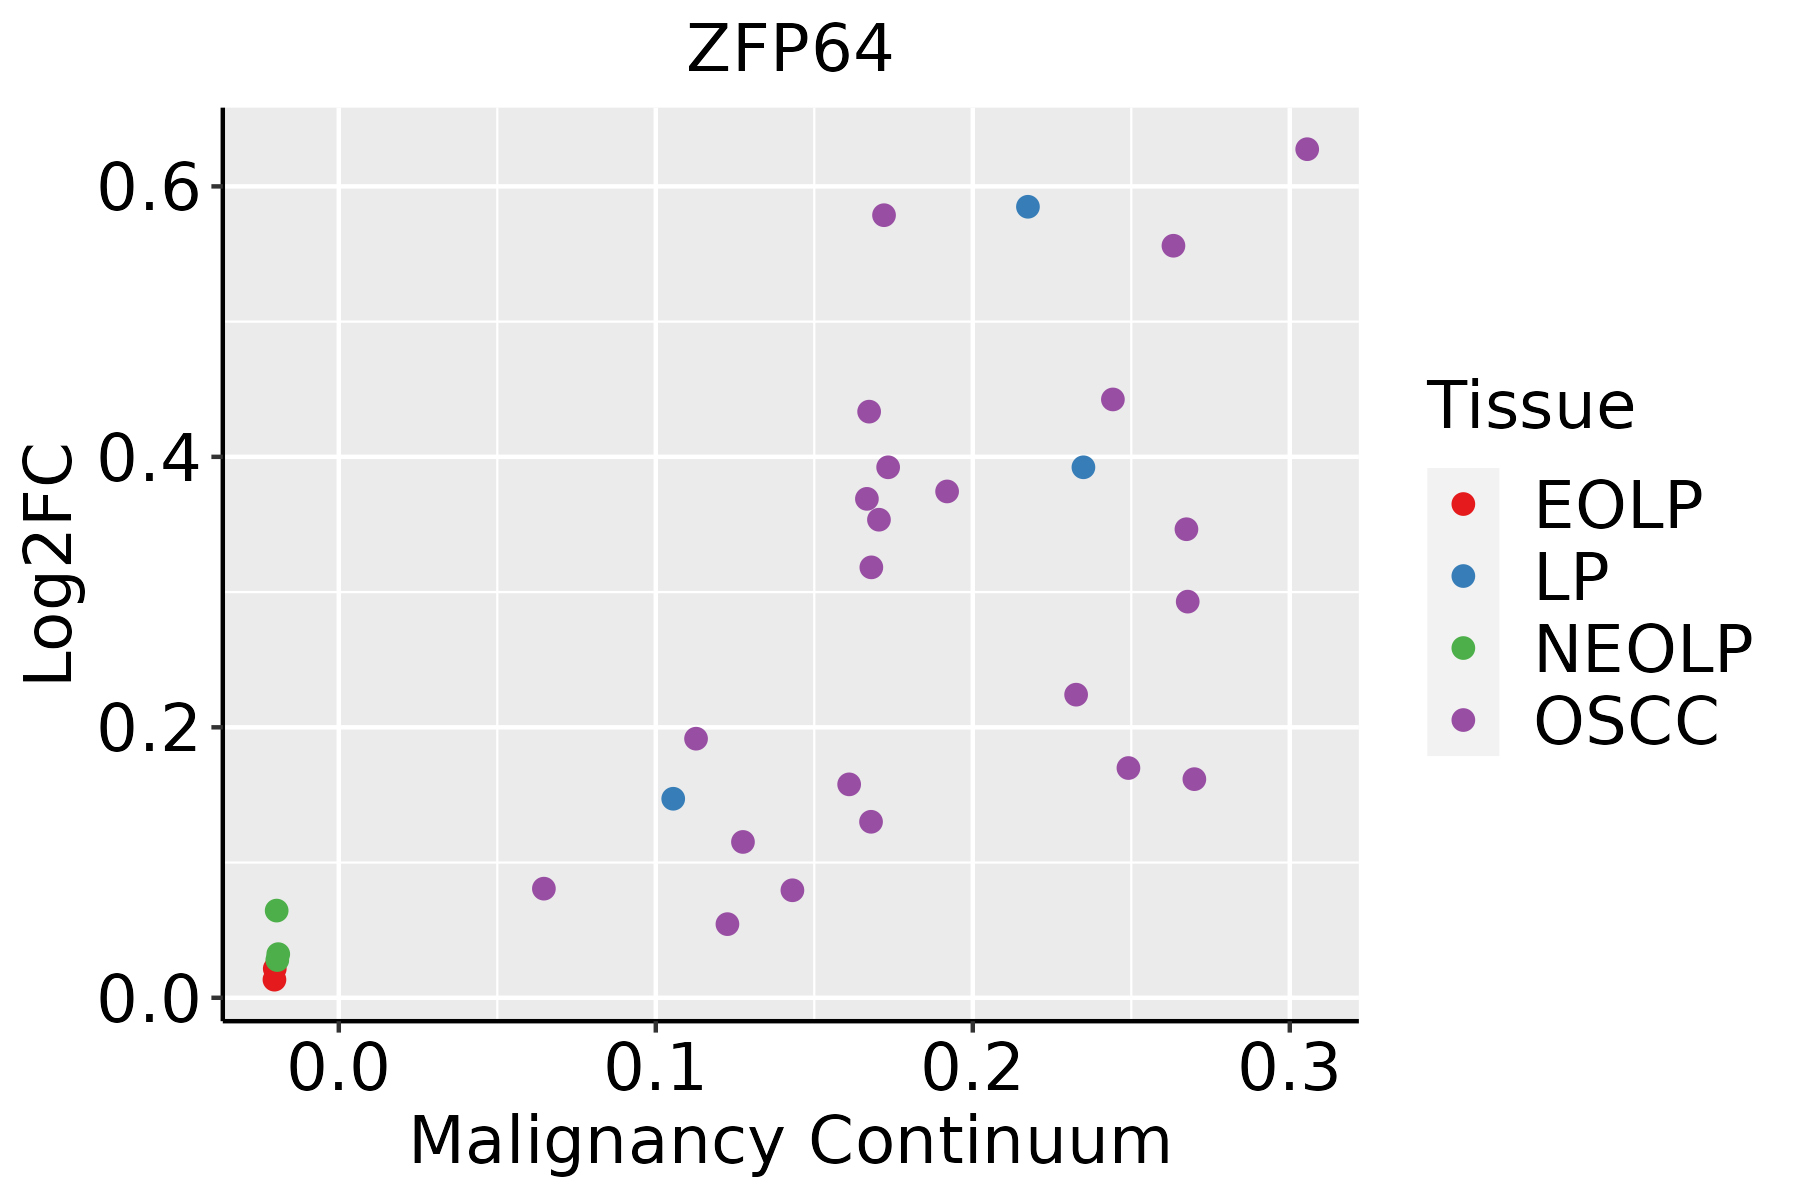 | EOLP: Erosive Oral lichen planus |
| LP: leukoplakia | ||
| NEOLP: Non-erosive oral lichen planus | ||
| OSCC: Oral squamous cell carcinoma |
| ∗log2FC in expression of this searched gene in stem-like cells from each diseased tissue sample relative to stem-like cells in normal samples in each tissue plotted against the malignancy continuum. Samples are colored based on if they are from different disease stage. |
Top |
Malignant transformation related pathway analysis |
| Find out the enriched GO biological processes and KEGG pathways involved in transition from healthy to precancer to cancer |
| Tissue | Disease Stage | Enriched GO biological Processes |
| Colorectum | AD |  |
| Colorectum | SER |  |
| Colorectum | MSS |  |
| Colorectum | MSI-H |  |
| Colorectum | FAP |  |
| ∗Top 15 enriched GO BP terms are showed in the bar plot of each disease state in each tissue. Each row represents a significant GO biological process which is colored according to the -log10(p.adjust). |
| Page: 1 2 3 4 5 6 7 8 9 |
| GO ID | Tissue | Disease Stage | Description | Gene Ratio | Bg Ratio | pvalue | p.adjust | Count |
| Page: 1 |
| Pathway ID | Tissue | Disease Stage | Description | Gene Ratio | Bg Ratio | pvalue | p.adjust | qvalue | Count |
| Page: 1 |
Top |
Cell-cell communication analysis |
| Identification of potential cell-cell interactions between two cell types and their ligand-receptor pairs for different disease states |
| Ligand | Receptor | LRpair | Pathway | Tissue | Disease Stage |
| Page: 1 |
Top |
Single-cell gene regulatory network inference analysis |
| Find out the significant the regulons (TFs) and the target genes of each regulon across cell types for different disease states |
| TF | Cell Type | Tissue | Disease Stage | Target Gene | RSS | Regulon Activity |
| ZFP64 | MYOEPI | Breast | DCIS | LY6D,DGCR6,COPZ2, etc. | 1.50e-01 |  |
| ZFP64 | MYOEPI | Breast | IDC | LY6D,DGCR6,COPZ2, etc. | 1.89e-01 |  |
| ZFP64 | STM | Breast | Precancer | LY6D,DGCR6,COPZ2, etc. | 1.52e-01 |  |
| ZFP64 | SMC | Breast | Precancer | COL27A1,PDP2,SRSF8, etc. | 1.11e-01 | |
| ZFP64 | TFH | Cervix | ADJ | LY6K,ZNF512B,RHOBTB1, etc. | 2.83e-02 |  |
| ZFP64 | CD8TEXP | Cervix | ADJ | LY6K,ZNF512B,RHOBTB1, etc. | 2.04e-02 | |
| ZFP64 | CD8TEREX | Cervix | ADJ | LY6K,ZNF512B,RHOBTB1, etc. | 4.44e-16 | |
| ZFP64 | NK | Cervix | ADJ | LY6K,ZNF512B,RHOBTB1, etc. | 4.44e-16 | |
| ZFP64 | GC | Cervix | ADJ | LY6K,ZNF512B,RHOBTB1, etc. | 2.22e-16 | |
| ZFP64 | PLA | Cervix | ADJ | LY6K,ZNF512B,RHOBTB1, etc. | 0.00e+00 | |
| ∗The dot plots of a searched regulon are shown for all cell subpopulations in each disease state of each tissue based on the regulon specific score inferred using pySCENIC and by calculating the average expression. |
| Page: 1 2 3 4 |
Top |
Somatic mutation of malignant transformation related genes |
| Annotation of somatic variants for genes involved in malignant transformation |
| Hugo Symbol | Variant Class | Variant Classification | dbSNP RS | HGVSc | HGVSp | HGVSp Short | SWISSPROT | BIOTYPE | SIFT | PolyPhen | Tumor Sample Barcode | Tissue | Histology | Sex | Age | Stage | Therapy Types | Drugs | Outcome |
| ZFP64 | SNV | Missense_Mutation | c.1532N>A | p.Arg511His | p.R511H | Q9NTW7 | protein_coding | tolerated(0.06) | probably_damaging(0.996) | TCGA-A2-A0YE-01 | Breast | breast invasive carcinoma | Female | <65 | I/II | Unspecific | Taxotere | SD | |
| ZFP64 | SNV | Missense_Mutation | c.1362G>C | p.Lys454Asn | p.K454N | Q9NPA5 | protein_coding | tolerated(0.1) | benign(0.001) | TCGA-A7-A0CJ-01 | Breast | breast invasive carcinoma | Female | <65 | I/II | Chemotherapy | cytoxan | SD | |
| ZFP64 | SNV | Missense_Mutation | c.1949C>A | p.Ser650Tyr | p.S650Y | Q9NPA5 | protein_coding | deleterious_low_confidence(0.03) | benign(0.055) | TCGA-AN-A0FW-01 | Breast | breast invasive carcinoma | Female | >=65 | III/IV | Unknown | Unknown | SD | |
| ZFP64 | SNV | Missense_Mutation | novel | c.1082N>C | p.His361Pro | p.H361P | Q9NPA5 | protein_coding | deleterious(0) | probably_damaging(0.993) | TCGA-AR-A24H-01 | Breast | breast invasive carcinoma | Female | >=65 | I/II | Hormone Therapy | tamoxiphen | SD |
| ZFP64 | SNV | Missense_Mutation | c.1291N>T | p.Asp431Tyr | p.D431Y | Q9NPA5 | protein_coding | deleterious(0) | probably_damaging(0.963) | TCGA-B6-A0I9-01 | Breast | breast invasive carcinoma | Female | <65 | III/IV | Unknown | Unknown | PD | |
| ZFP64 | SNV | Missense_Mutation | c.640N>A | p.Asp214Asn | p.D214N | Q9NPA5 | protein_coding | deleterious(0) | possibly_damaging(0.719) | TCGA-BH-A0HF-01 | Breast | breast invasive carcinoma | Female | >=65 | I/II | Hormone Therapy | arimidex | SD | |
| ZFP64 | SNV | Missense_Mutation | novel | c.1611N>A | p.Ser537Arg | p.S537R | Q9NTW7 | protein_coding | deleterious(0.02) | probably_damaging(0.974) | TCGA-BH-A0HO-01 | Breast | breast invasive carcinoma | Female | <65 | I/II | Chemotherapy | cyclophosphamide | SD |
| ZFP64 | SNV | Missense_Mutation | c.1448C>G | p.Pro483Arg | p.P483R | Q9NPA5 | protein_coding | deleterious(0) | probably_damaging(0.98) | TCGA-C8-A274-01 | Breast | breast invasive carcinoma | Female | <65 | I/II | Hormone Therapy | tamoxiphen | SD | |
| ZFP64 | SNV | Missense_Mutation | novel | c.1797N>C | p.Lys599Asn | p.K599N | Q9NTW7 | protein_coding | tolerated(0.11) | benign(0.351) | TCGA-EW-A3U0-01 | Breast | breast invasive carcinoma | Female | <65 | III/IV | Chemotherapy | cisplatin | CR |
| ZFP64 | SNV | Missense_Mutation | novel | c.1808T>C | p.Phe603Ser | p.F603S | Q9NPA5 | protein_coding | deleterious(0) | probably_damaging(0.996) | TCGA-LD-A74U-01 | Breast | breast invasive carcinoma | Female | >=65 | III/IV | Chemotherapy | taxotere | SD |
| Page: 1 2 3 4 5 6 7 8 9 10 11 12 13 14 15 |
Top |
Related drugs of malignant transformation related genes |
| Identification of chemicals and drugs interact with genes involved in malignant transfromation |
| (DGIdb 4.0) |
| Entrez ID | Symbol | Category | Interaction Types | Drug Claim Name | Drug Name | PMIDs |
| Page: 1 |

Copyright 2023-Present -The University of Texas Health Science Center at Houston |