
|
|||||
|
 | |
| |
| |
| |
| |
| |
|
Gene: ZFP62 |
Gene summary for ZFP62 |
| Gene information | Species | Human | Gene symbol | ZFP62 | Gene ID | 643836 |
| Gene name | ZFP62 zinc finger protein | |
| Gene Alias | ZET | |
| Cytomap | 5q35.3 | |
| Gene Type | protein-coding | GO ID | GO:0006139 | UniProtAcc | Q8NB50 |
Top |
Malignant transformation analysis |
| Identification of the aberrant gene expression in precancerous and cancerous lesions by comparing the gene expression of stem-like cells in diseased tissues with normal stem cells |
| Entrez ID | Symbol | Replicates | Species | Organ | Tissue | Adj P-value | Log2FC | Malignancy |
| 643836 | ZFP62 | HCC1_Meng | Human | Liver | HCC | 1.12e-14 | -6.24e-03 | 0.0246 |
| 643836 | ZFP62 | HCC2_Meng | Human | Liver | HCC | 1.25e-08 | 7.45e-02 | 0.0107 |
| 643836 | ZFP62 | HCC1 | Human | Liver | HCC | 4.53e-05 | 3.20e+00 | 0.5336 |
| 643836 | ZFP62 | HCC2 | Human | Liver | HCC | 7.35e-03 | 2.57e+00 | 0.5341 |
| Page: 1 |
| Tissue | Expression Dynamics | Abbreviation |
| Liver | 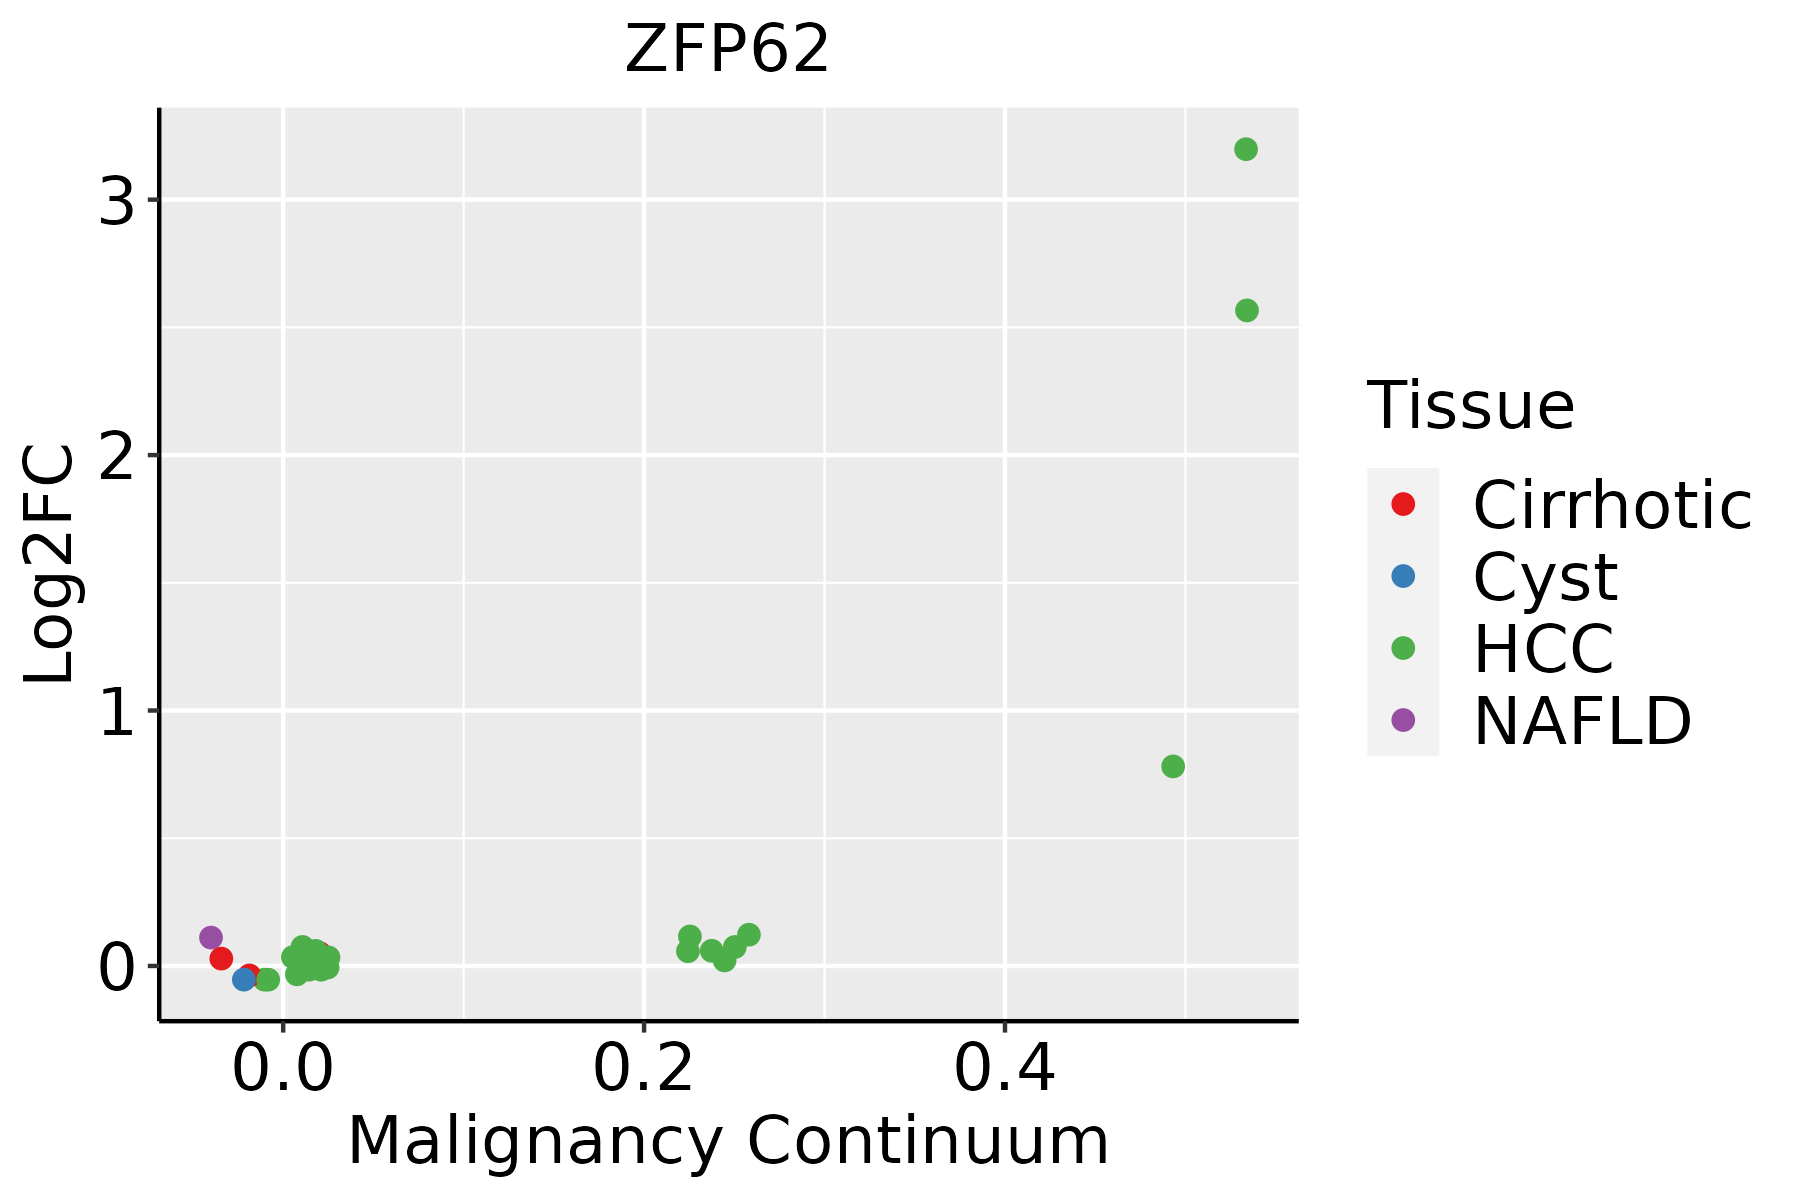 | HCC: Hepatocellular carcinoma |
| NAFLD: Non-alcoholic fatty liver disease |
| ∗log2FC in expression of this searched gene in stem-like cells from each diseased tissue sample relative to stem-like cells in normal samples in each tissue plotted against the malignancy continuum. Samples are colored based on if they are from different disease stage. |
Top |
Malignant transformation related pathway analysis |
| Find out the enriched GO biological processes and KEGG pathways involved in transition from healthy to precancer to cancer |
| Tissue | Disease Stage | Enriched GO biological Processes |
| Colorectum | AD |  |
| Colorectum | SER |  |
| Colorectum | MSS |  |
| Colorectum | MSI-H |  |
| Colorectum | FAP |  |
| ∗Top 15 enriched GO BP terms are showed in the bar plot of each disease state in each tissue. Each row represents a significant GO biological process which is colored according to the -log10(p.adjust). |
| Page: 1 2 3 4 5 6 7 8 9 |
| GO ID | Tissue | Disease Stage | Description | Gene Ratio | Bg Ratio | pvalue | p.adjust | Count |
| Page: 1 |
| Pathway ID | Tissue | Disease Stage | Description | Gene Ratio | Bg Ratio | pvalue | p.adjust | qvalue | Count |
| Page: 1 |
Top |
Cell-cell communication analysis |
| Identification of potential cell-cell interactions between two cell types and their ligand-receptor pairs for different disease states |
| Ligand | Receptor | LRpair | Pathway | Tissue | Disease Stage |
| Page: 1 |
Top |
Single-cell gene regulatory network inference analysis |
| Find out the significant the regulons (TFs) and the target genes of each regulon across cell types for different disease states |
| TF | Cell Type | Tissue | Disease Stage | Target Gene | RSS | Regulon Activity |
| ZFP62 | INMON | Breast | ADJ | FANCB,EI24,LINC01281, etc. | 6.07e-02 |  |
| ZFP62 | CD8TRM | Breast | DCIS | FANCB,EI24,LINC01281, etc. | 1.40e-02 |  |
| ZFP62 | GDT | Cervix | ADJ | BRD3OS,MAMLD1,RNF146, etc. | 5.47e-02 |  |
| ZFP62 | CD8TEXINT | Cervix | ADJ | BRD3OS,MAMLD1,RNF146, etc. | 3.19e-02 | |
| ZFP62 | GDT | Cervix | CC | BRD3OS,MAMLD1,RNF146, etc. | 1.37e-01 |  |
| ZFP62 | CD8TEXINT | Cervix | CC | BRD3OS,MAMLD1,RNF146, etc. | 1.38e-01 | |
| ZFP62 | TREG | Cervix | HSIL_HPV | BRD3OS,MAMLD1,RNF146, etc. | 7.06e-02 |  |
| ZFP62 | CD8TEXINT | Cervix | HSIL_HPV | BRD3OS,MAMLD1,RNF146, etc. | 1.17e-01 | |
| ZFP62 | CD8TEREX | Cervix | HSIL_HPV | BRD3OS,MAMLD1,RNF146, etc. | 3.22e-02 | |
| ZFP62 | CD8TEXP | Cervix | N_HPV | BRD3OS,MAMLD1,RNF146, etc. | 2.93e-02 |  |
| ∗The dot plots of a searched regulon are shown for all cell subpopulations in each disease state of each tissue based on the regulon specific score inferred using pySCENIC and by calculating the average expression. |
| Page: 1 2 3 |
Top |
Somatic mutation of malignant transformation related genes |
| Annotation of somatic variants for genes involved in malignant transformation |
| Hugo Symbol | Variant Class | Variant Classification | dbSNP RS | HGVSc | HGVSp | HGVSp Short | SWISSPROT | BIOTYPE | SIFT | PolyPhen | Tumor Sample Barcode | Tissue | Histology | Sex | Age | Stage | Therapy Types | Drugs | Outcome |
| ZFP62 | SNV | Missense_Mutation | c.1264N>A | p.Glu422Lys | p.E422K | Q8NB50 | protein_coding | tolerated(0.87) | benign(0.069) | TCGA-AC-A23H-01 | Breast | breast invasive carcinoma | Female | >=65 | I/II | Unknown | Unknown | PD | |
| ZFP62 | SNV | Missense_Mutation | c.890N>C | p.Arg297Thr | p.R297T | Q8NB50 | protein_coding | tolerated(0.93) | possibly_damaging(0.55) | TCGA-AC-A23H-01 | Breast | breast invasive carcinoma | Female | >=65 | I/II | Unknown | Unknown | PD | |
| ZFP62 | SNV | Missense_Mutation | c.1086G>T | p.Glu362Asp | p.E362D | Q8NB50 | protein_coding | tolerated(0.07) | probably_damaging(0.989) | TCGA-AN-A0AK-01 | Breast | breast invasive carcinoma | Female | >=65 | I/II | Unknown | Unknown | SD | |
| ZFP62 | SNV | Missense_Mutation | novel | c.183N>T | p.Met61Ile | p.M61I | Q8NB50 | protein_coding | tolerated(0.43) | benign(0.003) | TCGA-AO-A128-01 | Breast | breast invasive carcinoma | Female | <65 | I/II | Chemotherapy | doxorubicin | SD |
| ZFP62 | SNV | Missense_Mutation | novel | c.2141N>C | p.Arg714Thr | p.R714T | Q8NB50 | protein_coding | deleterious(0.04) | benign(0.155) | TCGA-BH-A0B6-01 | Breast | breast invasive carcinoma | Female | <65 | I/II | Unknown | Unknown | SD |
| ZFP62 | SNV | Missense_Mutation | novel | c.208N>A | p.Glu70Lys | p.E70K | Q8NB50 | protein_coding | tolerated(0.36) | benign(0.14) | TCGA-BH-A0W7-01 | Breast | breast invasive carcinoma | Female | <65 | I/II | Chemotherapy | taxotere | CR |
| ZFP62 | SNV | Missense_Mutation | c.1621N>A | p.Ala541Thr | p.A541T | Q8NB50 | protein_coding | tolerated(0.23) | benign(0.145) | TCGA-BH-A0WA-01 | Breast | breast invasive carcinoma | Female | >=65 | I/II | Unknown | Unknown | SD | |
| ZFP62 | SNV | Missense_Mutation | rs149065023 | c.2522N>A | p.Arg841Gln | p.R841Q | Q8NB50 | protein_coding | tolerated(0.15) | benign(0) | TCGA-GI-A2C9-01 | Breast | breast invasive carcinoma | Female | <65 | I/II | Unspecific | SD | |
| ZFP62 | insertion | In_Frame_Ins | novel | c.183_184insCAT | p.Met61_Lys62insHis | p.M61_K62insH | Q8NB50 | protein_coding | TCGA-AO-A128-01 | Breast | breast invasive carcinoma | Female | <65 | I/II | Chemotherapy | doxorubicin | SD | ||
| ZFP62 | SNV | Missense_Mutation | c.659N>A | p.Ser220Tyr | p.S220Y | Q8NB50 | protein_coding | deleterious(0) | probably_damaging(0.944) | TCGA-EK-A2PI-01 | Cervix | cervical & endocervical cancer | Female | <65 | III/IV | Unknown | Unknown | SD |
| Page: 1 2 3 4 5 6 |
Top |
Related drugs of malignant transformation related genes |
| Identification of chemicals and drugs interact with genes involved in malignant transfromation |
| (DGIdb 4.0) |
| Entrez ID | Symbol | Category | Interaction Types | Drug Claim Name | Drug Name | PMIDs |
| Page: 1 |

Copyright 2023-Present -The University of Texas Health Science Center at Houston |