
|
|||||
|
 | |
| |
| |
| |
| |
| |
|
Gene: ZFHX4 |
Gene summary for ZFHX4 |
| Gene information | Species | Human | Gene symbol | ZFHX4 | Gene ID | 79776 |
| Gene name | zinc finger homeobox 4 | |
| Gene Alias | ZFH4 | |
| Cytomap | 8q21.13 | |
| Gene Type | protein-coding | GO ID | GO:0006139 | UniProtAcc | Q86UP3 |
Top |
Malignant transformation analysis |
| Identification of the aberrant gene expression in precancerous and cancerous lesions by comparing the gene expression of stem-like cells in diseased tissues with normal stem cells |
| Entrez ID | Symbol | Replicates | Species | Organ | Tissue | Adj P-value | Log2FC | Malignancy |
| 79776 | ZFHX4 | P1T-E | Human | Esophagus | ESCC | 5.20e-08 | 3.43e-01 | 0.0875 |
| 79776 | ZFHX4 | P5T-E | Human | Esophagus | ESCC | 3.76e-04 | 9.90e-02 | 0.1327 |
| 79776 | ZFHX4 | P9T-E | Human | Esophagus | ESCC | 5.23e-05 | 1.38e-01 | 0.1131 |
| 79776 | ZFHX4 | P10T-E | Human | Esophagus | ESCC | 3.29e-21 | 4.45e-01 | 0.116 |
| 79776 | ZFHX4 | P11T-E | Human | Esophagus | ESCC | 3.25e-05 | 2.03e-01 | 0.1426 |
| 79776 | ZFHX4 | P15T-E | Human | Esophagus | ESCC | 8.45e-04 | 1.24e-01 | 0.1149 |
| 79776 | ZFHX4 | P16T-E | Human | Esophagus | ESCC | 2.22e-05 | 8.99e-02 | 0.1153 |
| 79776 | ZFHX4 | P23T-E | Human | Esophagus | ESCC | 6.91e-16 | 4.27e-01 | 0.108 |
| 79776 | ZFHX4 | P24T-E | Human | Esophagus | ESCC | 8.72e-07 | 1.08e-01 | 0.1287 |
| 79776 | ZFHX4 | P26T-E | Human | Esophagus | ESCC | 1.63e-05 | 1.11e-01 | 0.1276 |
| 79776 | ZFHX4 | P27T-E | Human | Esophagus | ESCC | 8.49e-09 | 2.07e-01 | 0.1055 |
| 79776 | ZFHX4 | P30T-E | Human | Esophagus | ESCC | 2.31e-10 | 3.75e-01 | 0.137 |
| 79776 | ZFHX4 | P36T-E | Human | Esophagus | ESCC | 4.17e-05 | 2.13e-01 | 0.1187 |
| 79776 | ZFHX4 | P37T-E | Human | Esophagus | ESCC | 3.53e-03 | 1.09e-01 | 0.1371 |
| 79776 | ZFHX4 | P42T-E | Human | Esophagus | ESCC | 1.02e-24 | 6.57e-01 | 0.1175 |
| 79776 | ZFHX4 | P47T-E | Human | Esophagus | ESCC | 1.94e-02 | 6.53e-02 | 0.1067 |
| 79776 | ZFHX4 | P49T-E | Human | Esophagus | ESCC | 3.75e-07 | 6.69e-01 | 0.1768 |
| 79776 | ZFHX4 | P62T-E | Human | Esophagus | ESCC | 1.57e-81 | 1.32e+00 | 0.1302 |
| 79776 | ZFHX4 | P74T-E | Human | Esophagus | ESCC | 2.69e-24 | 5.65e-01 | 0.1479 |
| 79776 | ZFHX4 | P75T-E | Human | Esophagus | ESCC | 2.25e-19 | 3.95e-01 | 0.1125 |
| Page: 1 2 3 |
| Tissue | Expression Dynamics | Abbreviation |
| Esophagus |  | ESCC: Esophageal squamous cell carcinoma |
| HGIN: High-grade intraepithelial neoplasias | ||
| LGIN: Low-grade intraepithelial neoplasias | ||
| Liver |  | HCC: Hepatocellular carcinoma |
| NAFLD: Non-alcoholic fatty liver disease | ||
| Thyroid | 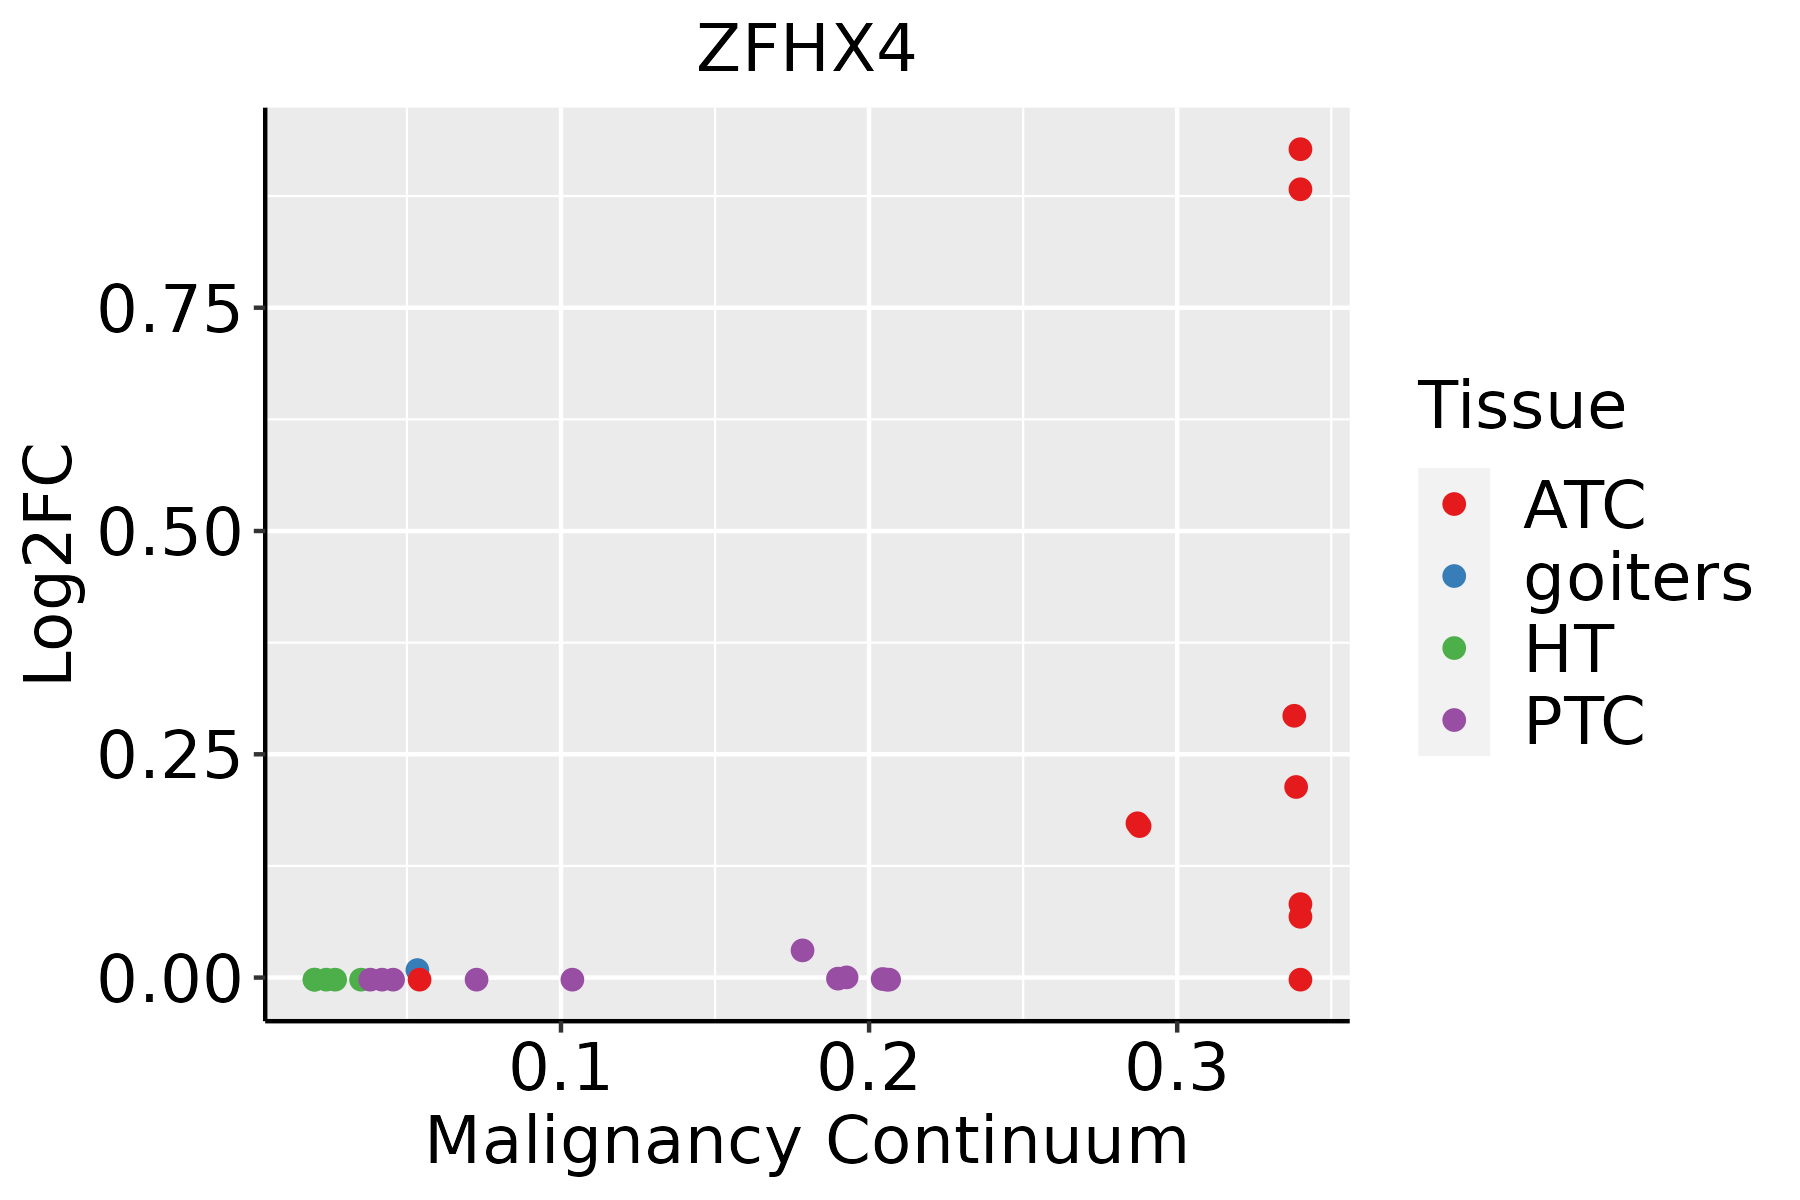 | ATC: Anaplastic thyroid cancer |
| HT: Hashimoto's thyroiditis | ||
| PTC: Papillary thyroid cancer |
| ∗log2FC in expression of this searched gene in stem-like cells from each diseased tissue sample relative to stem-like cells in normal samples in each tissue plotted against the malignancy continuum. Samples are colored based on if they are from different disease stage. |
Top |
Malignant transformation related pathway analysis |
| Find out the enriched GO biological processes and KEGG pathways involved in transition from healthy to precancer to cancer |
| Tissue | Disease Stage | Enriched GO biological Processes |
| Colorectum | AD |  |
| Colorectum | SER |  |
| Colorectum | MSS |  |
| Colorectum | MSI-H |  |
| Colorectum | FAP |  |
| ∗Top 15 enriched GO BP terms are showed in the bar plot of each disease state in each tissue. Each row represents a significant GO biological process which is colored according to the -log10(p.adjust). |
| Page: 1 2 3 4 5 6 7 8 9 |
| GO ID | Tissue | Disease Stage | Description | Gene Ratio | Bg Ratio | pvalue | p.adjust | Count |
| Page: 1 |
| Pathway ID | Tissue | Disease Stage | Description | Gene Ratio | Bg Ratio | pvalue | p.adjust | qvalue | Count |
| Page: 1 |
Top |
Cell-cell communication analysis |
| Identification of potential cell-cell interactions between two cell types and their ligand-receptor pairs for different disease states |
| Ligand | Receptor | LRpair | Pathway | Tissue | Disease Stage |
| Page: 1 |
Top |
Single-cell gene regulatory network inference analysis |
| Find out the significant the regulons (TFs) and the target genes of each regulon across cell types for different disease states |
| TF | Cell Type | Tissue | Disease Stage | Target Gene | RSS | Regulon Activity |
| ∗The dot plots of a searched regulon are shown for all cell subpopulations in each disease state of each tissue based on the regulon specific score inferred using pySCENIC and by calculating the average expression. |
| Page: 1 |
Top |
Somatic mutation of malignant transformation related genes |
| Annotation of somatic variants for genes involved in malignant transformation |
| Hugo Symbol | Variant Class | Variant Classification | dbSNP RS | HGVSc | HGVSp | HGVSp Short | SWISSPROT | BIOTYPE | SIFT | PolyPhen | Tumor Sample Barcode | Tissue | Histology | Sex | Age | Stage | Therapy Types | Drugs | Outcome |
| ZFHX4 | SNV | Missense_Mutation | novel | c.1577C>T | p.Ser526Leu | p.S526L | Q86UP3 | protein_coding | deleterious_low_confidence(0.04) | benign(0.003) | TCGA-3C-AALI-01 | Breast | breast invasive carcinoma | Female | <65 | I/II | Unspecific | Poly E | Complete Response |
| ZFHX4 | SNV | Missense_Mutation | novel | c.3843N>T | p.Met1281Ile | p.M1281I | Q86UP3 | protein_coding | deleterious(0.04) | benign(0.085) | TCGA-3C-AALJ-01 | Breast | breast invasive carcinoma | Female | <65 | I/II | Chemotherapy | doxorubicin | SD |
| ZFHX4 | SNV | Missense_Mutation | c.2939N>T | p.Gly980Val | p.G980V | Q86UP3 | protein_coding | deleterious(0) | probably_damaging(1) | TCGA-A1-A0SE-01 | Breast | breast invasive carcinoma | Female | <65 | I/II | Unknown | Unknown | SD | |
| ZFHX4 | SNV | Missense_Mutation | c.199N>A | p.Glu67Lys | p.E67K | Q86UP3 | protein_coding | tolerated_low_confidence(0.3) | benign(0.173) | TCGA-A1-A0SH-01 | Breast | breast invasive carcinoma | Female | <65 | I/II | Chemotherapy | tc | SD | |
| ZFHX4 | SNV | Missense_Mutation | c.1818N>A | p.Asp606Glu | p.D606E | Q86UP3 | protein_coding | tolerated_low_confidence(1) | benign(0.018) | TCGA-A1-A0SO-01 | Breast | breast invasive carcinoma | Female | >=65 | I/II | Chemotherapy | SD | ||
| ZFHX4 | SNV | Missense_Mutation | c.10619N>T | p.Ser3540Phe | p.S3540F | Q86UP3 | protein_coding | deleterious_low_confidence(0.01) | possibly_damaging(0.885) | TCGA-A2-A0EQ-01 | Breast | breast invasive carcinoma | Female | <65 | I/II | Chemotherapy | adriamycin | SD | |
| ZFHX4 | SNV | Missense_Mutation | novel | c.1723A>T | p.Ser575Cys | p.S575C | Q86UP3 | protein_coding | deleterious(0.01) | benign(0.28) | TCGA-A2-A0EV-01 | Breast | breast invasive carcinoma | Female | >=65 | I/II | Unknown | Unknown | SD |
| ZFHX4 | SNV | Missense_Mutation | c.4993N>A | p.Leu1665Ile | p.L1665I | Q86UP3 | protein_coding | tolerated(0.36) | benign(0.003) | TCGA-A2-A0YG-01 | Breast | breast invasive carcinoma | Female | <65 | III/IV | Chemotherapy | cytoxan | SD | |
| ZFHX4 | SNV | Missense_Mutation | c.545C>T | p.Ser182Phe | p.S182F | Q86UP3 | protein_coding | deleterious(0.01) | benign(0.244) | TCGA-A2-A0YH-01 | Breast | breast invasive carcinoma | Female | <65 | III/IV | Chemotherapy | adriamycin | SD | |
| ZFHX4 | SNV | Missense_Mutation | c.10767T>A | p.Asp3589Glu | p.D3589E | Q86UP3 | protein_coding | tolerated_low_confidence(0.11) | probably_damaging(0.917) | TCGA-A2-A0YH-01 | Breast | breast invasive carcinoma | Female | <65 | III/IV | Chemotherapy | adriamycin | SD |
| Page: 1 2 3 4 5 6 7 8 9 10 11 12 13 14 15 16 17 18 19 20 21 22 23 24 25 26 27 28 29 30 31 32 33 34 35 36 37 38 39 40 41 42 43 44 45 46 47 48 49 50 51 52 53 54 55 56 57 58 59 60 61 62 63 64 65 66 67 68 69 70 71 72 73 74 75 76 77 78 79 80 81 82 83 84 85 86 87 88 89 90 91 92 93 94 95 96 97 98 99 100 101 102 103 104 105 106 107 108 109 110 |
Top |
Related drugs of malignant transformation related genes |
| Identification of chemicals and drugs interact with genes involved in malignant transfromation |
| (DGIdb 4.0) |
| Entrez ID | Symbol | Category | Interaction Types | Drug Claim Name | Drug Name | PMIDs |
| Page: 1 |

Copyright 2023-Present -The University of Texas Health Science Center at Houston |