
|
|||||
|
 | |
| |
| |
| |
| |
| |
|
Gene: ZFHX3 |
Gene summary for ZFHX3 |
| Gene information | Species | Human | Gene symbol | ZFHX3 | Gene ID | 463 |
| Gene name | zinc finger homeobox 3 | |
| Gene Alias | ATBF1 | |
| Cytomap | 16q22.2-q22.3 | |
| Gene Type | protein-coding | GO ID | GO:0000122 | UniProtAcc | Q15911 |
Top |
Malignant transformation analysis |
| Identification of the aberrant gene expression in precancerous and cancerous lesions by comparing the gene expression of stem-like cells in diseased tissues with normal stem cells |
| Entrez ID | Symbol | Replicates | Species | Organ | Tissue | Adj P-value | Log2FC | Malignancy |
| 463 | ZFHX3 | HTA11_3410_2000001011 | Human | Colorectum | AD | 6.82e-12 | -4.96e-01 | 0.0155 |
| 463 | ZFHX3 | HTA11_7663_2000001011 | Human | Colorectum | SER | 1.00e-03 | 6.80e-01 | 0.0131 |
| 463 | ZFHX3 | HTA11_99999970781_79442 | Human | Colorectum | MSS | 8.78e-04 | -2.58e-01 | 0.294 |
| 463 | ZFHX3 | HTA11_99999973899_84307 | Human | Colorectum | MSS | 3.68e-02 | -5.50e-01 | 0.2585 |
| 463 | ZFHX3 | F007 | Human | Colorectum | FAP | 2.34e-02 | -2.61e-01 | 0.1176 |
| 463 | ZFHX3 | A002-C-010 | Human | Colorectum | FAP | 4.06e-03 | -8.91e-02 | 0.242 |
| 463 | ZFHX3 | A001-C-207 | Human | Colorectum | FAP | 1.70e-02 | -1.56e-01 | 0.1278 |
| 463 | ZFHX3 | A015-C-203 | Human | Colorectum | FAP | 6.36e-38 | -5.45e-01 | -0.1294 |
| 463 | ZFHX3 | A015-C-204 | Human | Colorectum | FAP | 4.69e-05 | -2.53e-01 | -0.0228 |
| 463 | ZFHX3 | A014-C-040 | Human | Colorectum | FAP | 6.64e-05 | -2.29e-01 | -0.1184 |
| 463 | ZFHX3 | A002-C-201 | Human | Colorectum | FAP | 5.95e-14 | -2.28e-01 | 0.0324 |
| 463 | ZFHX3 | A002-C-203 | Human | Colorectum | FAP | 1.91e-02 | -4.49e-02 | 0.2786 |
| 463 | ZFHX3 | A001-C-119 | Human | Colorectum | FAP | 6.54e-07 | -2.24e-01 | -0.1557 |
| 463 | ZFHX3 | A001-C-108 | Human | Colorectum | FAP | 3.61e-25 | -3.67e-01 | -0.0272 |
| 463 | ZFHX3 | A002-C-205 | Human | Colorectum | FAP | 1.71e-23 | -3.04e-01 | -0.1236 |
| 463 | ZFHX3 | A001-C-104 | Human | Colorectum | FAP | 1.19e-03 | -2.24e-01 | 0.0184 |
| 463 | ZFHX3 | A015-C-005 | Human | Colorectum | FAP | 1.81e-05 | -2.38e-01 | -0.0336 |
| 463 | ZFHX3 | A015-C-006 | Human | Colorectum | FAP | 1.04e-19 | -5.30e-01 | -0.0994 |
| 463 | ZFHX3 | A015-C-106 | Human | Colorectum | FAP | 2.04e-16 | -2.51e-01 | -0.0511 |
| 463 | ZFHX3 | A002-C-114 | Human | Colorectum | FAP | 4.72e-21 | -2.94e-01 | -0.1561 |
| Page: 1 2 3 4 5 6 7 8 9 10 |
| Tissue | Expression Dynamics | Abbreviation |
| Colorectum (GSE201348) |  | FAP: Familial adenomatous polyposis |
| CRC: Colorectal cancer | ||
| Colorectum (HTA11) | 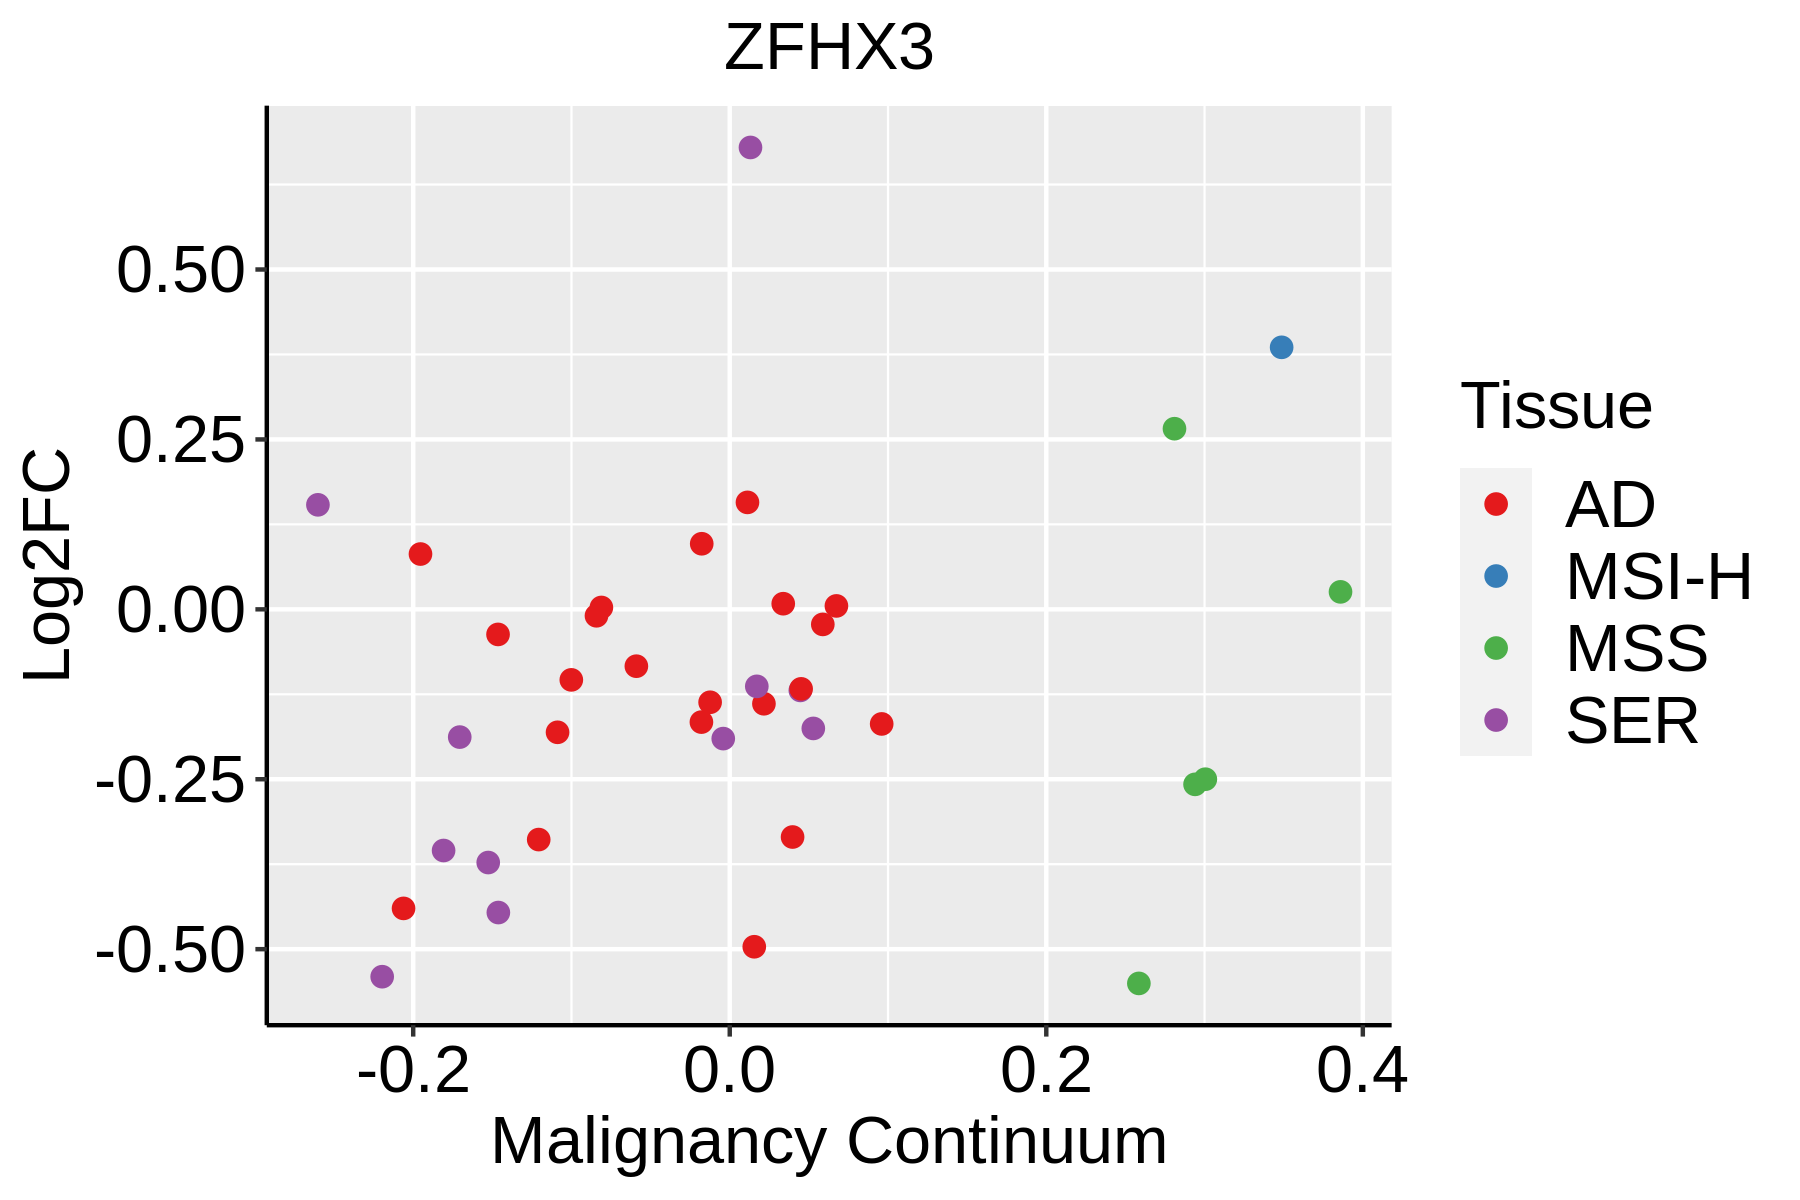 | AD: Adenomas |
| SER: Sessile serrated lesions | ||
| MSI-H: Microsatellite-high colorectal cancer | ||
| MSS: Microsatellite stable colorectal cancer | ||
| Endometrium | 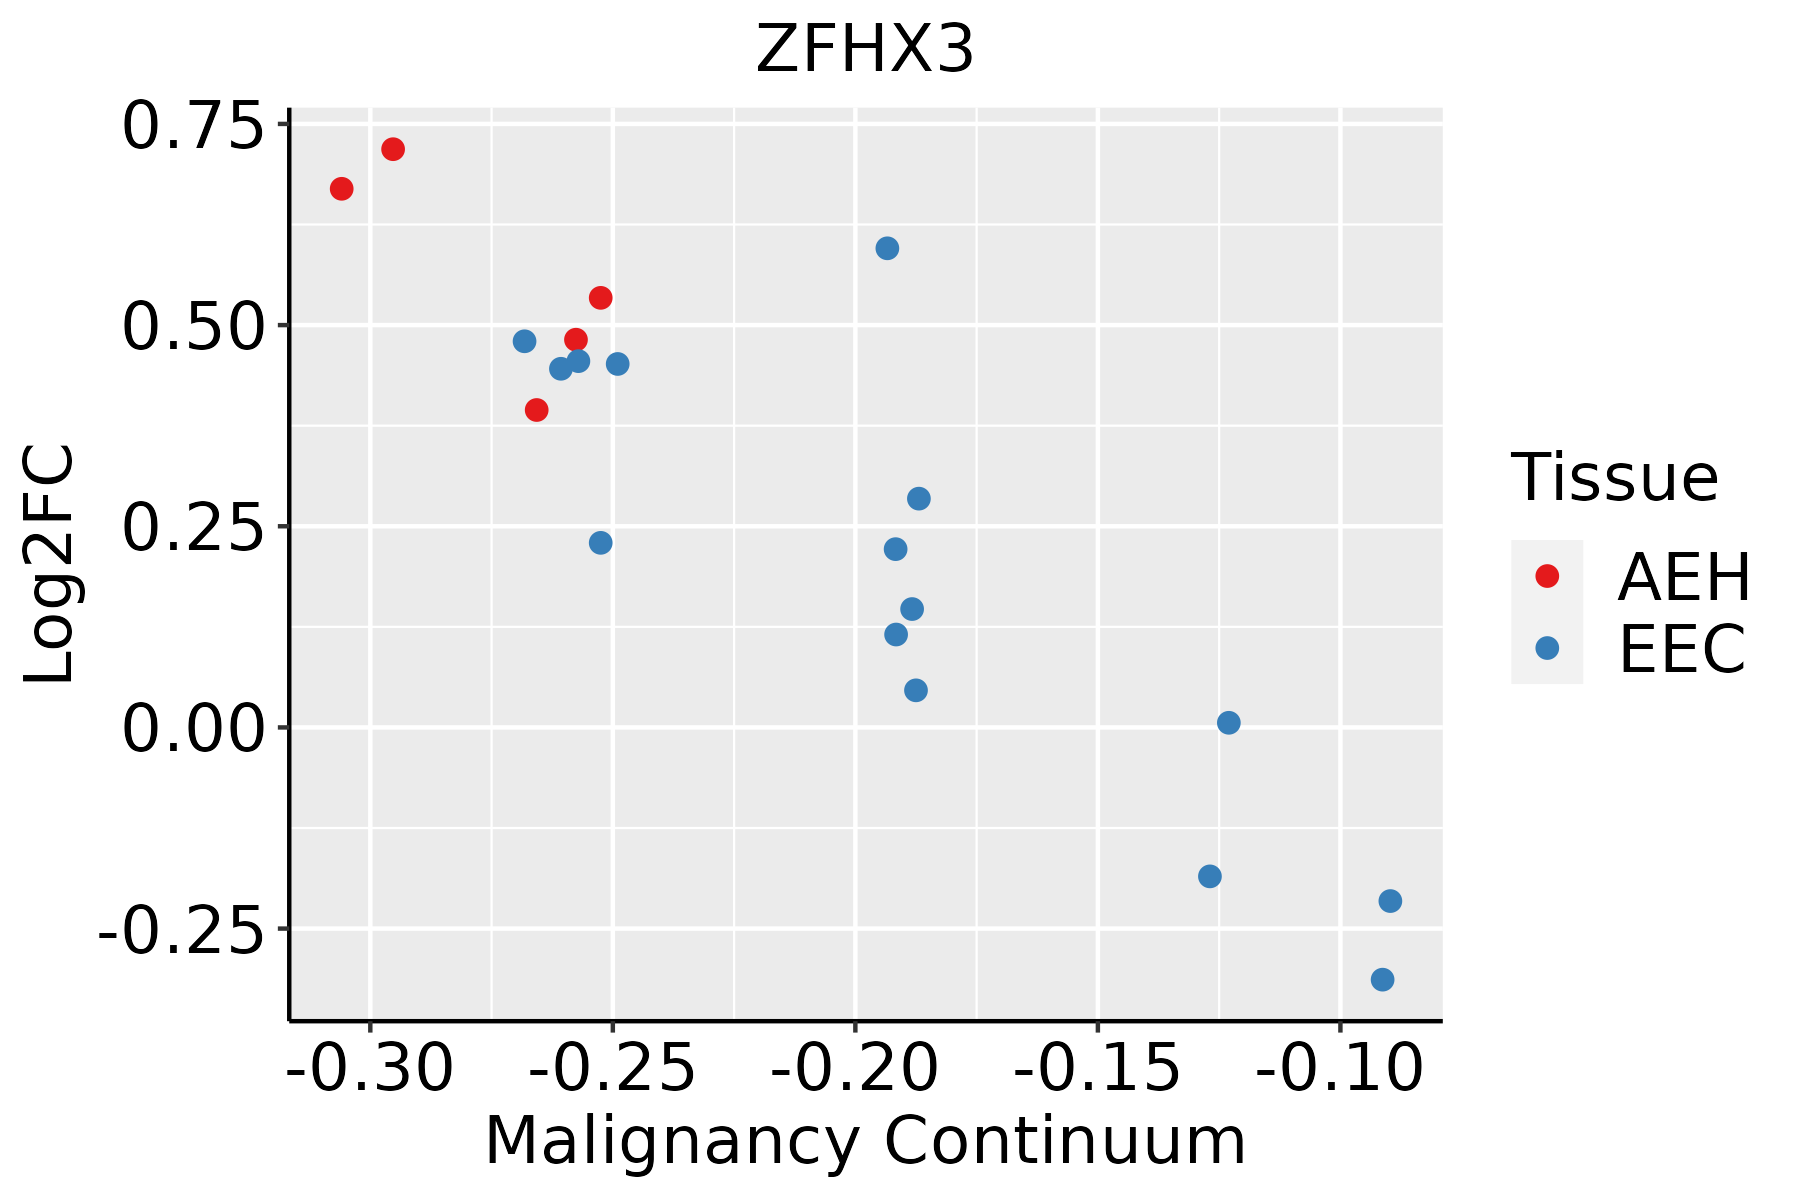 | AEH: Atypical endometrial hyperplasia |
| EEC: Endometrioid Cancer | ||
| Esophagus |  | ESCC: Esophageal squamous cell carcinoma |
| HGIN: High-grade intraepithelial neoplasias | ||
| LGIN: Low-grade intraepithelial neoplasias | ||
| Liver | 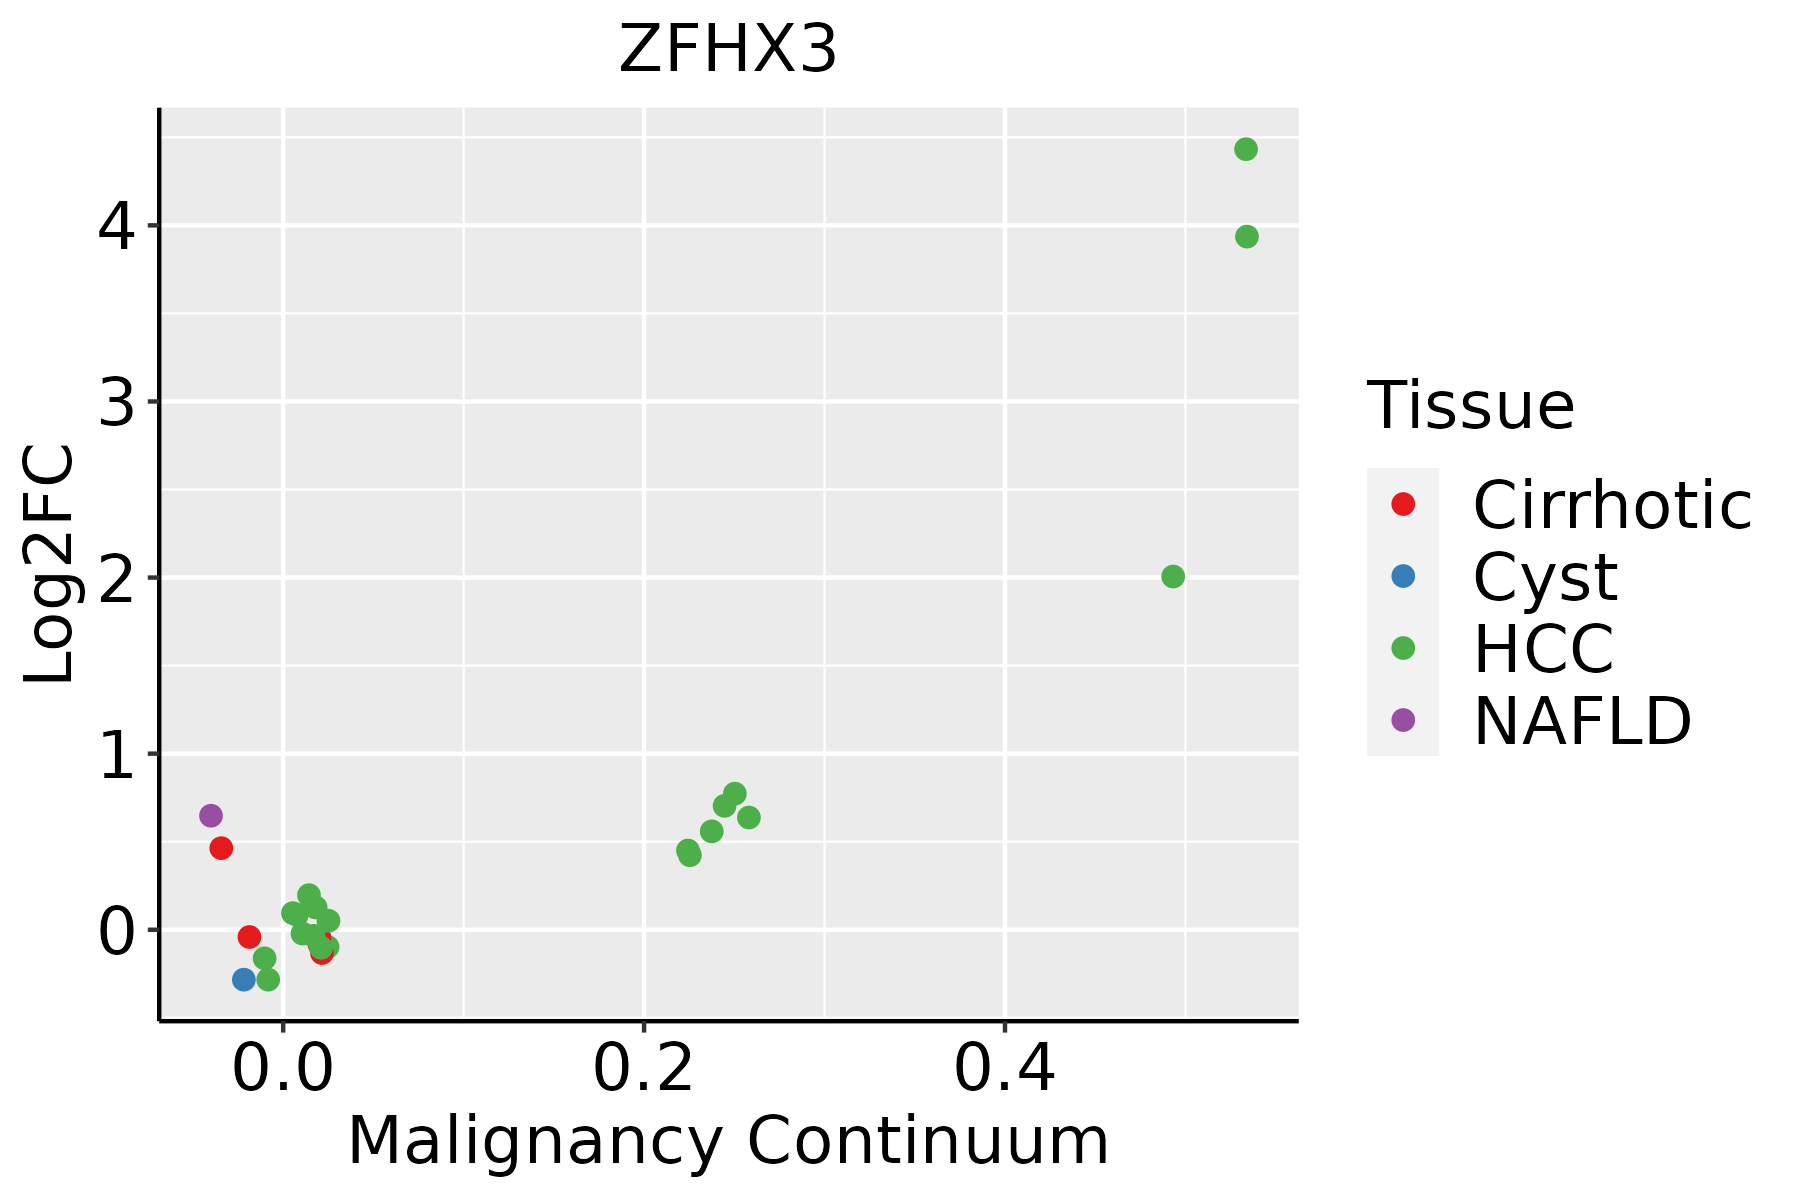 | HCC: Hepatocellular carcinoma |
| NAFLD: Non-alcoholic fatty liver disease | ||
| Lung | 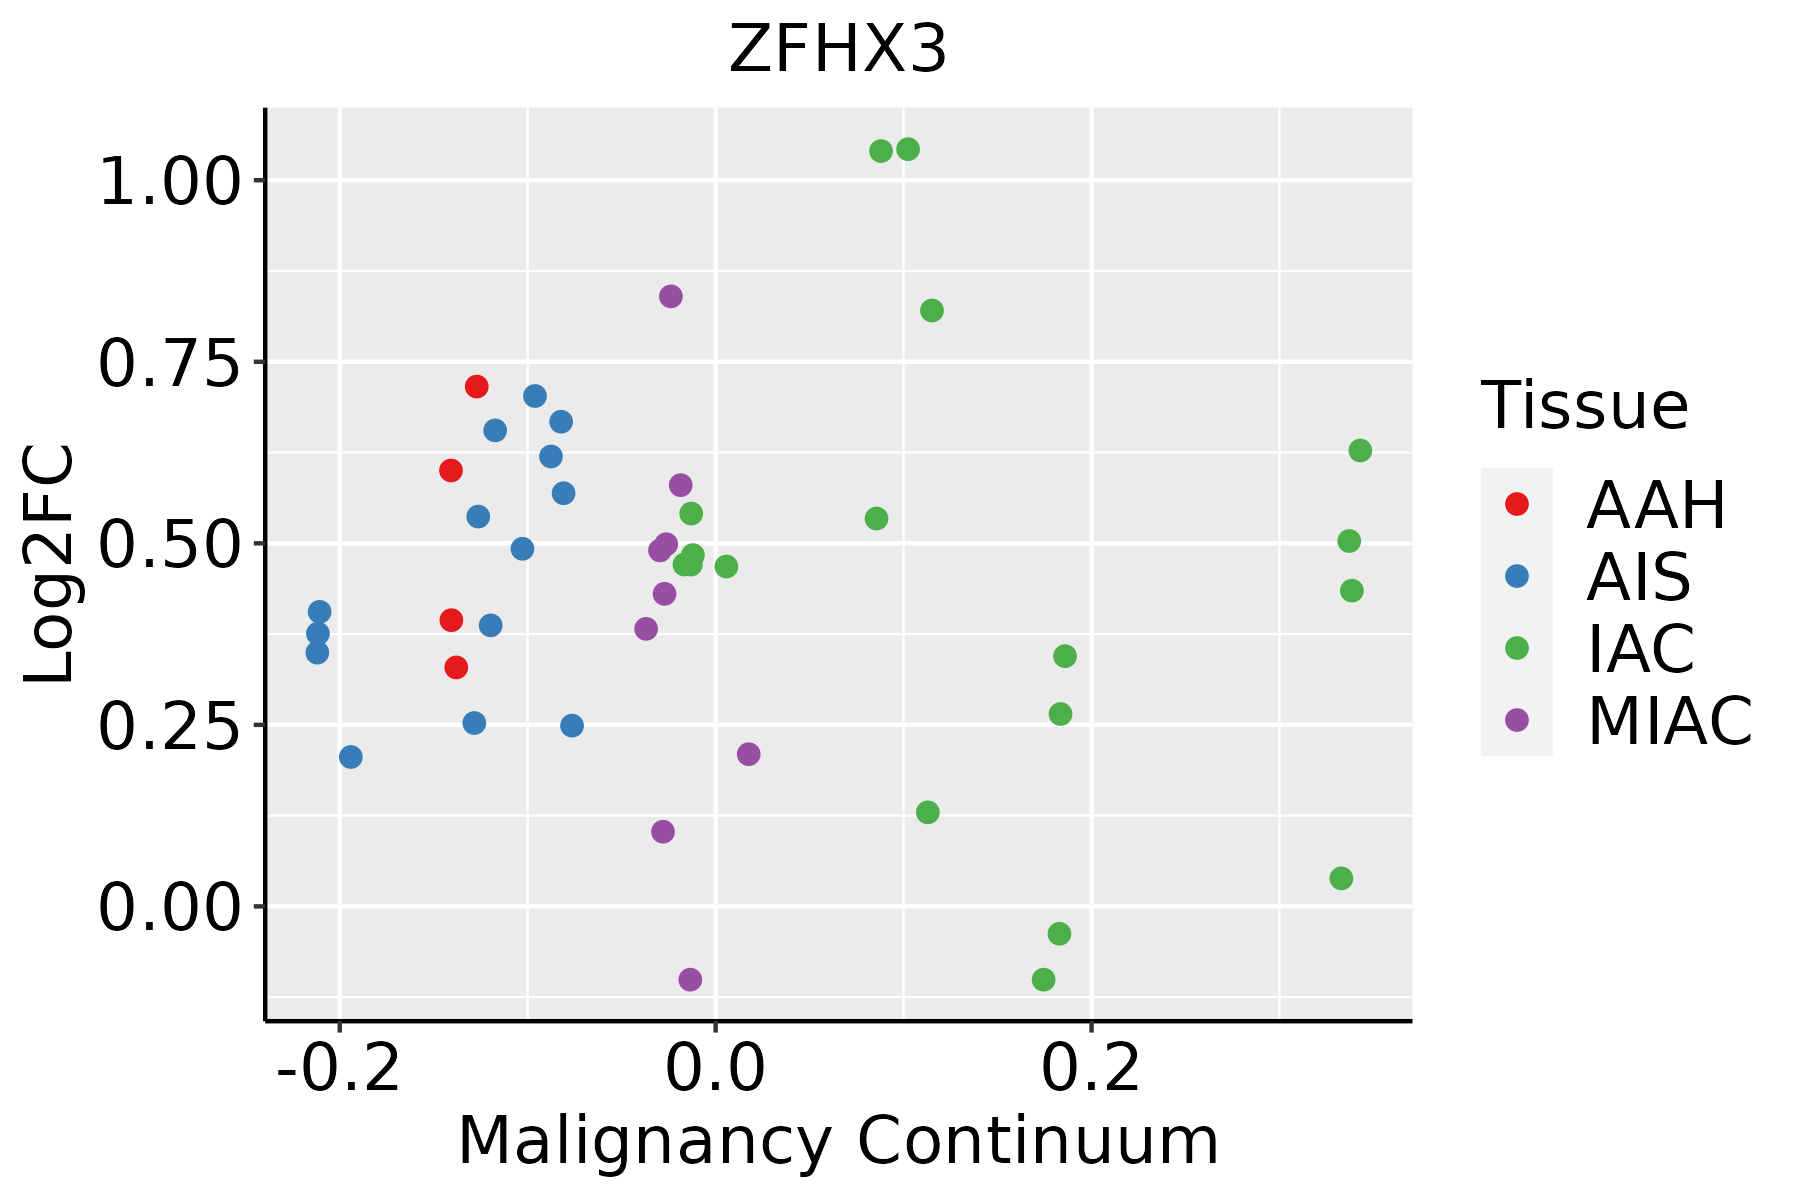 | AAH: Atypical adenomatous hyperplasia |
| AIS: Adenocarcinoma in situ | ||
| IAC: Invasive lung adenocarcinoma | ||
| MIA: Minimally invasive adenocarcinoma | ||
| Prostate | 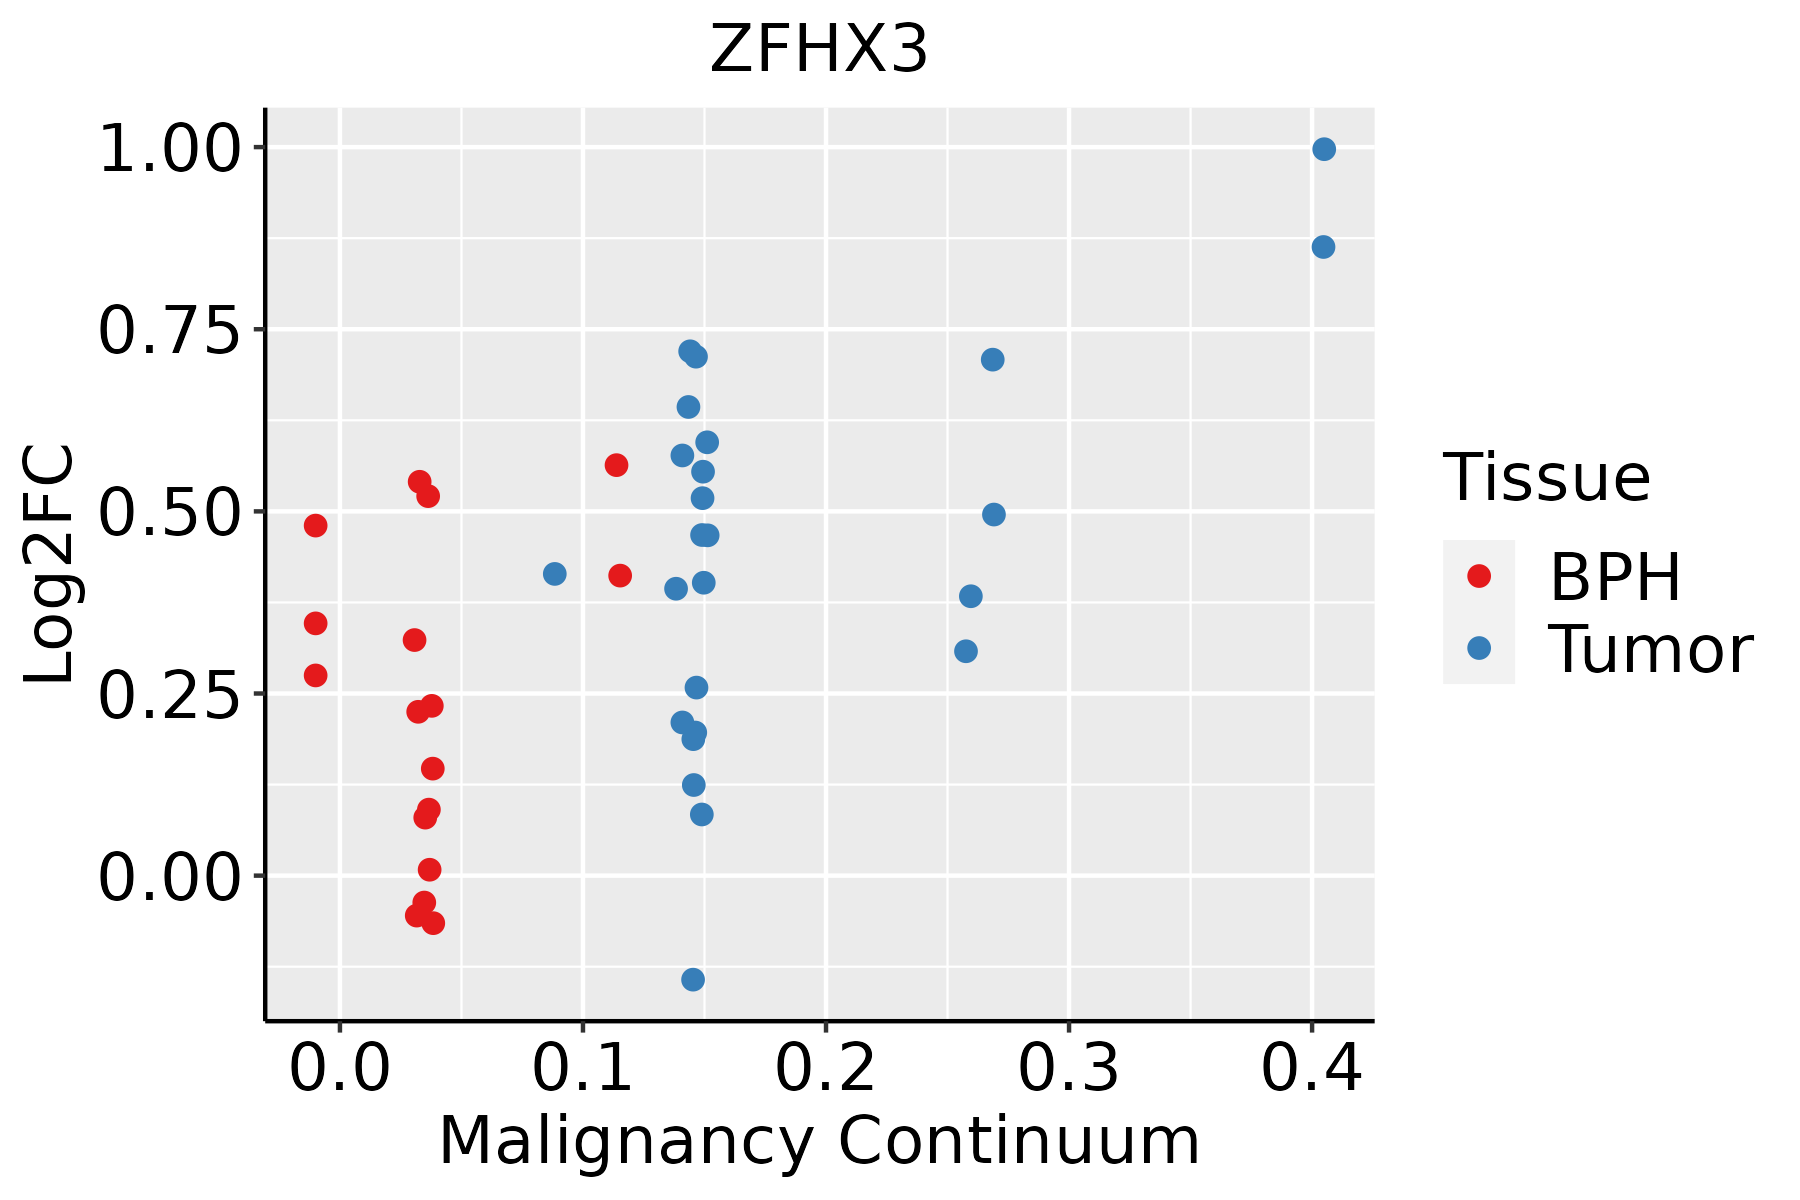 | BPH: Benign Prostatic Hyperplasia |
| Thyroid | 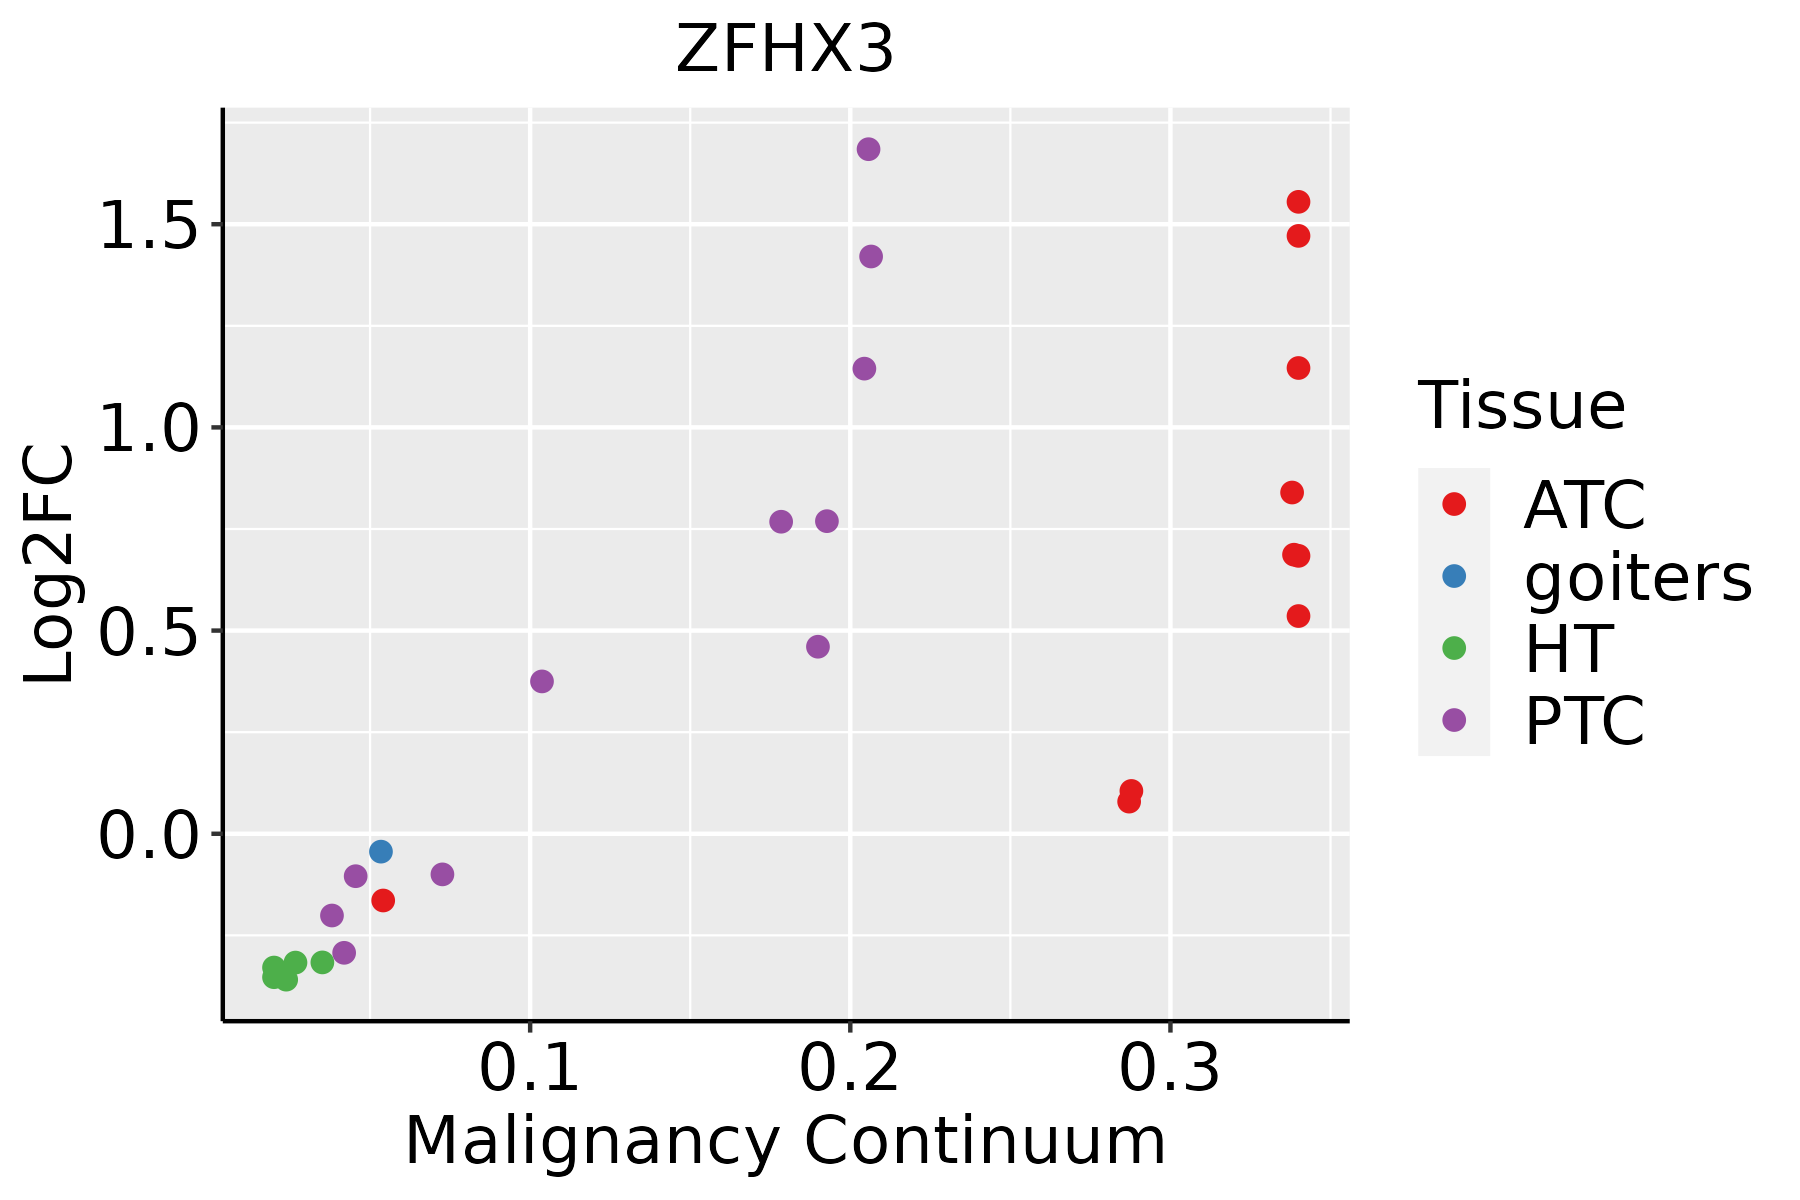 | ATC: Anaplastic thyroid cancer |
| HT: Hashimoto's thyroiditis | ||
| PTC: Papillary thyroid cancer |
| ∗log2FC in expression of this searched gene in stem-like cells from each diseased tissue sample relative to stem-like cells in normal samples in each tissue plotted against the malignancy continuum. Samples are colored based on if they are from different disease stage. |
Top |
Malignant transformation related pathway analysis |
| Find out the enriched GO biological processes and KEGG pathways involved in transition from healthy to precancer to cancer |
| Tissue | Disease Stage | Enriched GO biological Processes |
| Colorectum | AD |  |
| Colorectum | SER |  |
| Colorectum | MSS |  |
| Colorectum | MSI-H |  |
| Colorectum | FAP |  |
| ∗Top 15 enriched GO BP terms are showed in the bar plot of each disease state in each tissue. Each row represents a significant GO biological process which is colored according to the -log10(p.adjust). |
| Page: 1 2 3 4 5 6 7 8 9 |
| GO ID | Tissue | Disease Stage | Description | Gene Ratio | Bg Ratio | pvalue | p.adjust | Count |
| GO:0007623 | Colorectum | AD | circadian rhythm | 72/3918 | 210/18723 | 4.50e-06 | 1.21e-04 | 72 |
| GO:0048511 | Colorectum | AD | rhythmic process | 94/3918 | 298/18723 | 1.00e-05 | 2.34e-04 | 94 |
| GO:0045785 | Colorectum | AD | positive regulation of cell adhesion | 122/3918 | 437/18723 | 2.65e-04 | 3.28e-03 | 122 |
| GO:0042752 | Colorectum | AD | regulation of circadian rhythm | 40/3918 | 121/18723 | 1.24e-03 | 1.09e-02 | 40 |
| GO:0071559 | Colorectum | AD | response to transforming growth factor beta | 74/3918 | 256/18723 | 1.45e-03 | 1.23e-02 | 74 |
| GO:00076231 | Colorectum | SER | circadian rhythm | 54/2897 | 210/18723 | 7.98e-05 | 1.77e-03 | 54 |
| GO:00457851 | Colorectum | SER | positive regulation of cell adhesion | 93/2897 | 437/18723 | 6.78e-04 | 9.04e-03 | 93 |
| GO:00485111 | Colorectum | SER | rhythmic process | 65/2897 | 298/18723 | 2.18e-03 | 2.11e-02 | 65 |
| GO:00427521 | Colorectum | SER | regulation of circadian rhythm | 30/2897 | 121/18723 | 5.03e-03 | 3.88e-02 | 30 |
| GO:00076232 | Colorectum | MSS | circadian rhythm | 69/3467 | 210/18723 | 4.22e-07 | 1.67e-05 | 69 |
| GO:00485112 | Colorectum | MSS | rhythmic process | 89/3467 | 298/18723 | 1.17e-06 | 3.96e-05 | 89 |
| GO:00457852 | Colorectum | MSS | positive regulation of cell adhesion | 110/3467 | 437/18723 | 2.94e-04 | 3.87e-03 | 110 |
| GO:00427522 | Colorectum | MSS | regulation of circadian rhythm | 38/3467 | 121/18723 | 4.33e-04 | 5.23e-03 | 38 |
| GO:00076233 | Colorectum | FAP | circadian rhythm | 56/2622 | 210/18723 | 9.12e-07 | 4.14e-05 | 56 |
| GO:00485113 | Colorectum | FAP | rhythmic process | 72/2622 | 298/18723 | 1.67e-06 | 6.99e-05 | 72 |
| GO:00715591 | Colorectum | FAP | response to transforming growth factor beta | 63/2622 | 256/18723 | 3.82e-06 | 1.32e-04 | 63 |
| GO:00457854 | Colorectum | FAP | positive regulation of cell adhesion | 92/2622 | 437/18723 | 3.09e-05 | 7.04e-04 | 92 |
| GO:00427523 | Colorectum | FAP | regulation of circadian rhythm | 33/2622 | 121/18723 | 9.26e-05 | 1.59e-03 | 33 |
| GO:0032922 | Colorectum | FAP | circadian regulation of gene expression | 18/2622 | 68/18723 | 4.83e-03 | 3.25e-02 | 18 |
| GO:00485114 | Colorectum | CRC | rhythmic process | 64/2078 | 298/18723 | 1.43e-07 | 1.62e-05 | 64 |
| Page: 1 2 3 4 5 6 |
| Pathway ID | Tissue | Disease Stage | Description | Gene Ratio | Bg Ratio | pvalue | p.adjust | qvalue | Count |
| Page: 1 |
Top |
Cell-cell communication analysis |
| Identification of potential cell-cell interactions between two cell types and their ligand-receptor pairs for different disease states |
| Ligand | Receptor | LRpair | Pathway | Tissue | Disease Stage |
| Page: 1 |
Top |
Single-cell gene regulatory network inference analysis |
| Find out the significant the regulons (TFs) and the target genes of each regulon across cell types for different disease states |
| TF | Cell Type | Tissue | Disease Stage | Target Gene | RSS | Regulon Activity |
| ZFHX3 | SMC | Breast | ADJ | CEBPD,PDGFRB,MYH11, etc. | 1.22e-02 |  |
| ZFHX3 | PERI | Breast | DCIS | CEBPD,PDGFRB,MYH11, etc. | 8.80e-02 |  |
| ZFHX3 | MYOFIB | Breast | Healthy | CEBPD,PDGFRB,MYH11, etc. | 1.41e-01 |  |
| ZFHX3 | SMC | Breast | Healthy | CEBPD,PDGFRB,MYH11, etc. | 1.07e-01 | |
| ZFHX3 | PERI | Breast | IDC | CEBPD,PDGFRB,MYH11, etc. | 2.28e-01 |  |
| ZFHX3 | SMC | Breast | Precancer | CEBPD,PDGFRB,MYH11, etc. | 1.27e-01 |  |
| ZFHX3 | PERI | Breast | Precancer | CEBPD,PDGFRB,MYH11, etc. | 2.01e-02 | |
| ZFHX3 | PERI | Cervix | ADJ | NTRK3,MCAM,RBPMS2, etc. | 2.64e-01 |  |
| ZFHX3 | PERI | Colorectum | FAP | ETV1,RGS6,UNC5D, etc. | 5.29e-02 |  |
| ZFHX3 | ECM | Colorectum | Healthy | ETV1,RGS6,UNC5D, etc. | 1.19e-01 |  |
| ∗The dot plots of a searched regulon are shown for all cell subpopulations in each disease state of each tissue based on the regulon specific score inferred using pySCENIC and by calculating the average expression. |
| Page: 1 2 3 |
Top |
Somatic mutation of malignant transformation related genes |
| Annotation of somatic variants for genes involved in malignant transformation |
| Hugo Symbol | Variant Class | Variant Classification | dbSNP RS | HGVSc | HGVSp | HGVSp Short | SWISSPROT | BIOTYPE | SIFT | PolyPhen | Tumor Sample Barcode | Tissue | Histology | Sex | Age | Stage | Therapy Types | Drugs | Outcome |
| ZFHX3 | SNV | Missense_Mutation | novel | c.10760N>T | p.Ser3587Leu | p.S3587L | Q15911 | protein_coding | deleterious_low_confidence(0) | probably_damaging(0.953) | TCGA-A2-A3Y0-01 | Breast | breast invasive carcinoma | Female | <65 | I/II | Chemotherapy | adriamycin | CR |
| ZFHX3 | SNV | Missense_Mutation | c.3239G>C | p.Gly1080Ala | p.G1080A | Q15911 | protein_coding | tolerated(1) | benign(0.056) | TCGA-A8-A09G-01 | Breast | breast invasive carcinoma | Female | >=65 | III/IV | Unknown | Unknown | SD | |
| ZFHX3 | SNV | Missense_Mutation | c.6956G>A | p.Arg2319Lys | p.R2319K | Q15911 | protein_coding | deleterious(0) | probably_damaging(0.956) | TCGA-AN-A0FX-01 | Breast | breast invasive carcinoma | Female | <65 | I/II | Unknown | Unknown | SD | |
| ZFHX3 | SNV | Missense_Mutation | c.4532N>T | p.Gly1511Val | p.G1511V | Q15911 | protein_coding | deleterious(0.05) | possibly_damaging(0.689) | TCGA-B6-A0RG-01 | Breast | breast invasive carcinoma | Female | <65 | I/II | Unknown | Unknown | SD | |
| ZFHX3 | SNV | Missense_Mutation | rs768186851 | c.3413N>A | p.Ile1138Asn | p.I1138N | Q15911 | protein_coding | deleterious(0) | probably_damaging(0.988) | TCGA-BH-A0BQ-01 | Breast | breast invasive carcinoma | Female | <65 | I/II | Unknown | Unknown | PD |
| ZFHX3 | SNV | Missense_Mutation | c.11024N>A | p.Pro3675Gln | p.P3675Q | Q15911 | protein_coding | tolerated_low_confidence(0.09) | benign(0.007) | TCGA-BH-A2L8-01 | Breast | breast invasive carcinoma | Female | <65 | I/II | Chemotherapy | cytoxan | CR | |
| ZFHX3 | SNV | Missense_Mutation | c.4529C>T | p.Ser1510Phe | p.S1510F | Q15911 | protein_coding | deleterious(0) | possibly_damaging(0.495) | TCGA-C8-A12T-01 | Breast | breast invasive carcinoma | Female | <65 | I/II | Unknown | Unknown | SD | |
| ZFHX3 | SNV | Missense_Mutation | novel | c.4277N>C | p.Arg1426Thr | p.R1426T | Q15911 | protein_coding | deleterious(0) | probably_damaging(0.965) | TCGA-C8-A8HP-01 | Breast | breast invasive carcinoma | Female | <65 | III/IV | Chemotherapy | 5-fluorouracil | CR |
| ZFHX3 | SNV | Missense_Mutation | c.5815N>C | p.Asp1939His | p.D1939H | Q15911 | protein_coding | tolerated(0.05) | probably_damaging(0.956) | TCGA-D8-A1XW-01 | Breast | breast invasive carcinoma | Female | <65 | I/II | Chemotherapy | adriamycin+cyclophosphamide | SD | |
| ZFHX3 | SNV | Missense_Mutation | rs759633185 | c.6395N>G | p.Tyr2132Cys | p.Y2132C | Q15911 | protein_coding | tolerated(0.33) | probably_damaging(0.995) | TCGA-E2-A15G-01 | Breast | breast invasive carcinoma | Female | >=65 | I/II | Hormone Therapy | arimidex | SD |
| Page: 1 2 3 4 5 6 7 8 9 10 11 12 13 14 15 16 17 18 19 20 21 22 23 24 25 26 27 28 29 30 31 32 33 34 35 36 37 38 39 40 41 42 43 44 45 46 47 48 |
Top |
Related drugs of malignant transformation related genes |
| Identification of chemicals and drugs interact with genes involved in malignant transfromation |
| (DGIdb 4.0) |
| Entrez ID | Symbol | Category | Interaction Types | Drug Claim Name | Drug Name | PMIDs |
| Page: 1 |

Copyright 2023-Present -The University of Texas Health Science Center at Houston |