
|
|||||
|
 | |
| |
| |
| |
| |
| |
|
Gene: ZFC3H1 |
Gene summary for ZFC3H1 |
| Gene information | Species | Human | Gene symbol | ZFC3H1 | Gene ID | 196441 |
| Gene name | zinc finger C3H1-type containing | |
| Gene Alias | CCDC131 | |
| Cytomap | 12q21.1 | |
| Gene Type | protein-coding | GO ID | GO:0006139 | UniProtAcc | O60293 |
Top |
Malignant transformation analysis |
| Identification of the aberrant gene expression in precancerous and cancerous lesions by comparing the gene expression of stem-like cells in diseased tissues with normal stem cells |
| Entrez ID | Symbol | Replicates | Species | Organ | Tissue | Adj P-value | Log2FC | Malignancy |
| 196441 | ZFC3H1 | CCI_1 | Human | Cervix | CC | 2.43e-03 | 6.71e-01 | 0.528 |
| 196441 | ZFC3H1 | CCI_2 | Human | Cervix | CC | 3.77e-16 | 1.39e+00 | 0.5249 |
| 196441 | ZFC3H1 | CCI_3 | Human | Cervix | CC | 5.12e-16 | 1.13e+00 | 0.516 |
| 196441 | ZFC3H1 | HTA11_3410_2000001011 | Human | Colorectum | AD | 1.89e-16 | -5.94e-01 | 0.0155 |
| 196441 | ZFC3H1 | HTA11_2487_2000001011 | Human | Colorectum | SER | 2.72e-07 | -5.84e-01 | -0.1808 |
| 196441 | ZFC3H1 | HTA11_1938_2000001011 | Human | Colorectum | AD | 3.67e-03 | -4.35e-01 | -0.0811 |
| 196441 | ZFC3H1 | HTA11_78_2000001011 | Human | Colorectum | AD | 1.43e-02 | -3.81e-01 | -0.1088 |
| 196441 | ZFC3H1 | HTA11_3361_2000001011 | Human | Colorectum | AD | 5.53e-05 | -5.60e-01 | -0.1207 |
| 196441 | ZFC3H1 | HTA11_83_2000001011 | Human | Colorectum | SER | 1.19e-02 | -3.75e-01 | -0.1526 |
| 196441 | ZFC3H1 | HTA11_696_2000001011 | Human | Colorectum | AD | 1.66e-09 | -4.49e-01 | -0.1464 |
| 196441 | ZFC3H1 | HTA11_866_2000001011 | Human | Colorectum | AD | 6.44e-03 | -3.58e-01 | -0.1001 |
| 196441 | ZFC3H1 | HTA11_866_3004761011 | Human | Colorectum | AD | 8.33e-12 | -5.24e-01 | 0.096 |
| 196441 | ZFC3H1 | HTA11_10711_2000001011 | Human | Colorectum | AD | 5.60e-04 | -3.96e-01 | 0.0338 |
| 196441 | ZFC3H1 | HTA11_7696_3000711011 | Human | Colorectum | AD | 1.59e-04 | -3.48e-01 | 0.0674 |
| 196441 | ZFC3H1 | HTA11_6818_2000001021 | Human | Colorectum | AD | 2.35e-06 | -5.17e-01 | 0.0588 |
| 196441 | ZFC3H1 | HTA11_99999970781_79442 | Human | Colorectum | MSS | 8.83e-04 | -3.57e-01 | 0.294 |
| 196441 | ZFC3H1 | HTA11_99999973899_84307 | Human | Colorectum | MSS | 1.28e-03 | -5.76e-01 | 0.2585 |
| 196441 | ZFC3H1 | HTA11_99999974143_84620 | Human | Colorectum | MSS | 1.37e-12 | -5.39e-01 | 0.3005 |
| 196441 | ZFC3H1 | A001-C-207 | Human | Colorectum | FAP | 4.91e-02 | -2.89e-02 | 0.1278 |
| 196441 | ZFC3H1 | A015-C-203 | Human | Colorectum | FAP | 9.89e-26 | -1.32e-01 | -0.1294 |
| Page: 1 2 3 4 5 6 7 8 9 |
| Tissue | Expression Dynamics | Abbreviation |
| Cervix |  | CC: Cervix cancer |
| HSIL_HPV: HPV-infected high-grade squamous intraepithelial lesions | ||
| N_HPV: HPV-infected normal cervix | ||
| Colorectum (GSE201348) |  | FAP: Familial adenomatous polyposis |
| CRC: Colorectal cancer | ||
| Colorectum (HTA11) |  | AD: Adenomas |
| SER: Sessile serrated lesions | ||
| MSI-H: Microsatellite-high colorectal cancer | ||
| MSS: Microsatellite stable colorectal cancer | ||
| Esophagus | 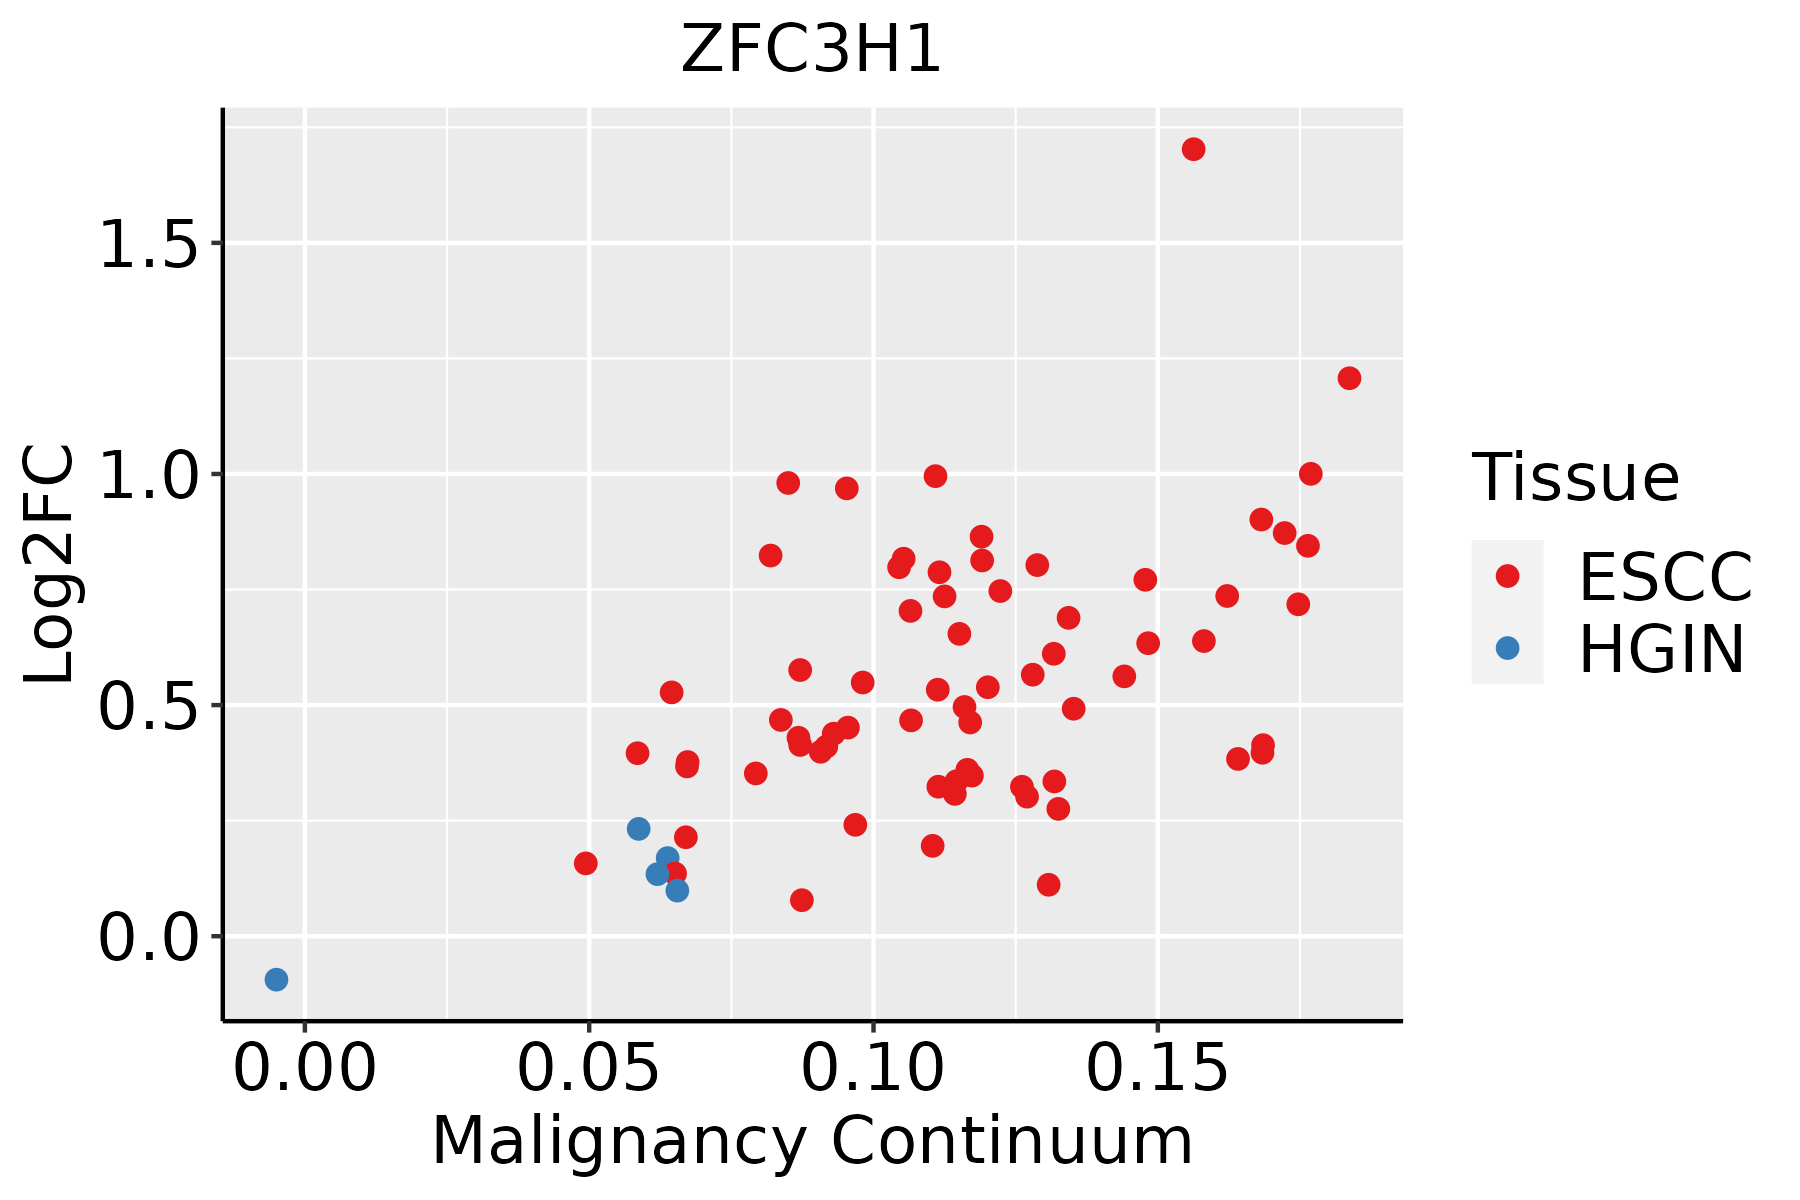 | ESCC: Esophageal squamous cell carcinoma |
| HGIN: High-grade intraepithelial neoplasias | ||
| LGIN: Low-grade intraepithelial neoplasias | ||
| Liver |  | HCC: Hepatocellular carcinoma |
| NAFLD: Non-alcoholic fatty liver disease | ||
| Lung |  | AAH: Atypical adenomatous hyperplasia |
| AIS: Adenocarcinoma in situ | ||
| IAC: Invasive lung adenocarcinoma | ||
| MIA: Minimally invasive adenocarcinoma | ||
| Prostate | 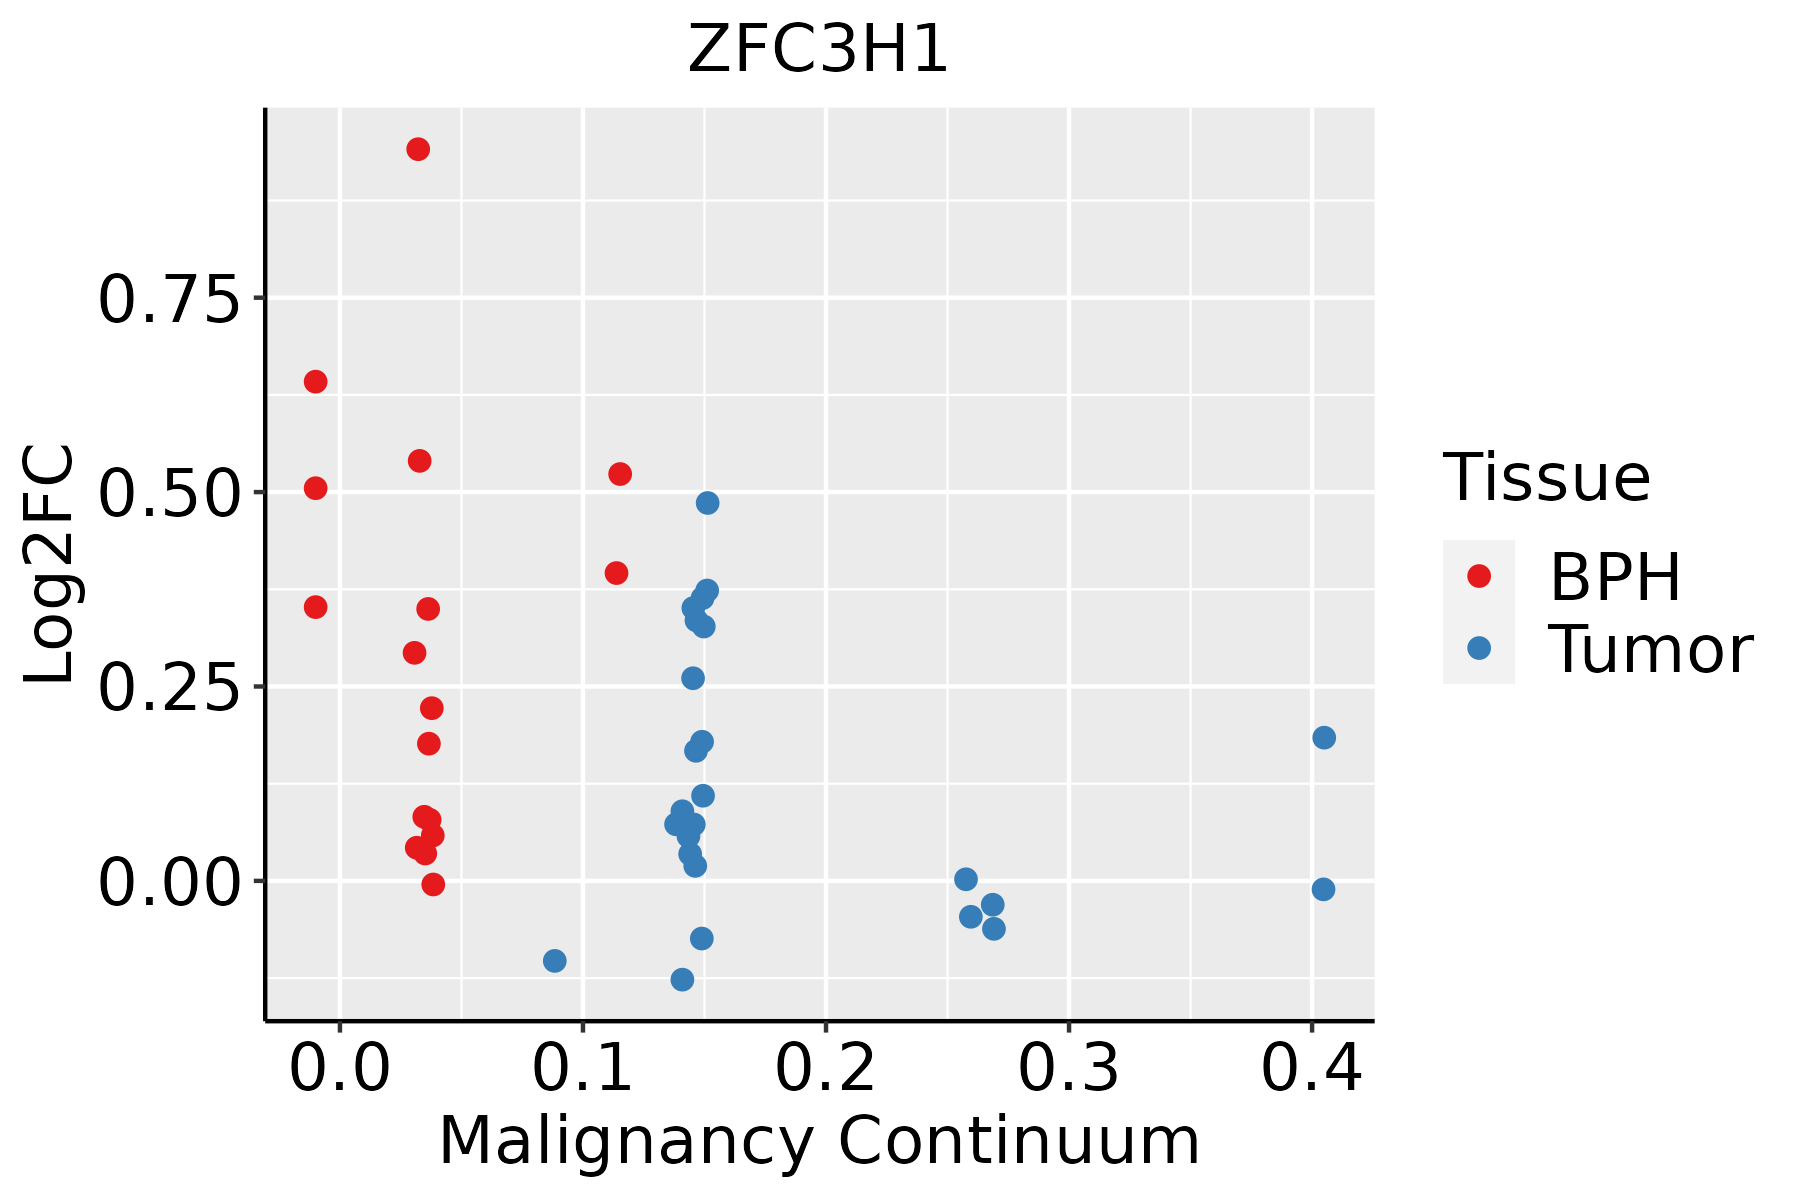 | BPH: Benign Prostatic Hyperplasia |
| Skin | 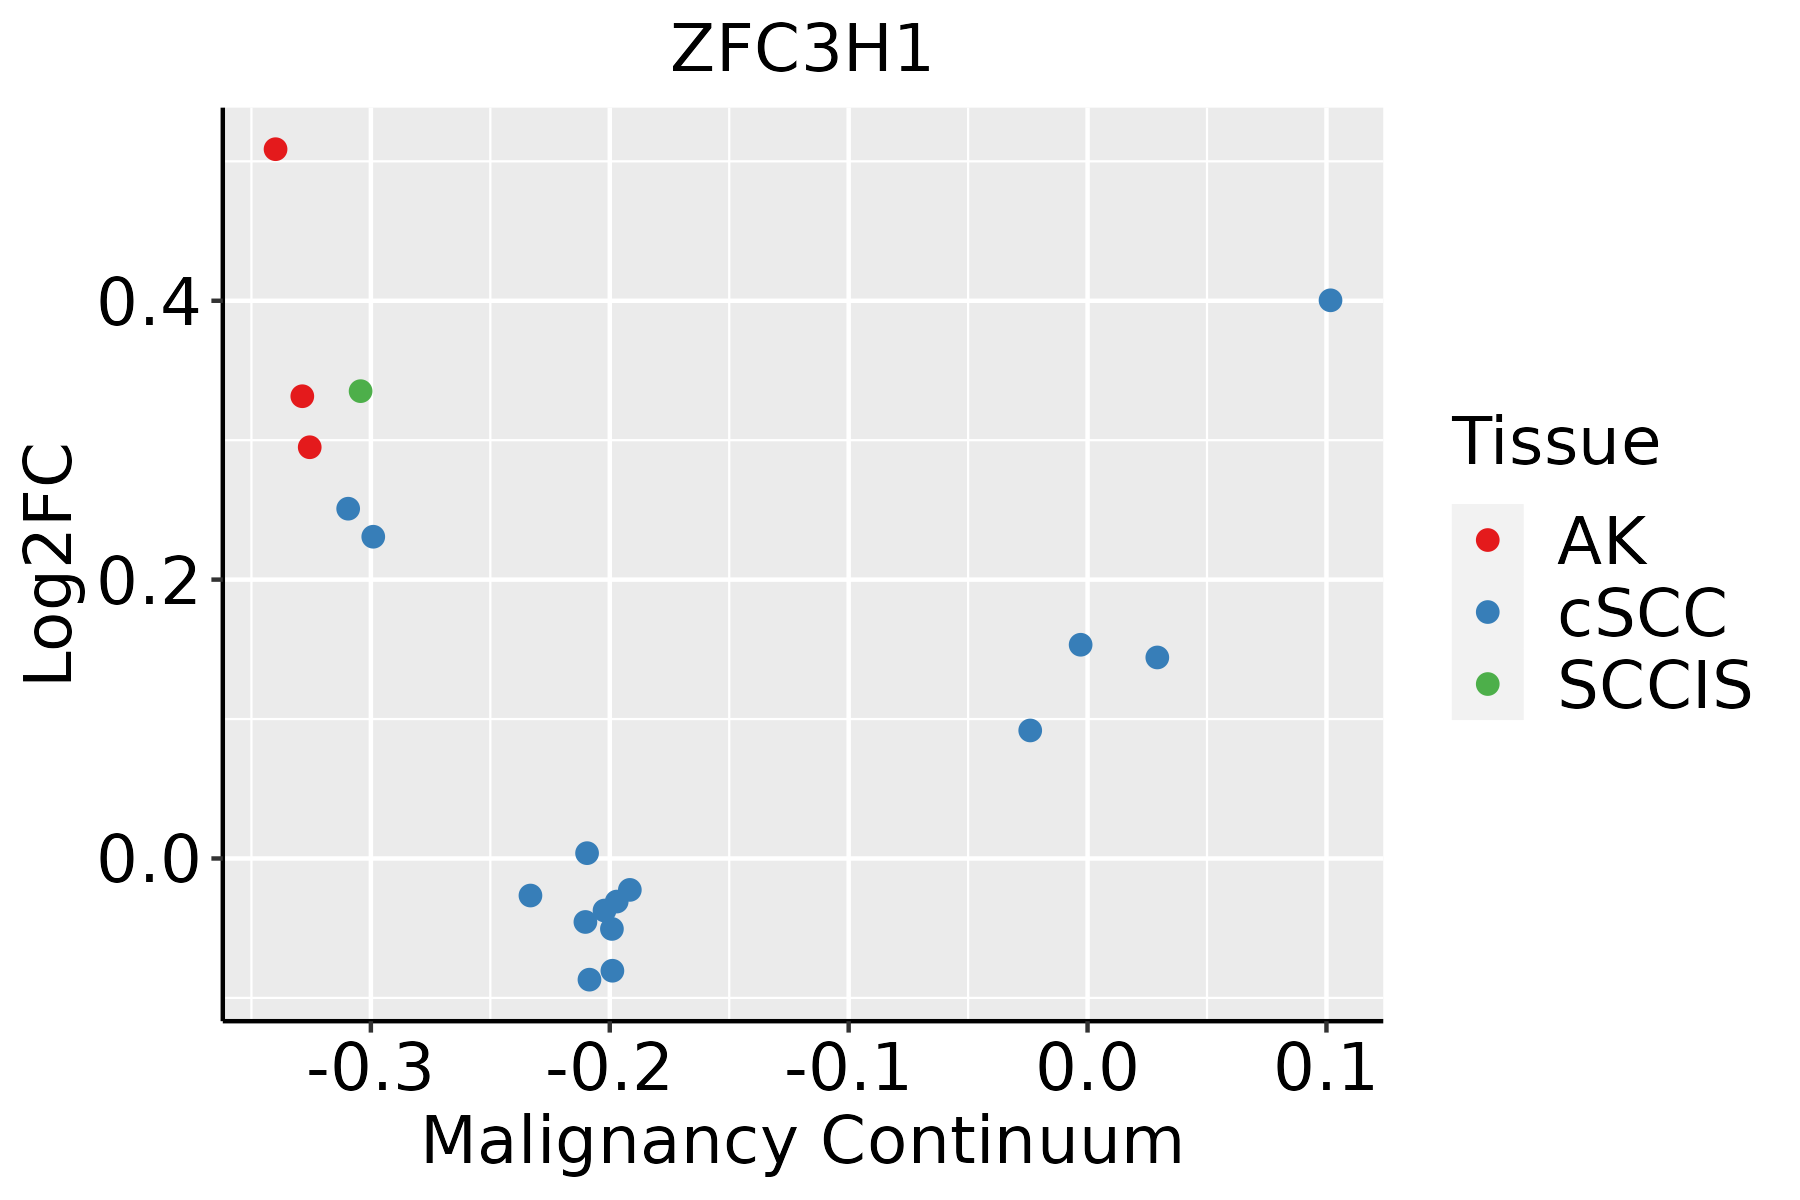 | AK: Actinic keratosis |
| cSCC: Cutaneous squamous cell carcinoma | ||
| SCCIS:squamous cell carcinoma in situ | ||
| Thyroid |  | ATC: Anaplastic thyroid cancer |
| HT: Hashimoto's thyroiditis | ||
| PTC: Papillary thyroid cancer |
| ∗log2FC in expression of this searched gene in stem-like cells from each diseased tissue sample relative to stem-like cells in normal samples in each tissue plotted against the malignancy continuum. Samples are colored based on if they are from different disease stage. |
Top |
Malignant transformation related pathway analysis |
| Find out the enriched GO biological processes and KEGG pathways involved in transition from healthy to precancer to cancer |
| Tissue | Disease Stage | Enriched GO biological Processes |
| Colorectum | AD |  |
| Colorectum | SER |  |
| Colorectum | MSS |  |
| Colorectum | MSI-H |  |
| Colorectum | FAP |  |
| ∗Top 15 enriched GO BP terms are showed in the bar plot of each disease state in each tissue. Each row represents a significant GO biological process which is colored according to the -log10(p.adjust). |
| Page: 1 2 3 4 5 6 7 8 9 |
| GO ID | Tissue | Disease Stage | Description | Gene Ratio | Bg Ratio | pvalue | p.adjust | Count |
| Page: 1 |
| Pathway ID | Tissue | Disease Stage | Description | Gene Ratio | Bg Ratio | pvalue | p.adjust | qvalue | Count |
| Page: 1 |
Top |
Cell-cell communication analysis |
| Identification of potential cell-cell interactions between two cell types and their ligand-receptor pairs for different disease states |
| Ligand | Receptor | LRpair | Pathway | Tissue | Disease Stage |
| Page: 1 |
Top |
Single-cell gene regulatory network inference analysis |
| Find out the significant the regulons (TFs) and the target genes of each regulon across cell types for different disease states |
| TF | Cell Type | Tissue | Disease Stage | Target Gene | RSS | Regulon Activity |
| ∗The dot plots of a searched regulon are shown for all cell subpopulations in each disease state of each tissue based on the regulon specific score inferred using pySCENIC and by calculating the average expression. |
| Page: 1 |
Top |
Somatic mutation of malignant transformation related genes |
| Annotation of somatic variants for genes involved in malignant transformation |
| Hugo Symbol | Variant Class | Variant Classification | dbSNP RS | HGVSc | HGVSp | HGVSp Short | SWISSPROT | BIOTYPE | SIFT | PolyPhen | Tumor Sample Barcode | Tissue | Histology | Sex | Age | Stage | Therapy Types | Drugs | Outcome |
| ZFC3H1 | SNV | Missense_Mutation | c.2674N>G | p.Leu892Val | p.L892V | O60293 | protein_coding | deleterious(0.01) | benign(0.086) | TCGA-A2-A0YT-01 | Breast | breast invasive carcinoma | Female | <65 | III/IV | Hormone Therapy | arimidex | SD | |
| ZFC3H1 | SNV | Missense_Mutation | c.1441C>A | p.Gln481Lys | p.Q481K | O60293 | protein_coding | deleterious(0.03) | probably_damaging(0.931) | TCGA-A2-A1FV-01 | Breast | breast invasive carcinoma | Female | >=65 | I/II | Chemotherapy | cyclophosphamide | SD | |
| ZFC3H1 | SNV | Missense_Mutation | rs749001333 | c.1646N>A | p.Pro549Gln | p.P549Q | O60293 | protein_coding | deleterious(0.04) | benign(0.003) | TCGA-A8-A075-01 | Breast | breast invasive carcinoma | Female | <65 | I/II | Chemotherapy | epirubicin | CR |
| ZFC3H1 | SNV | Missense_Mutation | rs78101876 | c.1644N>C | p.Gln548His | p.Q548H | O60293 | protein_coding | tolerated(0.49) | benign(0.012) | TCGA-A8-A095-01 | Breast | breast invasive carcinoma | Female | <65 | I/II | Chemotherapy | 5-fluorouracil | CR |
| ZFC3H1 | SNV | Missense_Mutation | c.5620G>A | p.Ala1874Thr | p.A1874T | O60293 | protein_coding | tolerated(0.11) | possibly_damaging(0.867) | TCGA-AN-A0AK-01 | Breast | breast invasive carcinoma | Female | >=65 | I/II | Unknown | Unknown | SD | |
| ZFC3H1 | SNV | Missense_Mutation | c.384T>G | p.Ser128Arg | p.S128R | O60293 | protein_coding | deleterious(0.03) | benign(0) | TCGA-AN-A0FX-01 | Breast | breast invasive carcinoma | Female | <65 | I/II | Unknown | Unknown | SD | |
| ZFC3H1 | SNV | Missense_Mutation | c.2807N>G | p.Asp936Gly | p.D936G | O60293 | protein_coding | tolerated(0.33) | benign(0) | TCGA-AR-A0TX-01 | Breast | breast invasive carcinoma | Female | <65 | I/II | Unknown | Unknown | SD | |
| ZFC3H1 | SNV | Missense_Mutation | c.5507N>T | p.Asn1836Ile | p.N1836I | O60293 | protein_coding | deleterious(0.01) | benign(0.425) | TCGA-B6-A0RP-01 | Breast | breast invasive carcinoma | Female | >=65 | I/II | Unknown | Unknown | PD | |
| ZFC3H1 | SNV | Missense_Mutation | novel | c.272A>T | p.His91Leu | p.H91L | O60293 | protein_coding | deleterious_low_confidence(0.04) | benign(0.039) | TCGA-B6-A0WX-01 | Breast | breast invasive carcinoma | Female | <65 | III/IV | Unknown | Unknown | PD |
| ZFC3H1 | SNV | Missense_Mutation | novel | c.2810N>T | p.Arg937Leu | p.R937L | O60293 | protein_coding | tolerated(0.73) | benign(0.048) | TCGA-BH-A5J0-01 | Breast | breast invasive carcinoma | Female | <65 | I/II | Unknown | Unknown | SD |
| Page: 1 2 3 4 5 6 7 8 9 10 11 12 13 14 15 16 17 18 19 20 21 |
Top |
Related drugs of malignant transformation related genes |
| Identification of chemicals and drugs interact with genes involved in malignant transfromation |
| (DGIdb 4.0) |
| Entrez ID | Symbol | Category | Interaction Types | Drug Claim Name | Drug Name | PMIDs |
| Page: 1 |

Copyright 2023-Present -The University of Texas Health Science Center at Houston |