
|
|||||
|
 | |
| |
| |
| |
| |
| |
|
Gene: ZFAND6 |
Gene summary for ZFAND6 |
| Gene information | Species | Human | Gene symbol | ZFAND6 | Gene ID | 54469 |
| Gene name | zinc finger AN1-type containing 6 | |
| Gene Alias | AWP1 | |
| Cytomap | 15q25.1 | |
| Gene Type | protein-coding | GO ID | GO:0006605 | UniProtAcc | Q6FIF0 |
Top |
Malignant transformation analysis |
| Identification of the aberrant gene expression in precancerous and cancerous lesions by comparing the gene expression of stem-like cells in diseased tissues with normal stem cells |
| Entrez ID | Symbol | Replicates | Species | Organ | Tissue | Adj P-value | Log2FC | Malignancy |
| 54469 | ZFAND6 | CCI_2 | Human | Cervix | CC | 1.87e-04 | 7.26e-01 | 0.5249 |
| 54469 | ZFAND6 | HTA11_3410_2000001011 | Human | Colorectum | AD | 7.25e-18 | -6.52e-01 | 0.0155 |
| 54469 | ZFAND6 | HTA11_2487_2000001011 | Human | Colorectum | SER | 3.45e-04 | -4.92e-01 | -0.1808 |
| 54469 | ZFAND6 | HTA11_2951_2000001011 | Human | Colorectum | AD | 2.90e-02 | -7.48e-01 | 0.0216 |
| 54469 | ZFAND6 | HTA11_3361_2000001011 | Human | Colorectum | AD | 7.33e-05 | -5.91e-01 | -0.1207 |
| 54469 | ZFAND6 | HTA11_696_2000001011 | Human | Colorectum | AD | 7.14e-10 | -4.22e-01 | -0.1464 |
| 54469 | ZFAND6 | HTA11_866_2000001011 | Human | Colorectum | AD | 9.18e-16 | -4.67e-01 | -0.1001 |
| 54469 | ZFAND6 | HTA11_1391_2000001011 | Human | Colorectum | AD | 3.52e-02 | -4.43e-01 | -0.059 |
| 54469 | ZFAND6 | HTA11_866_3004761011 | Human | Colorectum | AD | 6.98e-07 | -5.39e-01 | 0.096 |
| 54469 | ZFAND6 | HTA11_9408_2000001011 | Human | Colorectum | AD | 1.53e-02 | -8.37e-01 | 0.0451 |
| 54469 | ZFAND6 | HTA11_10711_2000001011 | Human | Colorectum | AD | 3.26e-07 | -5.77e-01 | 0.0338 |
| 54469 | ZFAND6 | HTA11_7696_3000711011 | Human | Colorectum | AD | 1.07e-16 | -5.12e-01 | 0.0674 |
| 54469 | ZFAND6 | HTA11_99999970781_79442 | Human | Colorectum | MSS | 7.41e-03 | -3.25e-01 | 0.294 |
| 54469 | ZFAND6 | HTA11_99999971662_82457 | Human | Colorectum | MSS | 5.26e-25 | -6.01e-01 | 0.3859 |
| 54469 | ZFAND6 | HTA11_99999973899_84307 | Human | Colorectum | MSS | 4.44e-02 | -5.70e-01 | 0.2585 |
| 54469 | ZFAND6 | HTA11_99999974143_84620 | Human | Colorectum | MSS | 3.00e-13 | -4.56e-01 | 0.3005 |
| 54469 | ZFAND6 | A001-C-207 | Human | Colorectum | FAP | 5.62e-07 | -4.28e-01 | 0.1278 |
| 54469 | ZFAND6 | A015-C-203 | Human | Colorectum | FAP | 1.82e-34 | -5.57e-01 | -0.1294 |
| 54469 | ZFAND6 | A015-C-204 | Human | Colorectum | FAP | 2.93e-07 | -3.89e-01 | -0.0228 |
| 54469 | ZFAND6 | A014-C-040 | Human | Colorectum | FAP | 2.03e-04 | -3.56e-01 | -0.1184 |
| Page: 1 2 3 4 5 6 7 8 9 10 |
| Tissue | Expression Dynamics | Abbreviation |
| Cervix | 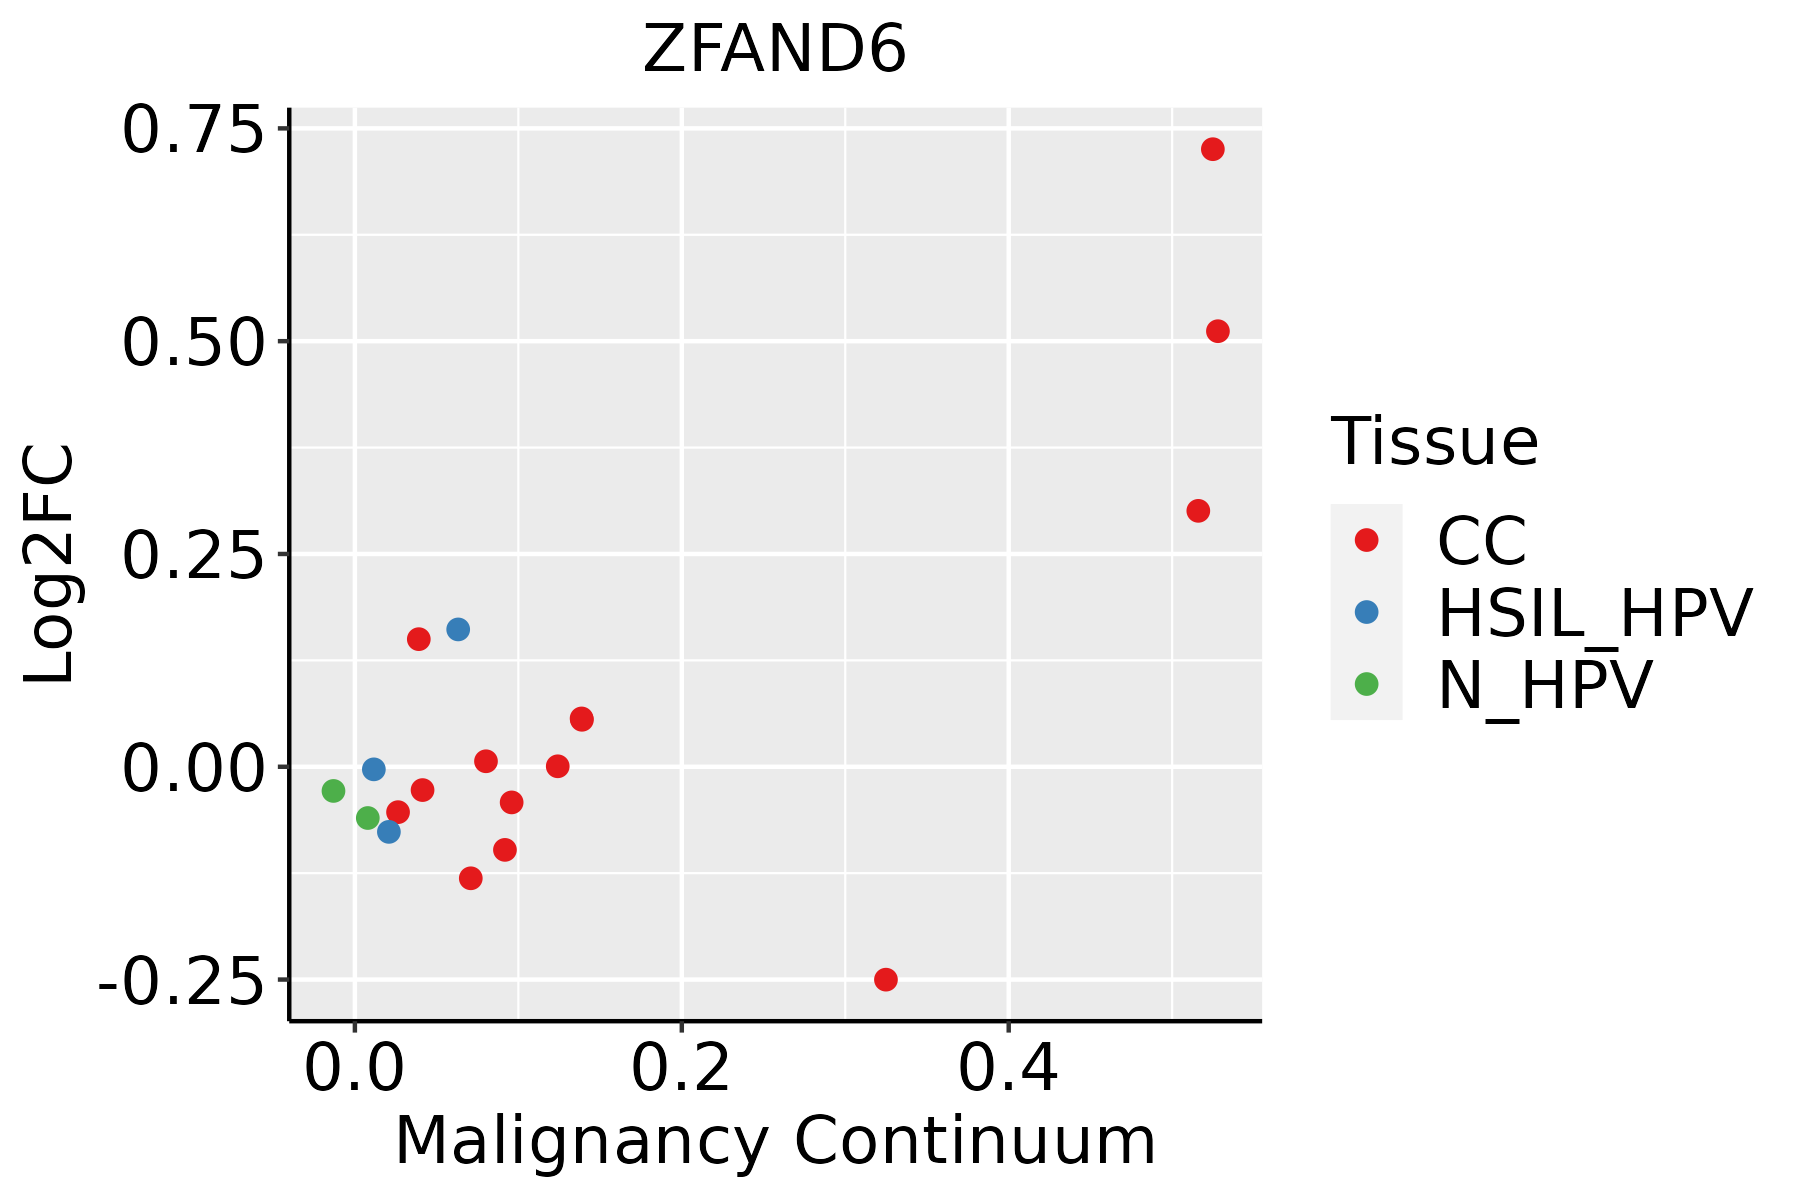 | CC: Cervix cancer |
| HSIL_HPV: HPV-infected high-grade squamous intraepithelial lesions | ||
| N_HPV: HPV-infected normal cervix | ||
| Colorectum (GSE201348) | 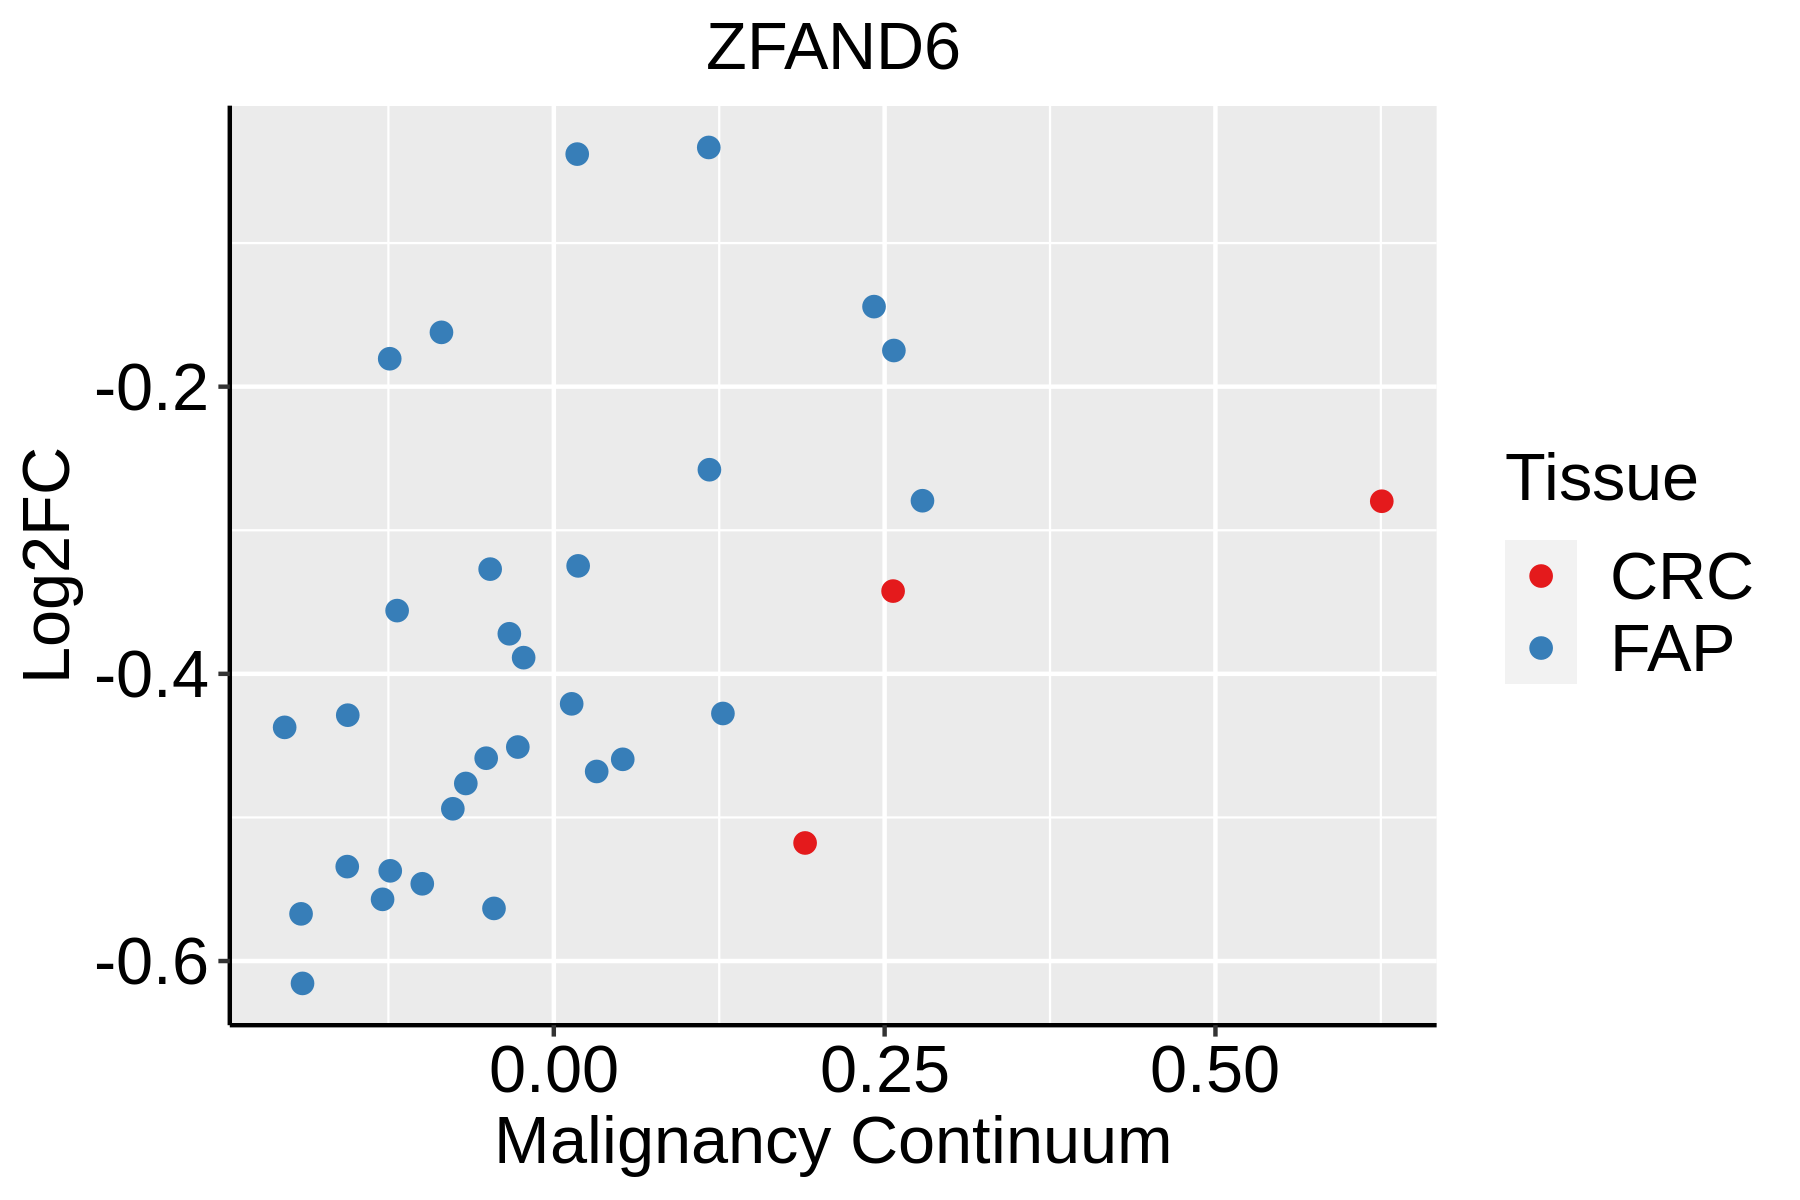 | FAP: Familial adenomatous polyposis |
| CRC: Colorectal cancer | ||
| Colorectum (HTA11) |  | AD: Adenomas |
| SER: Sessile serrated lesions | ||
| MSI-H: Microsatellite-high colorectal cancer | ||
| MSS: Microsatellite stable colorectal cancer | ||
| Esophagus | 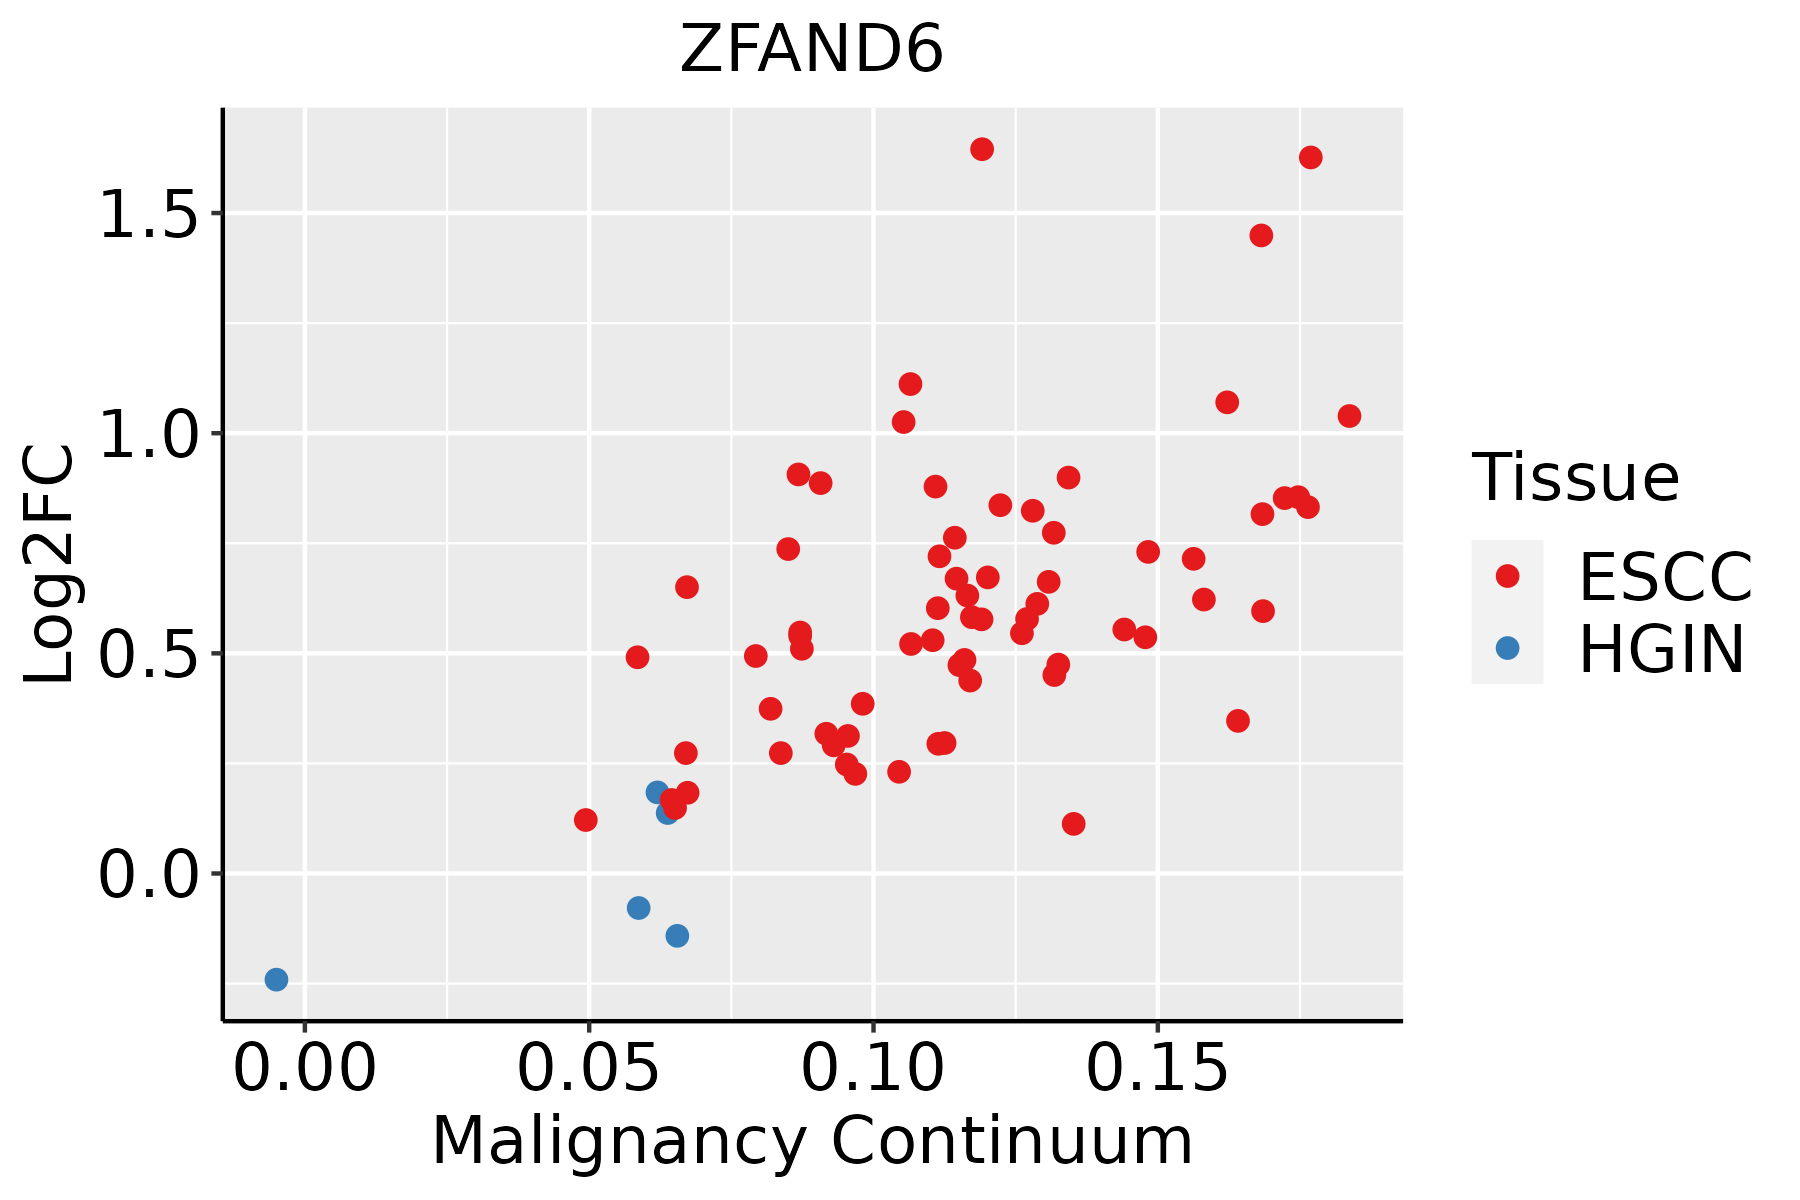 | ESCC: Esophageal squamous cell carcinoma |
| HGIN: High-grade intraepithelial neoplasias | ||
| LGIN: Low-grade intraepithelial neoplasias | ||
| Liver | 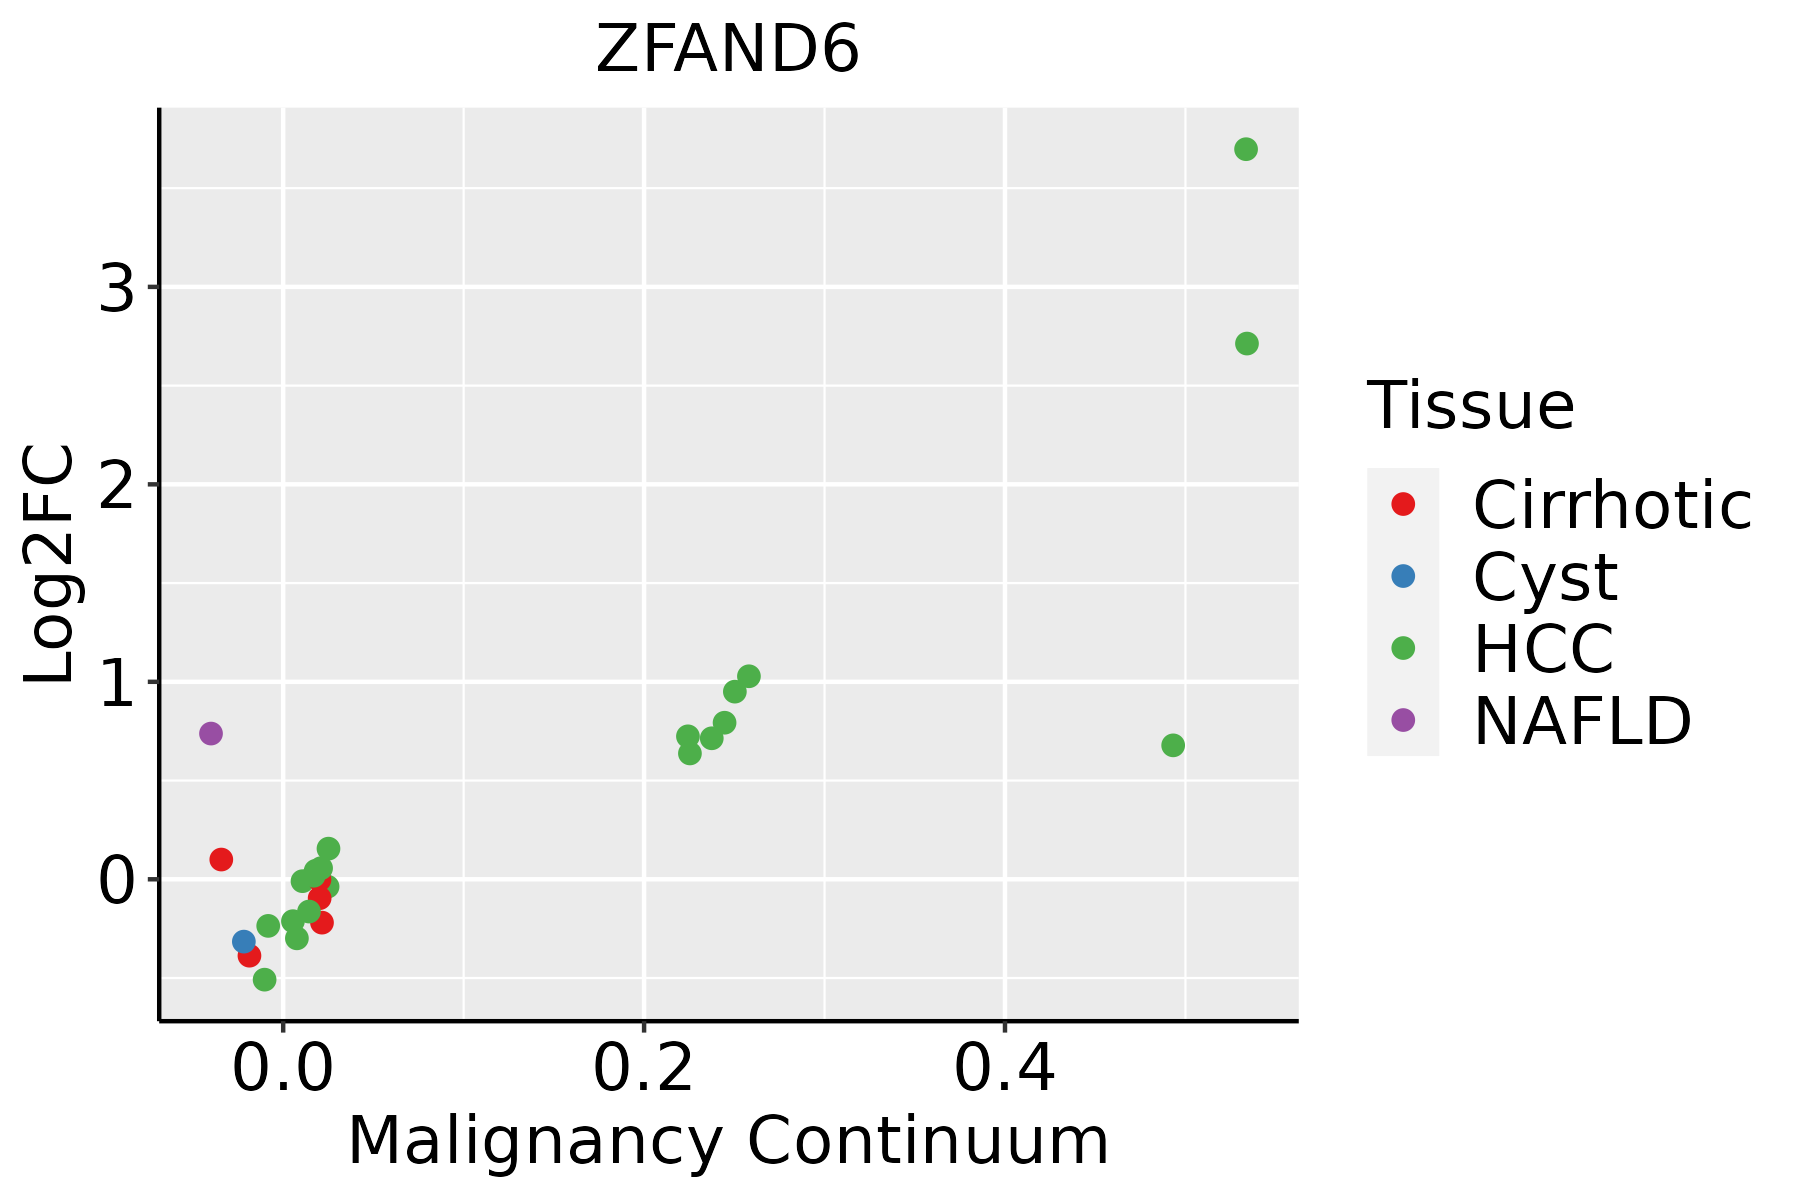 | HCC: Hepatocellular carcinoma |
| NAFLD: Non-alcoholic fatty liver disease | ||
| Lung | 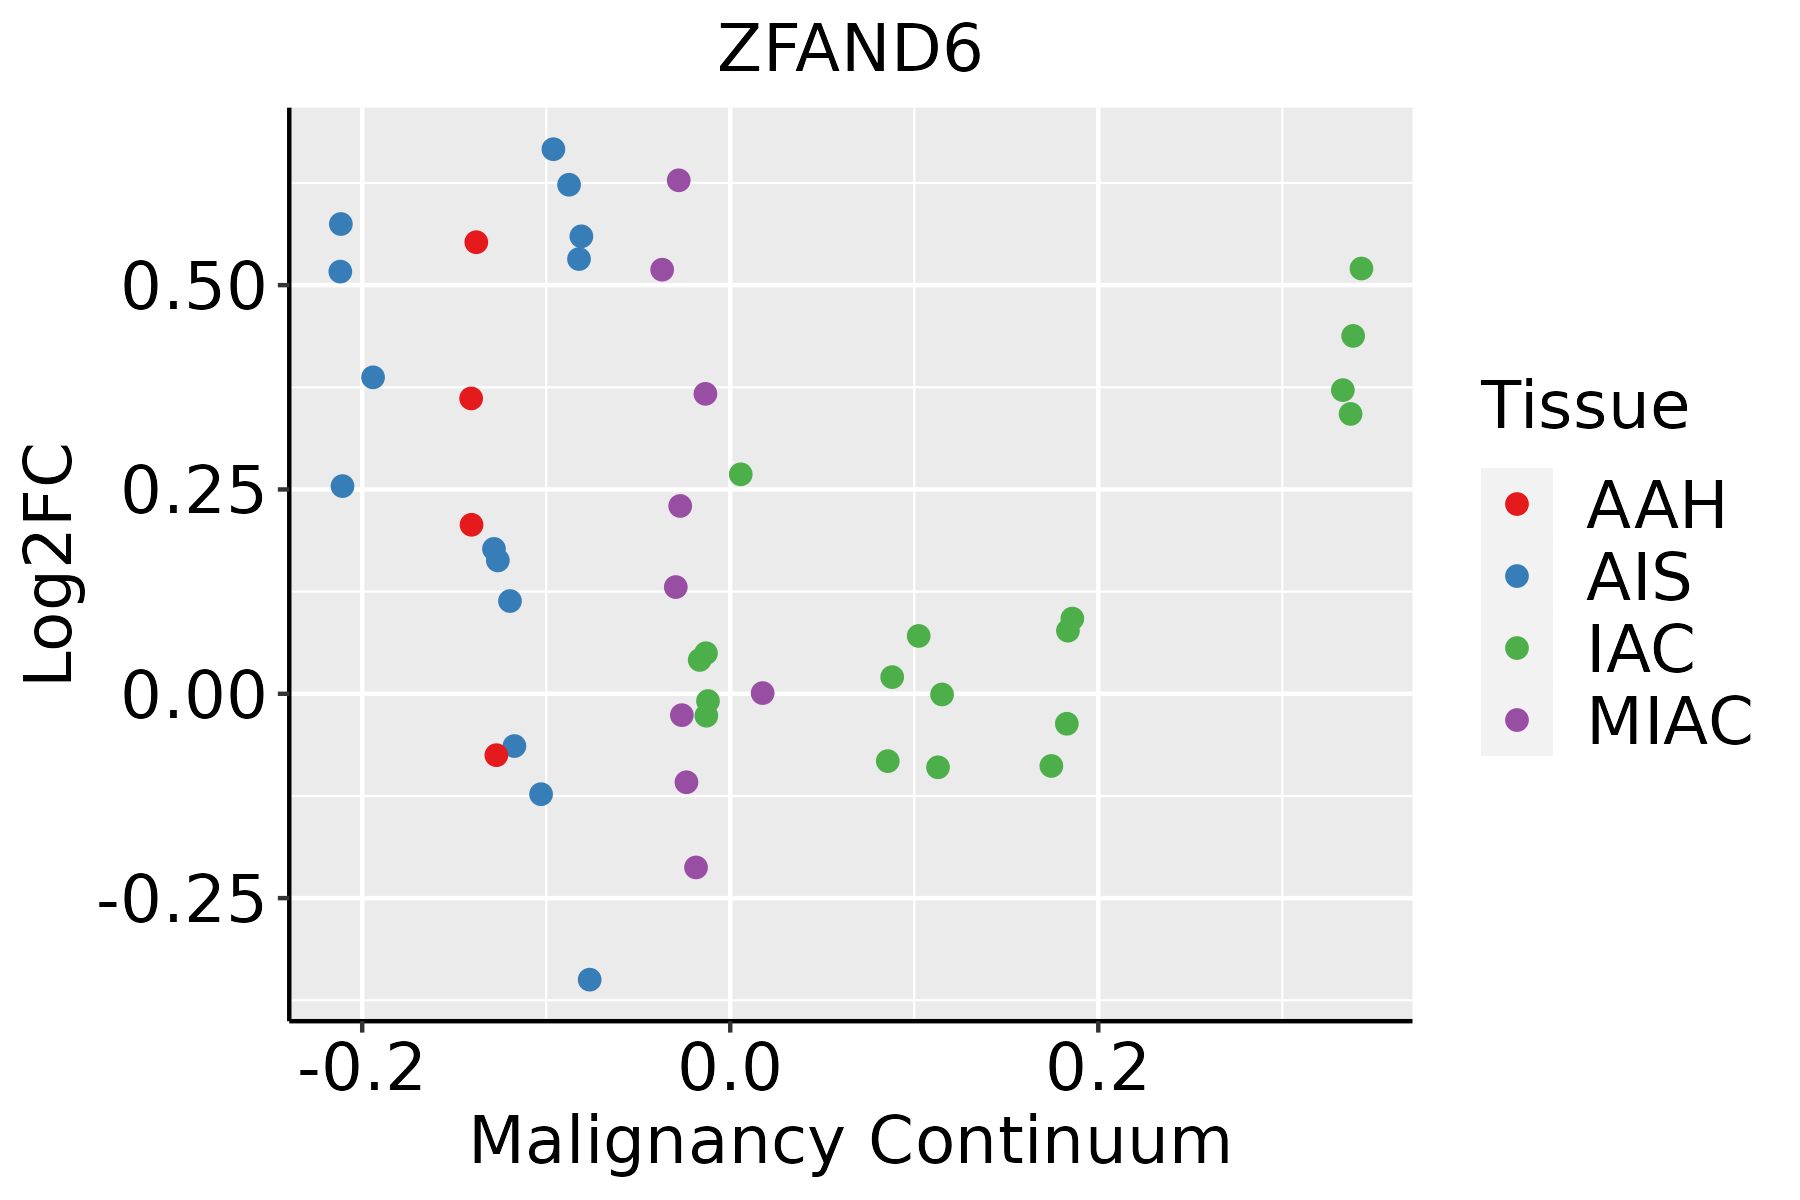 | AAH: Atypical adenomatous hyperplasia |
| AIS: Adenocarcinoma in situ | ||
| IAC: Invasive lung adenocarcinoma | ||
| MIA: Minimally invasive adenocarcinoma | ||
| Oral Cavity | 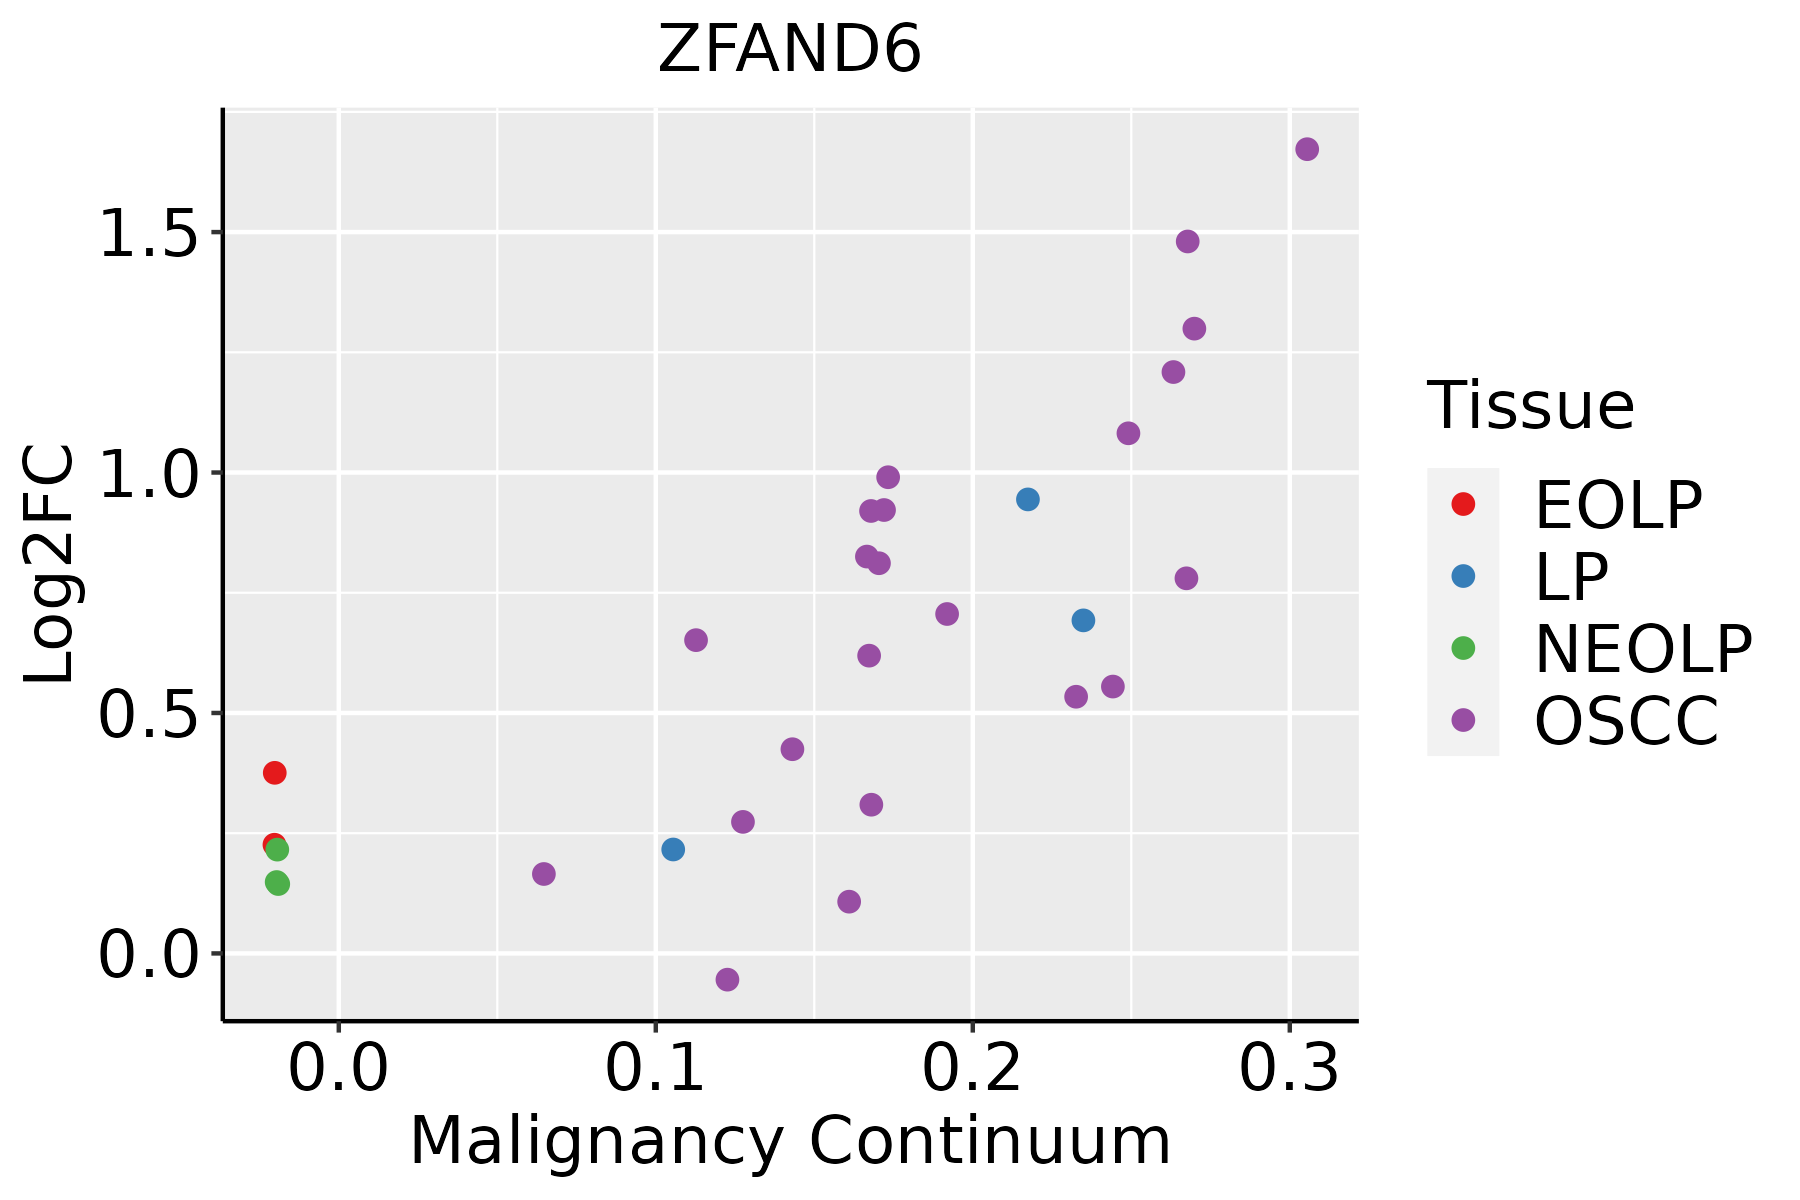 | EOLP: Erosive Oral lichen planus |
| LP: leukoplakia | ||
| NEOLP: Non-erosive oral lichen planus | ||
| OSCC: Oral squamous cell carcinoma | ||
| Skin | 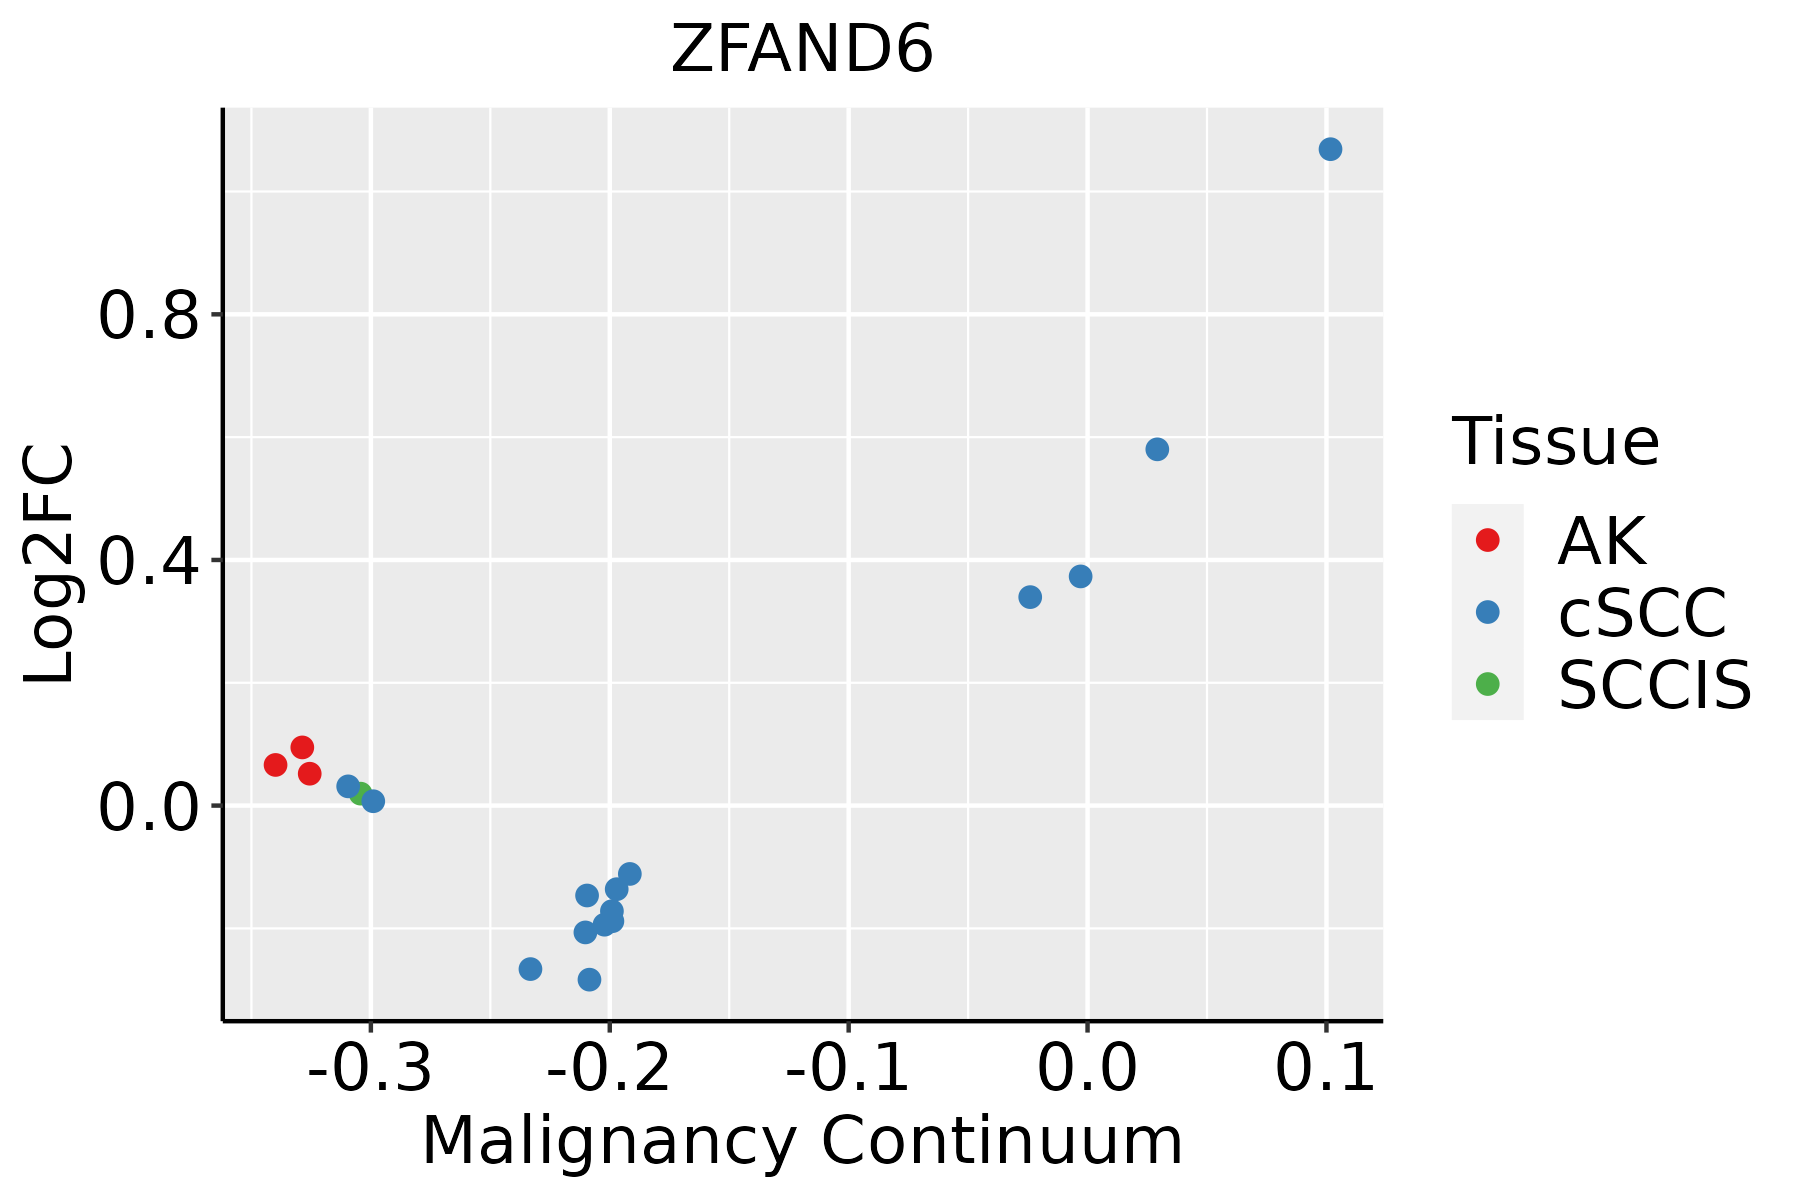 | AK: Actinic keratosis |
| cSCC: Cutaneous squamous cell carcinoma | ||
| SCCIS:squamous cell carcinoma in situ | ||
| Thyroid | 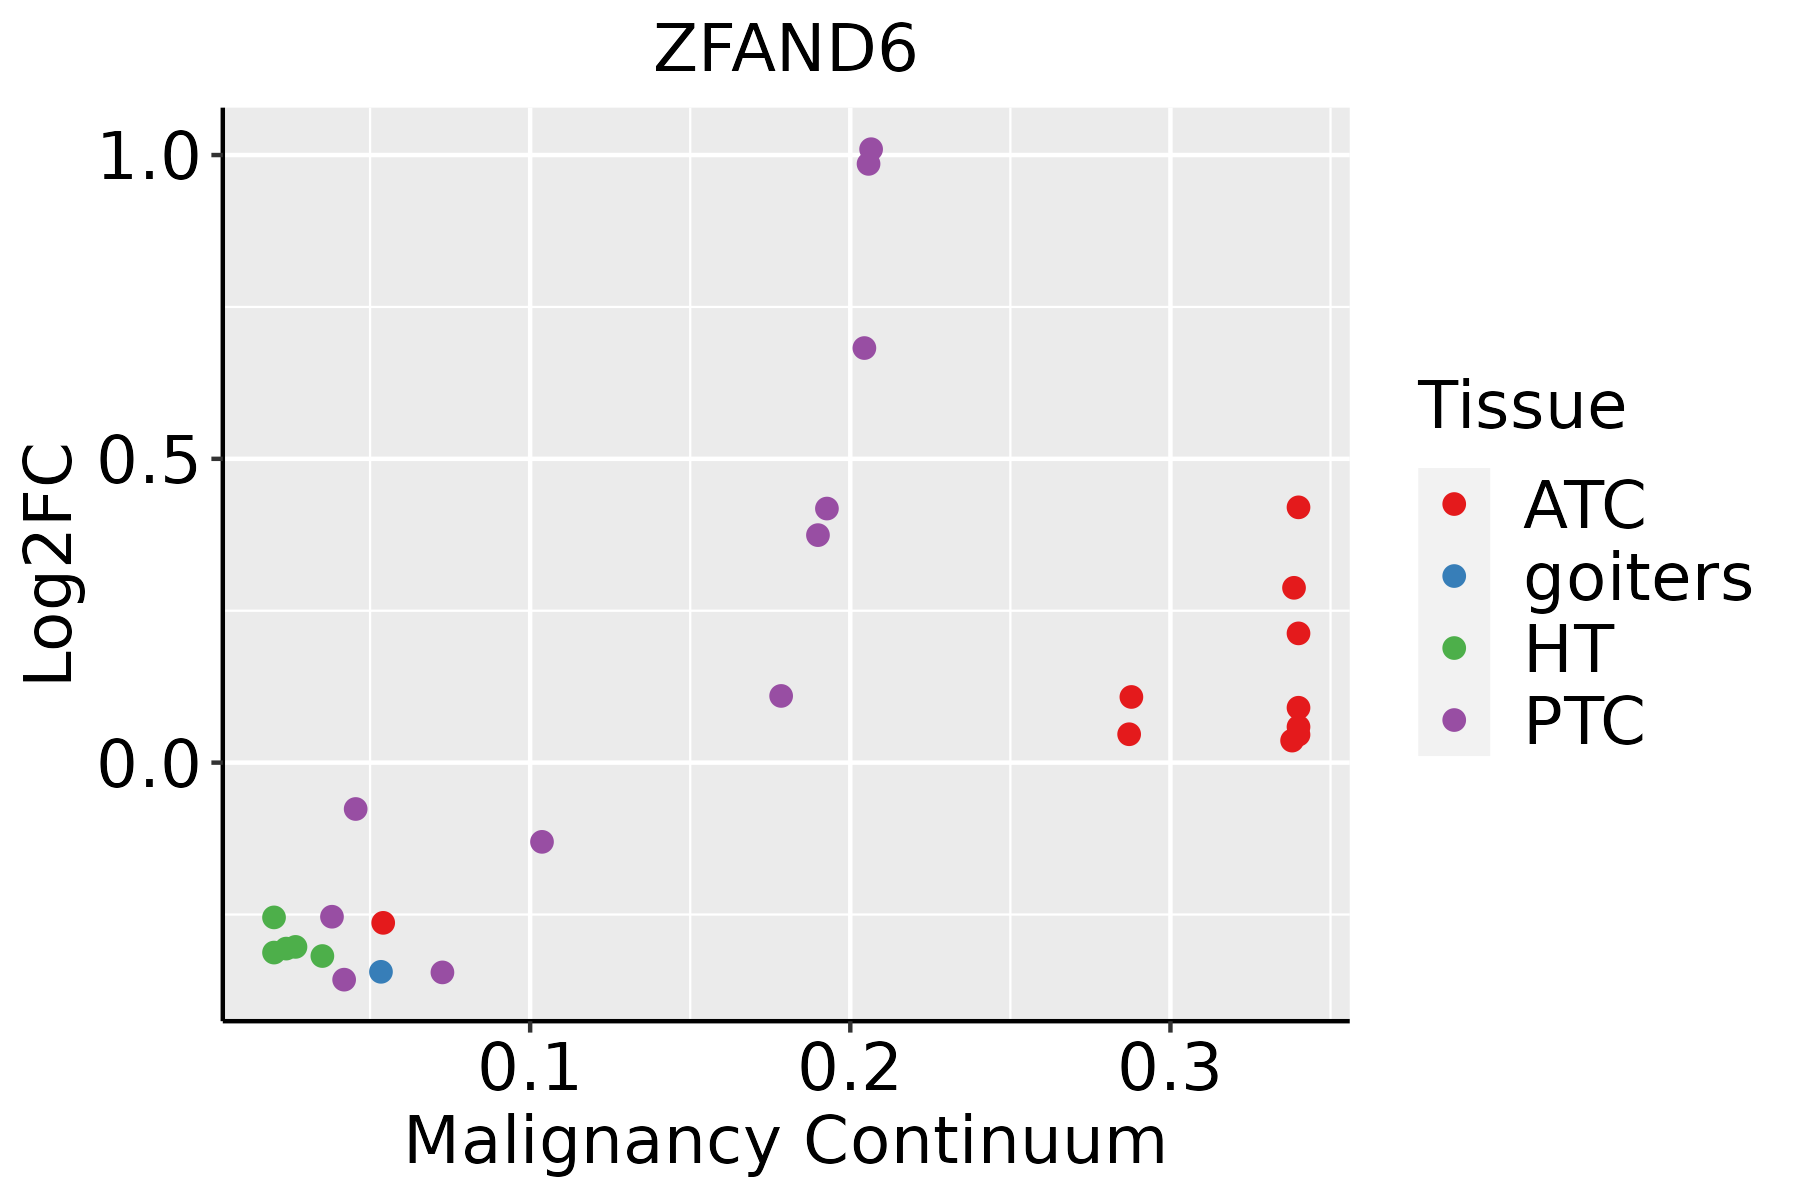 | ATC: Anaplastic thyroid cancer |
| HT: Hashimoto's thyroiditis | ||
| PTC: Papillary thyroid cancer |
| ∗log2FC in expression of this searched gene in stem-like cells from each diseased tissue sample relative to stem-like cells in normal samples in each tissue plotted against the malignancy continuum. Samples are colored based on if they are from different disease stage. |
Top |
Malignant transformation related pathway analysis |
| Find out the enriched GO biological processes and KEGG pathways involved in transition from healthy to precancer to cancer |
| Tissue | Disease Stage | Enriched GO biological Processes |
| Colorectum | AD |  |
| Colorectum | SER |  |
| Colorectum | MSS |  |
| Colorectum | MSI-H |  |
| Colorectum | FAP |  |
| ∗Top 15 enriched GO BP terms are showed in the bar plot of each disease state in each tissue. Each row represents a significant GO biological process which is colored according to the -log10(p.adjust). |
| Page: 1 2 3 4 5 6 7 8 9 |
| GO ID | Tissue | Disease Stage | Description | Gene Ratio | Bg Ratio | pvalue | p.adjust | Count |
| GO:00725949 | Cervix | CC | establishment of protein localization to organelle | 99/2311 | 422/18723 | 1.23e-10 | 2.11e-08 | 99 |
| GO:000660510 | Cervix | CC | protein targeting | 68/2311 | 314/18723 | 2.17e-06 | 6.55e-05 | 68 |
| GO:00346129 | Cervix | CC | response to tumor necrosis factor | 55/2311 | 253/18723 | 1.75e-05 | 3.32e-04 | 55 |
| GO:00713569 | Cervix | CC | cellular response to tumor necrosis factor | 51/2311 | 229/18723 | 1.75e-05 | 3.32e-04 | 51 |
| GO:00431228 | Cervix | CC | regulation of I-kappaB kinase/NF-kappaB signaling | 53/2311 | 249/18723 | 4.50e-05 | 6.87e-04 | 53 |
| GO:00072497 | Cervix | CC | I-kappaB kinase/NF-kappaB signaling | 56/2311 | 281/18723 | 1.81e-04 | 2.12e-03 | 56 |
| GO:0072594 | Colorectum | AD | establishment of protein localization to organelle | 148/3918 | 422/18723 | 7.95e-12 | 1.04e-09 | 148 |
| GO:0006605 | Colorectum | AD | protein targeting | 105/3918 | 314/18723 | 1.39e-07 | 6.44e-06 | 105 |
| GO:0043122 | Colorectum | AD | regulation of I-kappaB kinase/NF-kappaB signaling | 76/3918 | 249/18723 | 2.17e-04 | 2.85e-03 | 76 |
| GO:0007249 | Colorectum | AD | I-kappaB kinase/NF-kappaB signaling | 82/3918 | 281/18723 | 6.09e-04 | 6.40e-03 | 82 |
| GO:00725941 | Colorectum | SER | establishment of protein localization to organelle | 111/2897 | 422/18723 | 4.98e-09 | 4.49e-07 | 111 |
| GO:00066051 | Colorectum | SER | protein targeting | 76/2897 | 314/18723 | 3.19e-05 | 8.47e-04 | 76 |
| GO:00725942 | Colorectum | MSS | establishment of protein localization to organelle | 139/3467 | 422/18723 | 5.75e-13 | 1.12e-10 | 139 |
| GO:00066052 | Colorectum | MSS | protein targeting | 97/3467 | 314/18723 | 6.76e-08 | 3.46e-06 | 97 |
| GO:00431221 | Colorectum | MSS | regulation of I-kappaB kinase/NF-kappaB signaling | 71/3467 | 249/18723 | 7.12e-05 | 1.21e-03 | 71 |
| GO:00072491 | Colorectum | MSS | I-kappaB kinase/NF-kappaB signaling | 77/3467 | 281/18723 | 1.51e-04 | 2.19e-03 | 77 |
| GO:00725944 | Colorectum | FAP | establishment of protein localization to organelle | 96/2622 | 422/18723 | 6.63e-07 | 3.20e-05 | 96 |
| GO:00066054 | Colorectum | FAP | protein targeting | 74/2622 | 314/18723 | 3.21e-06 | 1.17e-04 | 74 |
| GO:00431222 | Colorectum | FAP | regulation of I-kappaB kinase/NF-kappaB signaling | 56/2622 | 249/18723 | 1.82e-04 | 2.69e-03 | 56 |
| GO:00072492 | Colorectum | FAP | I-kappaB kinase/NF-kappaB signaling | 58/2622 | 281/18723 | 1.37e-03 | 1.24e-02 | 58 |
| Page: 1 2 3 4 5 6 |
| Pathway ID | Tissue | Disease Stage | Description | Gene Ratio | Bg Ratio | pvalue | p.adjust | qvalue | Count |
| Page: 1 |
Top |
Cell-cell communication analysis |
| Identification of potential cell-cell interactions between two cell types and their ligand-receptor pairs for different disease states |
| Ligand | Receptor | LRpair | Pathway | Tissue | Disease Stage |
| Page: 1 |
Top |
Single-cell gene regulatory network inference analysis |
| Find out the significant the regulons (TFs) and the target genes of each regulon across cell types for different disease states |
| TF | Cell Type | Tissue | Disease Stage | Target Gene | RSS | Regulon Activity |
| ∗The dot plots of a searched regulon are shown for all cell subpopulations in each disease state of each tissue based on the regulon specific score inferred using pySCENIC and by calculating the average expression. |
| Page: 1 |
Top |
Somatic mutation of malignant transformation related genes |
| Annotation of somatic variants for genes involved in malignant transformation |
| Hugo Symbol | Variant Class | Variant Classification | dbSNP RS | HGVSc | HGVSp | HGVSp Short | SWISSPROT | BIOTYPE | SIFT | PolyPhen | Tumor Sample Barcode | Tissue | Histology | Sex | Age | Stage | Therapy Types | Drugs | Outcome |
| ZFAND6 | SNV | Missense_Mutation | rs12890 | c.607N>A | p.Glu203Lys | p.E203K | Q6FIF0 | protein_coding | deleterious(0) | probably_damaging(0.98) | TCGA-C5-A2LZ-01 | Cervix | cervical & endocervical cancer | Female | >=65 | III/IV | Unknown | Unknown | PD |
| ZFAND6 | SNV | Missense_Mutation | novel | c.71C>T | p.Pro24Leu | p.P24L | Q6FIF0 | protein_coding | deleterious(0) | probably_damaging(0.999) | TCGA-AX-A2IN-01 | Endometrium | uterine corpus endometrioid carcinoma | Female | <65 | I/II | Unknown | Unknown | PD |
| ZFAND6 | SNV | Missense_Mutation | novel | c.557N>C | p.Lys186Thr | p.K186T | Q6FIF0 | protein_coding | deleterious(0) | probably_damaging(0.998) | TCGA-D1-A16X-01 | Endometrium | uterine corpus endometrioid carcinoma | Female | <65 | I/II | Unknown | Unknown | SD |
| ZFAND6 | SNV | Missense_Mutation | c.569C>T | p.Ala190Val | p.A190V | Q6FIF0 | protein_coding | deleterious(0) | probably_damaging(0.985) | TCGA-D1-A177-01 | Endometrium | uterine corpus endometrioid carcinoma | Female | >=65 | I/II | Unknown | Unknown | PD | |
| ZFAND6 | SNV | Missense_Mutation | rs773057418 | c.442N>T | p.Arg148Cys | p.R148C | Q6FIF0 | protein_coding | deleterious(0.02) | probably_damaging(0.99) | TCGA-EO-A22U-01 | Endometrium | uterine corpus endometrioid carcinoma | Female | >=65 | I/II | Unknown | Unknown | SD |
| ZFAND6 | SNV | Missense_Mutation | novel | c.149C>A | p.Pro50Gln | p.P50Q | Q6FIF0 | protein_coding | deleterious(0) | probably_damaging(0.996) | TCGA-05-4396-01 | Lung | lung adenocarcinoma | Male | >=65 | III/IV | Unknown | Unknown | SD |
| ZFAND6 | SNV | Missense_Mutation | c.379N>G | p.Thr127Ala | p.T127A | Q6FIF0 | protein_coding | tolerated(0.39) | benign(0.01) | TCGA-78-7220-01 | Lung | lung adenocarcinoma | Female | <65 | III/IV | Unknown | Unknown | PD | |
| ZFAND6 | SNV | Missense_Mutation | c.283C>T | p.Leu95Phe | p.L95F | Q6FIF0 | protein_coding | tolerated(0.27) | probably_damaging(0.991) | TCGA-18-3409-01 | Lung | lung squamous cell carcinoma | Male | >=65 | I/II | Unknown | Unknown | PD | |
| ZFAND6 | SNV | Missense_Mutation | novel | c.271N>C | p.Ser91Pro | p.S91P | Q6FIF0 | protein_coding | tolerated(0.2) | benign(0.003) | TCGA-22-1016-01 | Lung | lung squamous cell carcinoma | Male | >=65 | I/II | Unknown | Unknown | SD |
| ZFAND6 | SNV | Missense_Mutation | c.379A>G | p.Thr127Ala | p.T127A | Q6FIF0 | protein_coding | tolerated(0.39) | benign(0.01) | TCGA-56-6545-01 | Lung | lung squamous cell carcinoma | Female | >=65 | I/II | Unknown | Unknown | SD |
| Page: 1 2 |
Top |
Related drugs of malignant transformation related genes |
| Identification of chemicals and drugs interact with genes involved in malignant transfromation |
| (DGIdb 4.0) |
| Entrez ID | Symbol | Category | Interaction Types | Drug Claim Name | Drug Name | PMIDs |
| Page: 1 |

Copyright 2023-Present -The University of Texas Health Science Center at Houston |