Schematic overview of the cellular and molecular mechanisms involved in the cancer progression, including the proposed cellular and molecular mechanisms in cancer cells trajectory. AT1: alveolar type 1 cells; AT2: alveolar type 2 cells; AAH: atypical adenomatous hyperplasia; AIS: adenocarcinoma in situ; MIA: minimally invasive adenocarcinoma; IA: invasive adenocarcinoma; EMT: epithelial-mesenchymal transition

Home

Download

Statistics

Help

Contact

Center for Computational Systems Medicine
leaf

Gene summary

leaf

Malignant transformation analysis

leaf

Malignant transformation related pathway analysis

leaf

Cell-cell communication analysis

leaf

Single-cell gene regulatory network inference analysis

leaf

Somatic mutation of malignant transformation related genes

leaf

Related drugs of malignant transformation related genes

Gene: ZFAND5

Gene summary for ZFAND5

check button Gene summary.

Gene informationSpeciesHuman
Gene symbol

ZFAND5

Gene ID

7763

Gene namezinc finger AN1-type containing 5
Gene AliasZA20D2
Cytomap9q21.13
Gene Typeprotein-coding
GO ID

GO:0001501

UniProtAcc

A0A024R219


Top

Malignant transformation analysis

check button Identification of the aberrant gene expression in precancerous and cancerous lesions by comparing the gene expression of stem-like cells in diseased tissues with normal stem cells
check button Malignant transformation involving gene list.
Entrez IDSymbolReplicatesSpeciesOrganTissueAdj P-valueLog2FCMalignancy
7763ZFAND5GSM4909285HumanBreastIDC1.04e-03-4.66e-020.21
7763ZFAND5GSM4909286HumanBreastIDC2.01e-11-2.59e-010.1081
7763ZFAND5GSM4909290HumanBreastIDC2.83e-04-3.96e-010.2096
7763ZFAND5GSM4909291HumanBreastIDC5.92e-033.70e-010.1753
7763ZFAND5GSM4909294HumanBreastIDC4.58e-09-3.92e-010.2022
7763ZFAND5GSM4909296HumanBreastIDC2.91e-34-5.49e-010.1524
7763ZFAND5GSM4909297HumanBreastIDC1.17e-23-3.90e-010.1517
7763ZFAND5GSM4909298HumanBreastIDC1.66e-08-2.54e-010.1551
7763ZFAND5GSM4909301HumanBreastIDC2.94e-11-3.57e-010.1577
7763ZFAND5GSM4909302HumanBreastIDC5.01e-14-5.32e-010.1545
7763ZFAND5GSM4909304HumanBreastIDC5.07e-23-5.19e-010.1636
7763ZFAND5GSM4909306HumanBreastIDC3.28e-05-3.11e-010.1564
7763ZFAND5GSM4909307HumanBreastIDC1.05e-09-3.52e-010.1569
7763ZFAND5GSM4909309HumanBreastIDC1.52e-02-3.29e-010.0483
7763ZFAND5GSM4909311HumanBreastIDC4.27e-42-5.84e-010.1534
7763ZFAND5GSM4909312HumanBreastIDC2.73e-20-4.13e-010.1552
7763ZFAND5GSM4909315HumanBreastIDC4.21e-03-2.36e-010.21
7763ZFAND5GSM4909316HumanBreastIDC6.49e-04-5.38e-010.21
7763ZFAND5GSM4909319HumanBreastIDC2.29e-46-6.55e-010.1563
7763ZFAND5GSM4909320HumanBreastIDC8.26e-13-6.79e-010.1575
Page: 1 2 3 4 5 6 7 8 9 10 11 12 13 

check button Transcriptomic changes along malignancy continuum.
TissueExpression DynamicsAbbreviation
BreastThe image shows the transcriptomic changes along malignancy continuum.log2FC in expression of this searched gene in stem-like cells from each diseased tissue sample relative to stem-like cells in normal samples in each tissue plotted against the malignancy continuum. Samples are colored based on if they are from different disease stage.
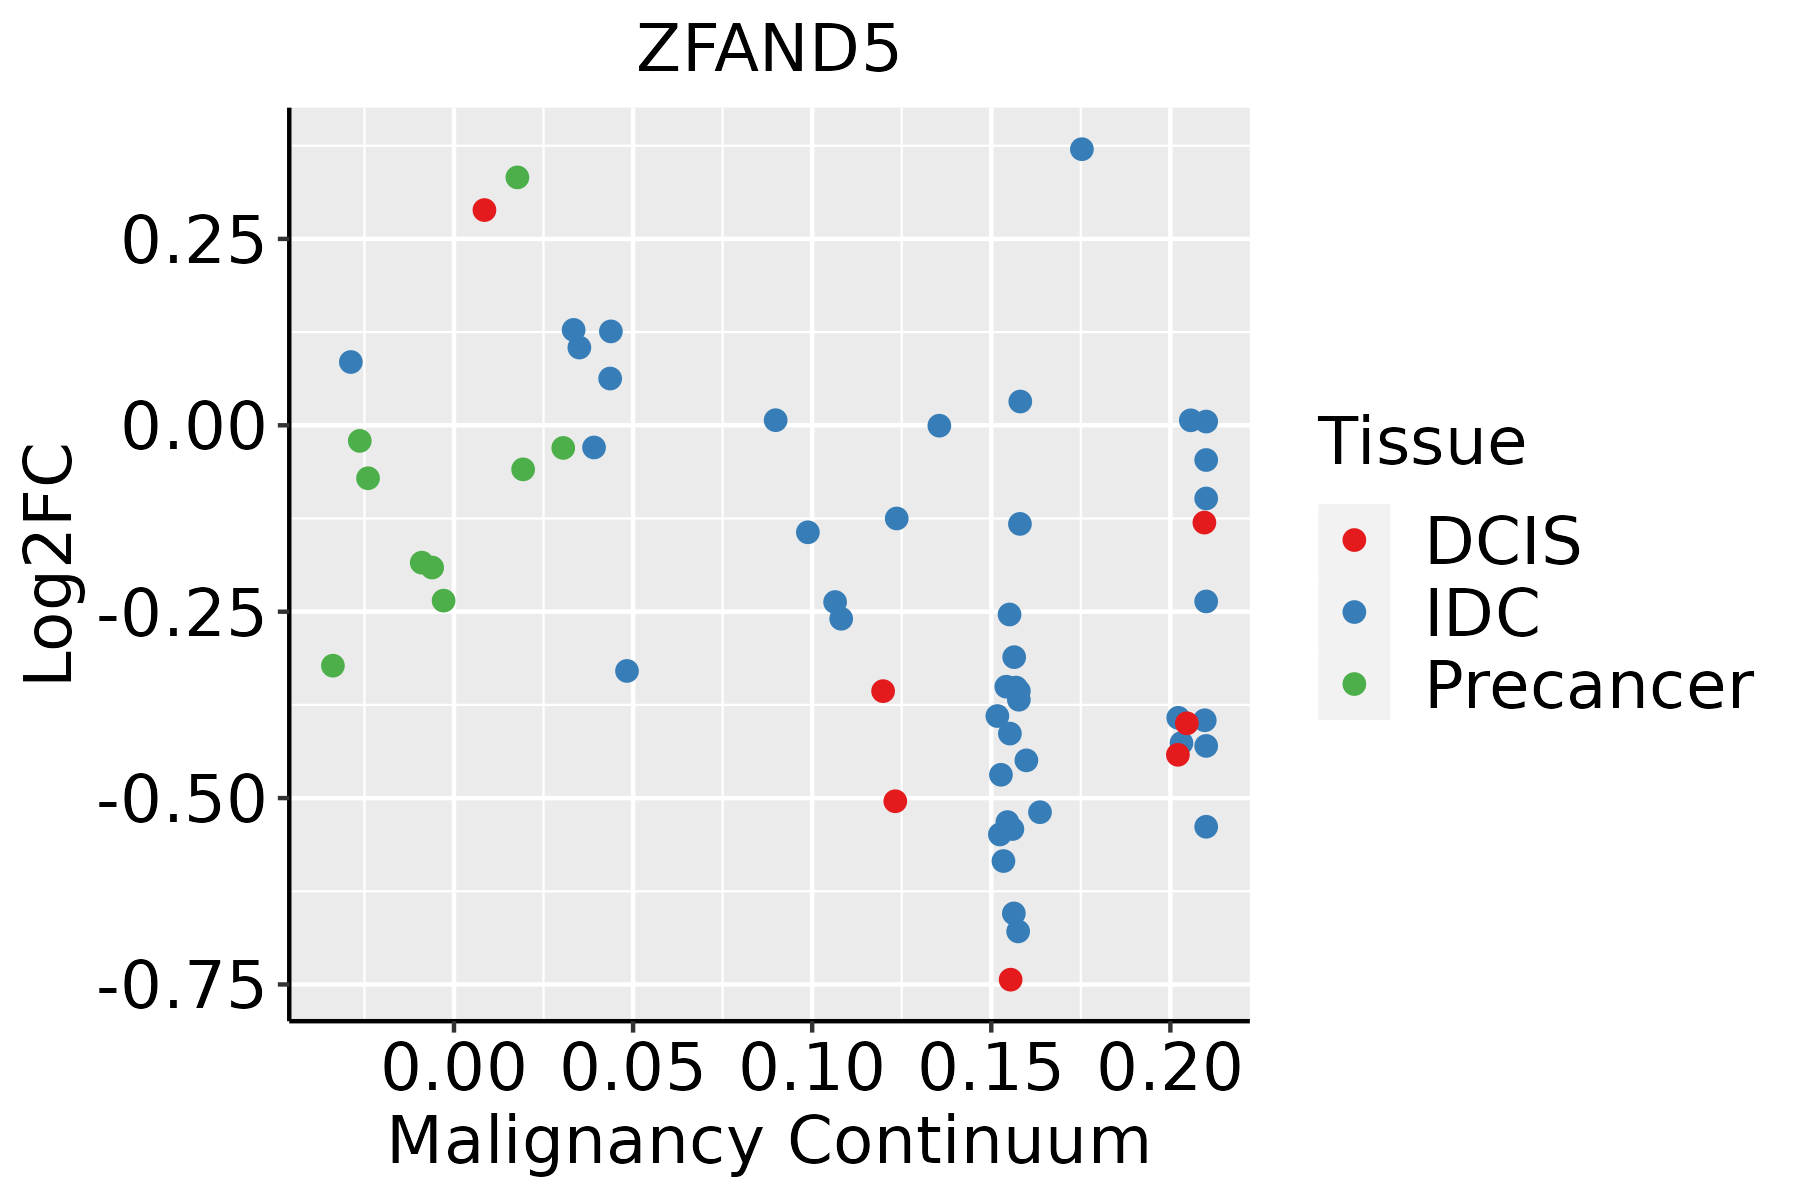
IDC: Invasive ductal carcinoma
DCIS: Ductal carcinoma in situ
Precancer(BRCA1-mut): Precancerous lesion from BRCA1 mutation carriers
EndometriumThe image shows the transcriptomic changes along malignancy continuum.log2FC in expression of this searched gene in stem-like cells from each diseased tissue sample relative to stem-like cells in normal samples in each tissue plotted against the malignancy continuum. Samples are colored based on if they are from different disease stage.
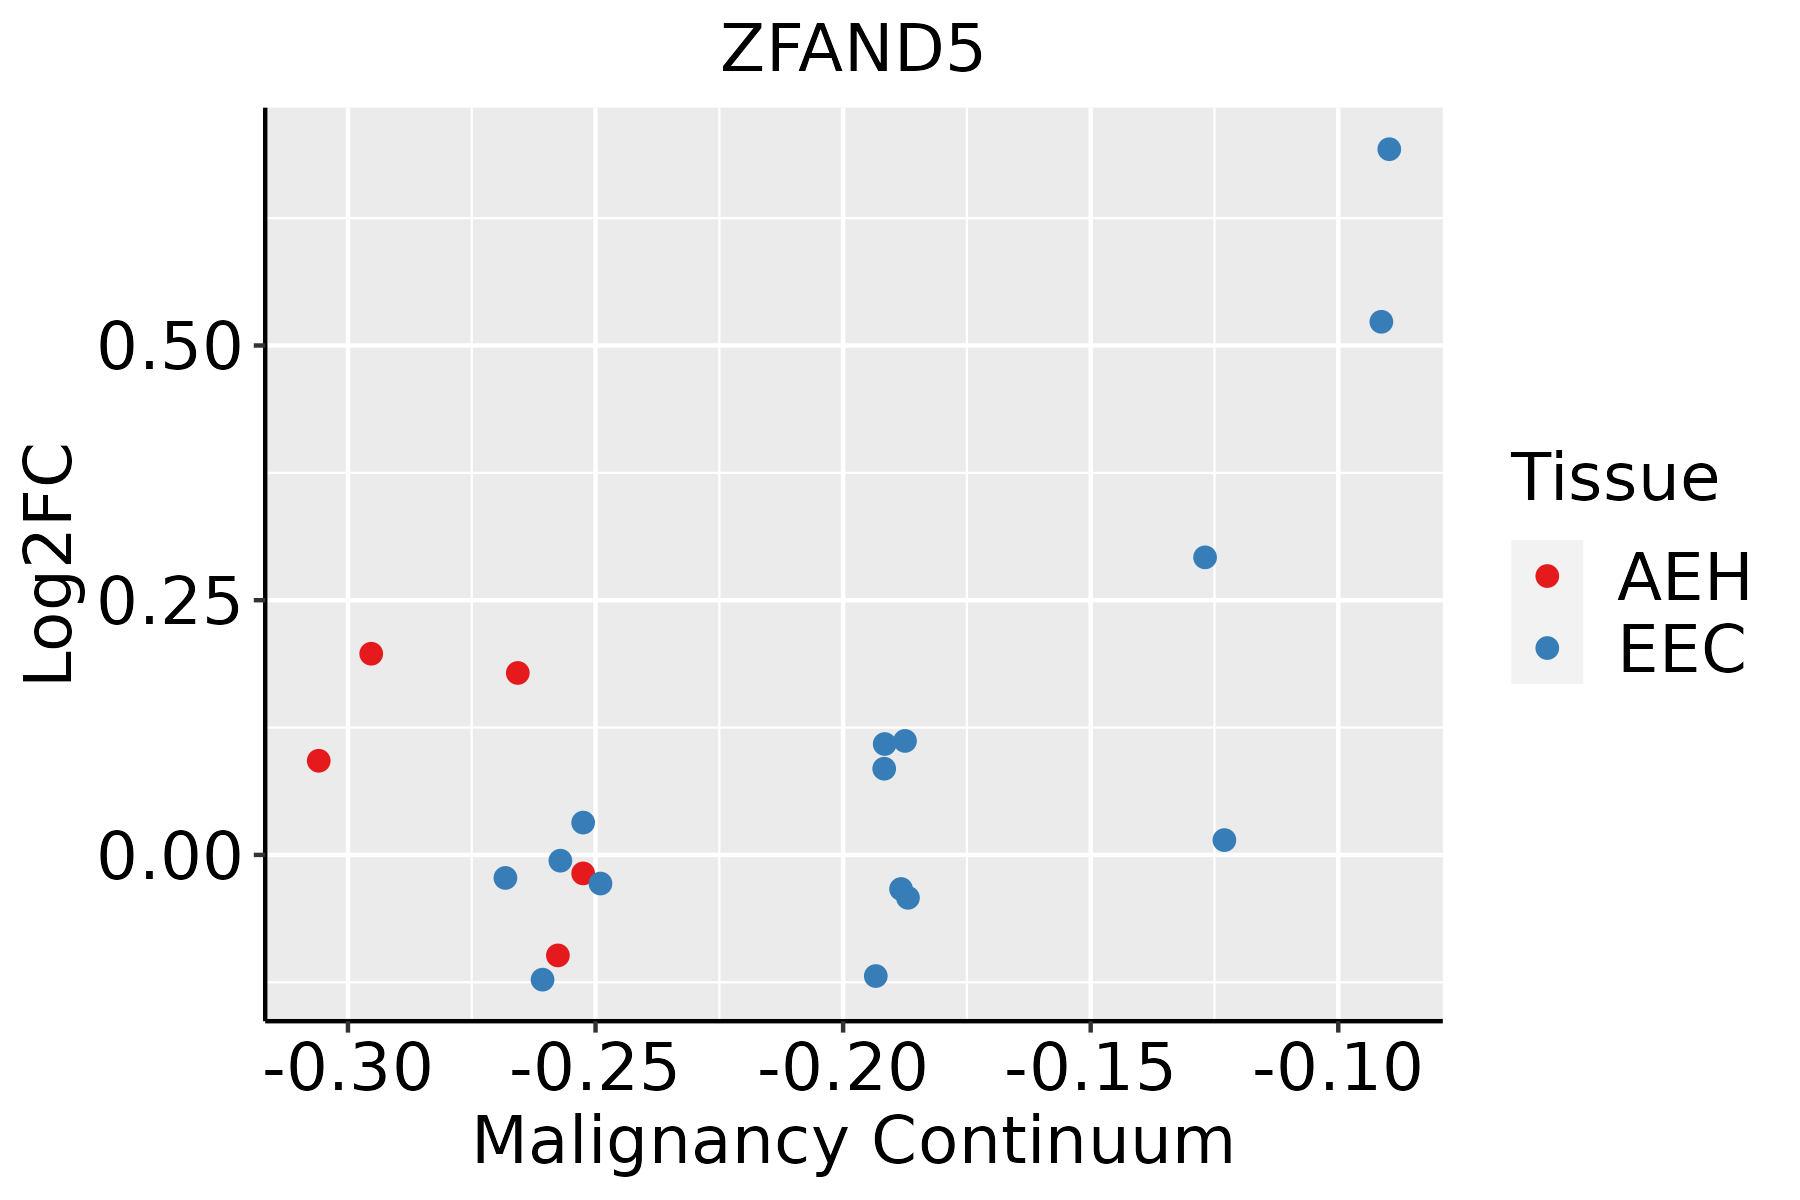
AEH: Atypical endometrial hyperplasia
EEC: Endometrioid Cancer
EsophagusThe image shows the transcriptomic changes along malignancy continuum.log2FC in expression of this searched gene in stem-like cells from each diseased tissue sample relative to stem-like cells in normal samples in each tissue plotted against the malignancy continuum. Samples are colored based on if they are from different disease stage.
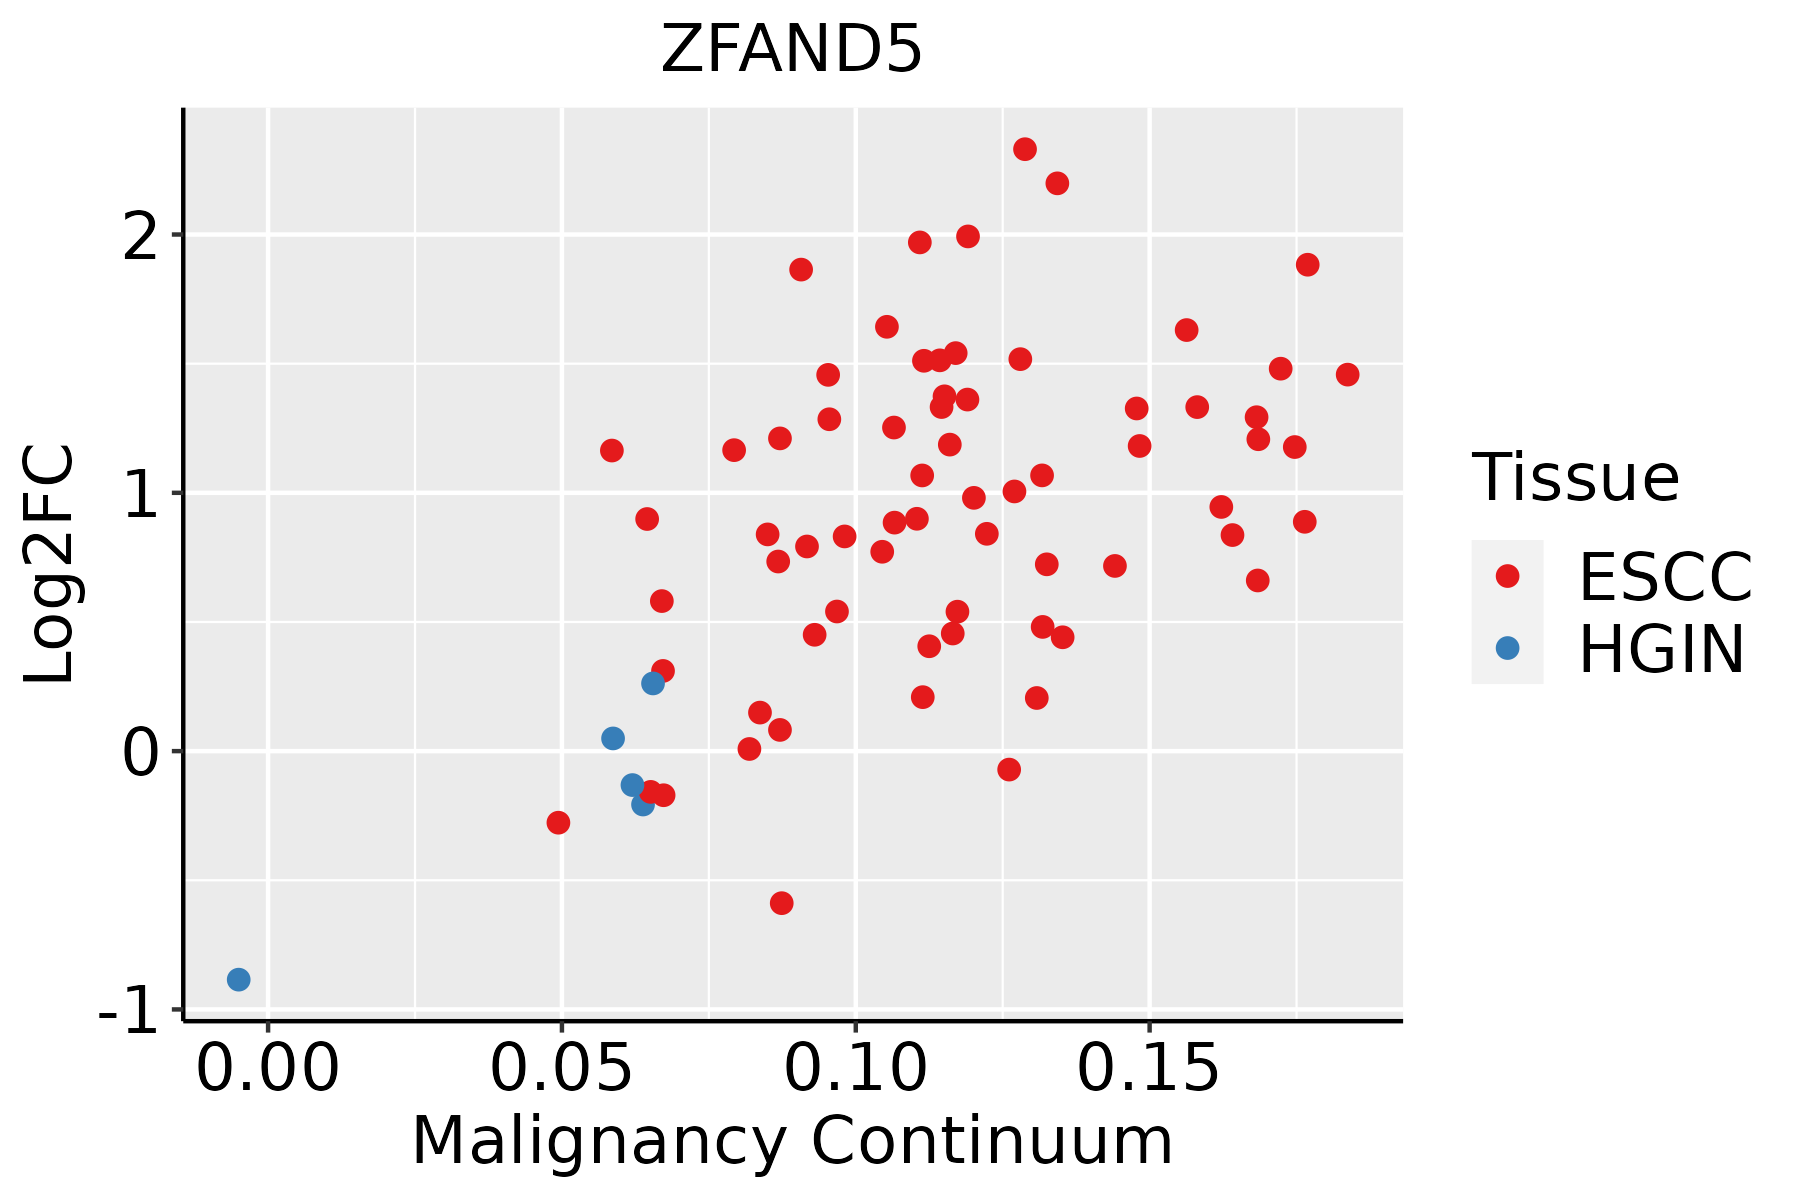
ESCC: Esophageal squamous cell carcinoma
HGIN: High-grade intraepithelial neoplasias
LGIN: Low-grade intraepithelial neoplasias
GCThe image shows the transcriptomic changes along malignancy continuum.log2FC in expression of this searched gene in stem-like cells from each diseased tissue sample relative to stem-like cells in normal samples in each tissue plotted against the malignancy continuum. Samples are colored based on if they are from different disease stage.
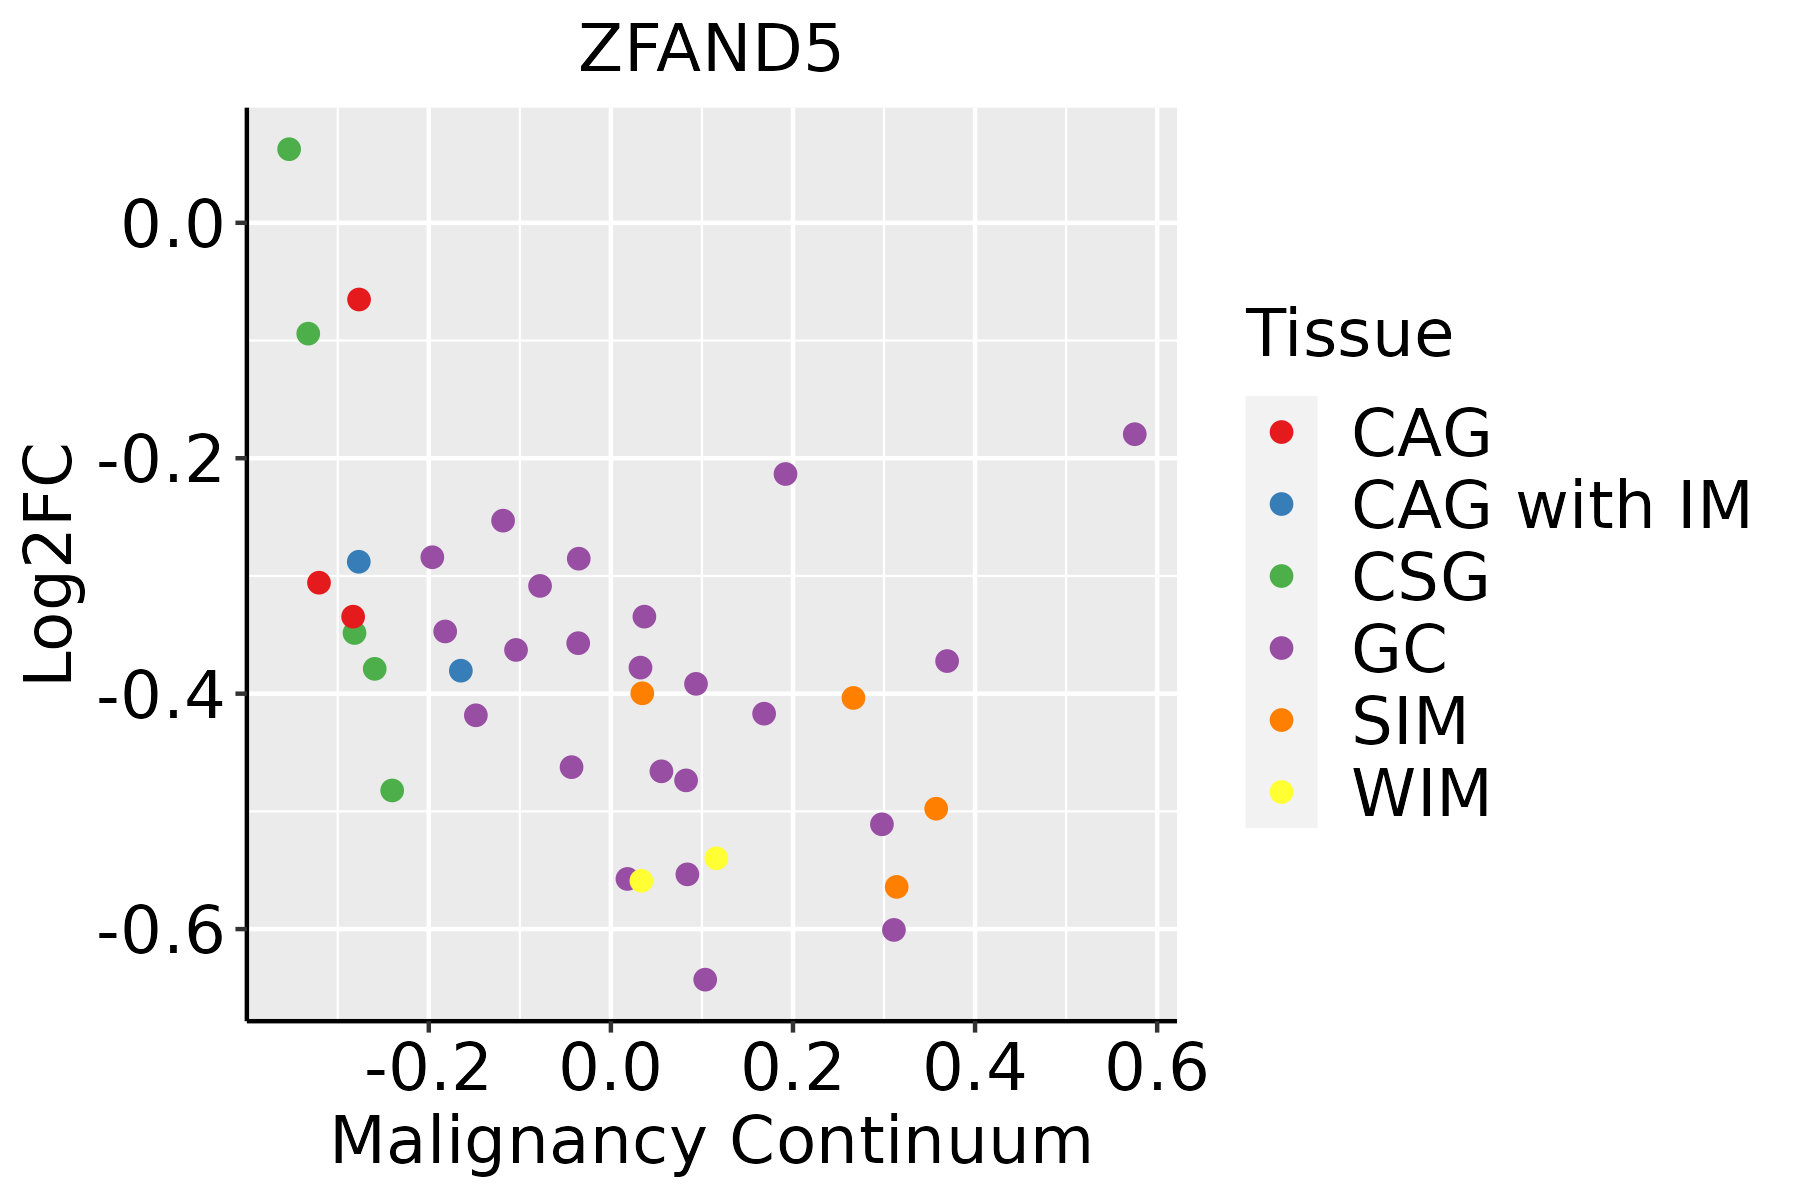
CAG: Chronic atrophic gastritis
CAG with IM: Chronic atrophic gastritis with intestinal metaplasia
CSG: Chronic superficial gastritis
GC: Gastric cancer
SIM: Severe intestinal metaplasia
WIM: Wild intestinal metaplasia
LiverThe image shows the transcriptomic changes along malignancy continuum.log2FC in expression of this searched gene in stem-like cells from each diseased tissue sample relative to stem-like cells in normal samples in each tissue plotted against the malignancy continuum. Samples are colored based on if they are from different disease stage.
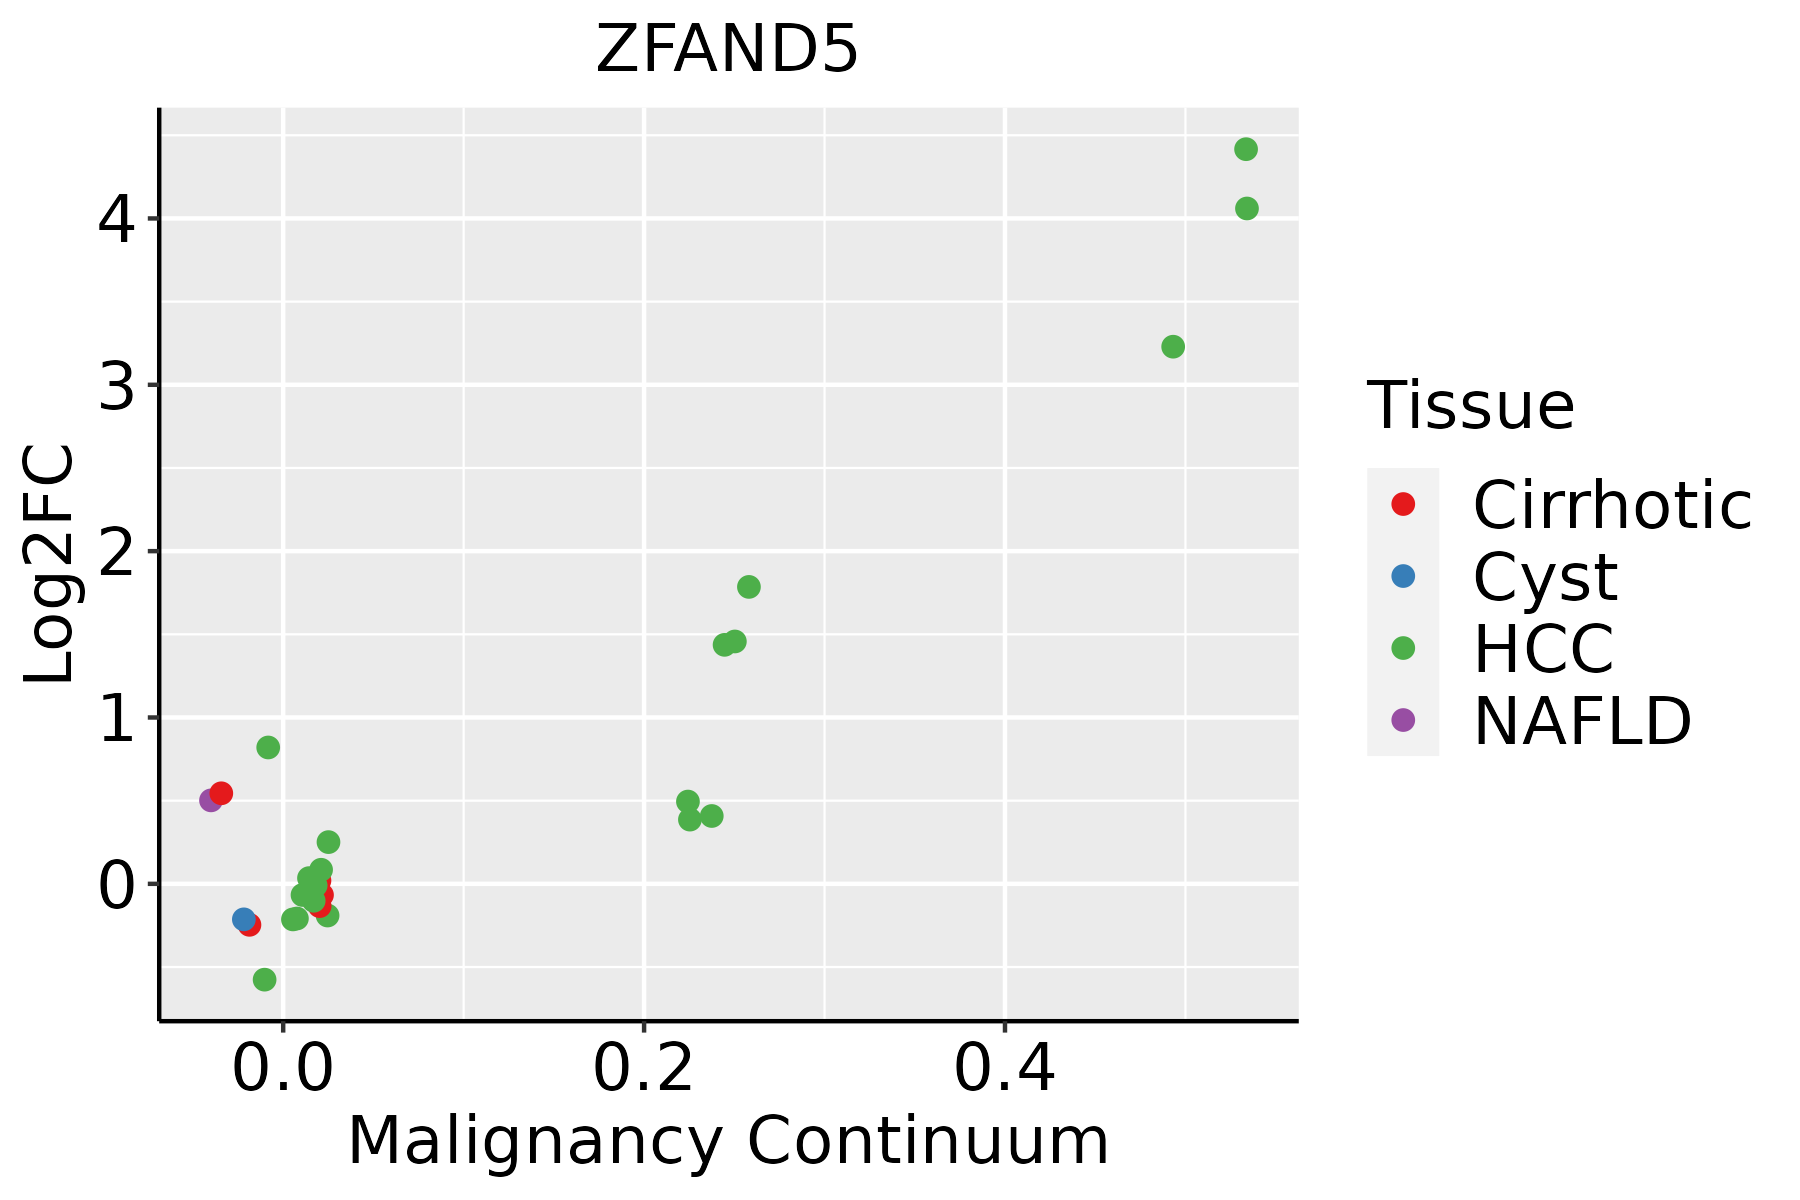
HCC: Hepatocellular carcinoma
NAFLD: Non-alcoholic fatty liver disease
LungThe image shows the transcriptomic changes along malignancy continuum.log2FC in expression of this searched gene in stem-like cells from each diseased tissue sample relative to stem-like cells in normal samples in each tissue plotted against the malignancy continuum. Samples are colored based on if they are from different disease stage.AAH: Atypical adenomatous hyperplasia
AIS: Adenocarcinoma in situ
IAC: Invasive lung adenocarcinoma
MIA: Minimally invasive adenocarcinoma
Oral CavityThe image shows the transcriptomic changes along malignancy continuum.log2FC in expression of this searched gene in stem-like cells from each diseased tissue sample relative to stem-like cells in normal samples in each tissue plotted against the malignancy continuum. Samples are colored based on if they are from different disease stage.
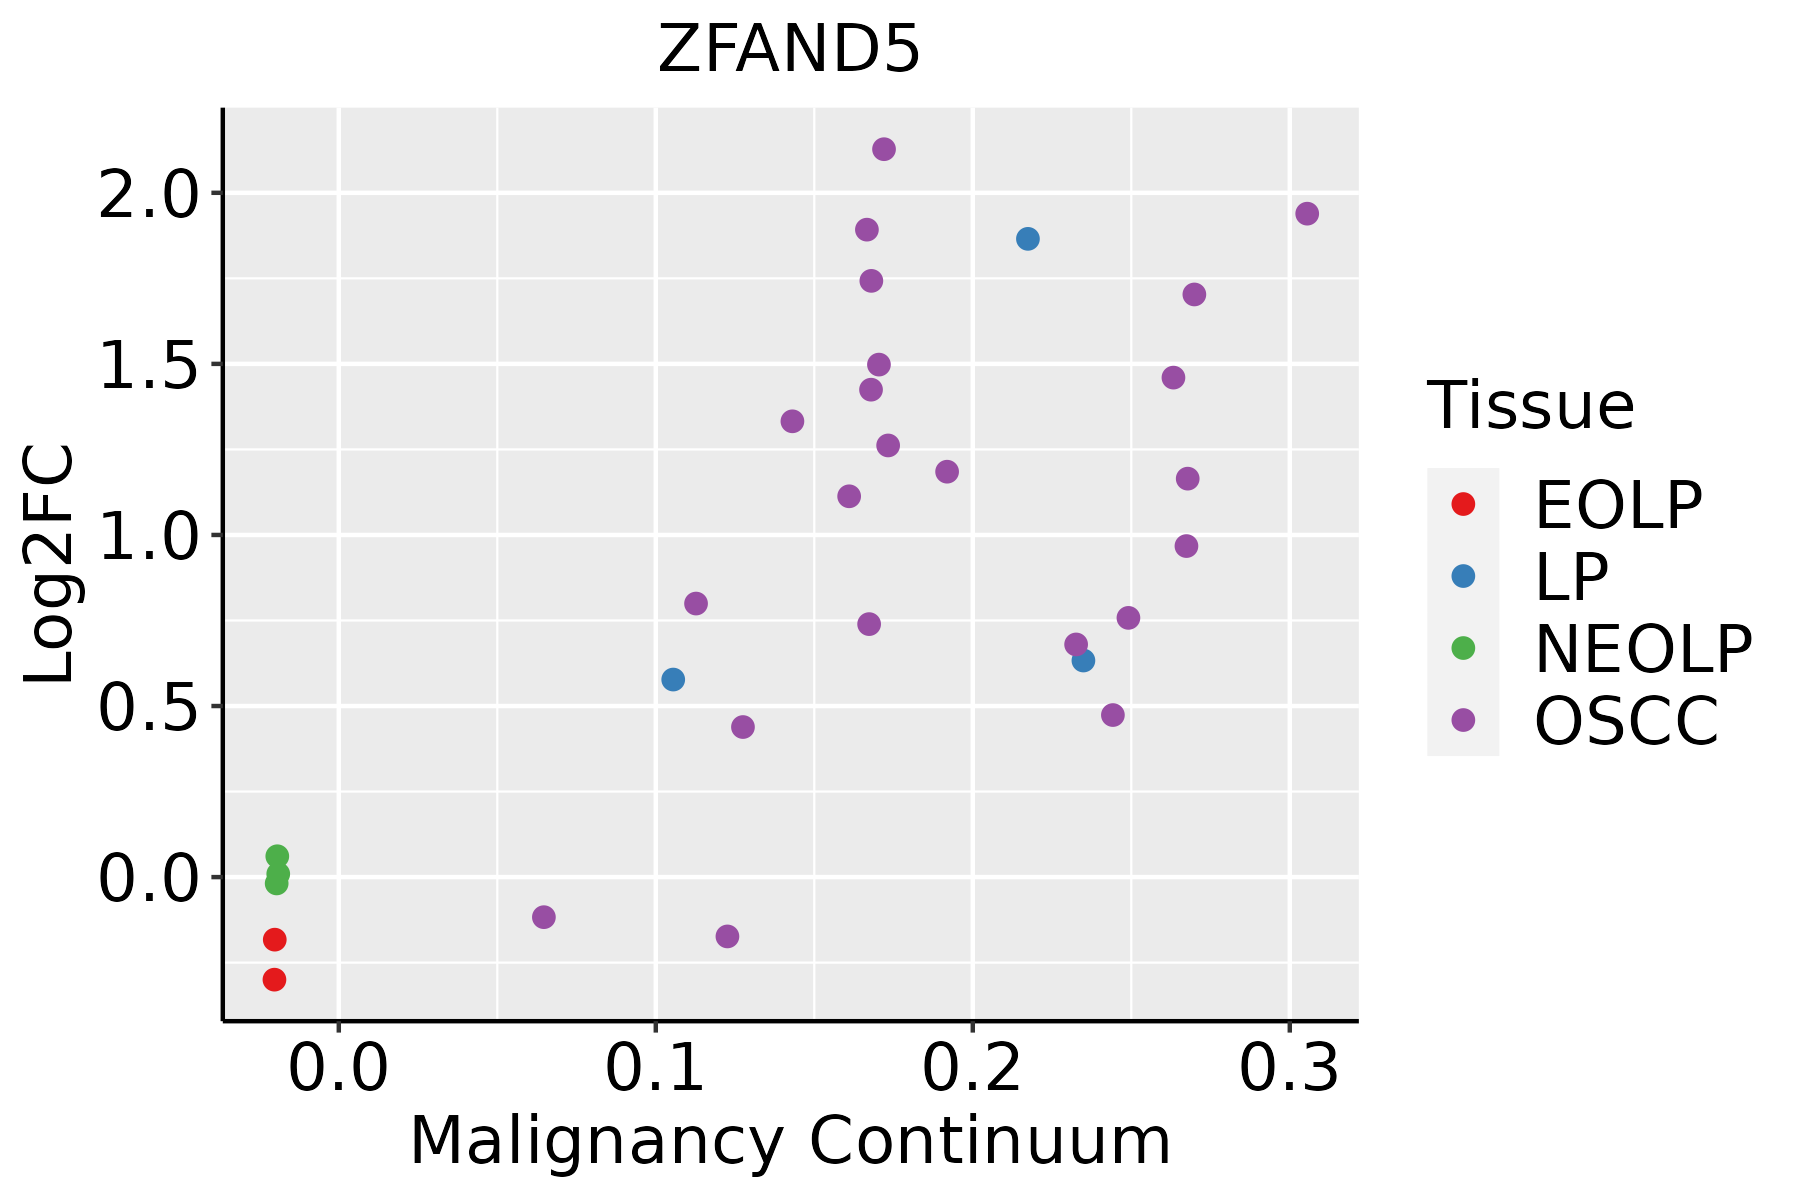
EOLP: Erosive Oral lichen planus
LP: leukoplakia
NEOLP: Non-erosive oral lichen planus
OSCC: Oral squamous cell carcinoma
ProstateThe image shows the transcriptomic changes along malignancy continuum.log2FC in expression of this searched gene in stem-like cells from each diseased tissue sample relative to stem-like cells in normal samples in each tissue plotted against the malignancy continuum. Samples are colored based on if they are from different disease stage.
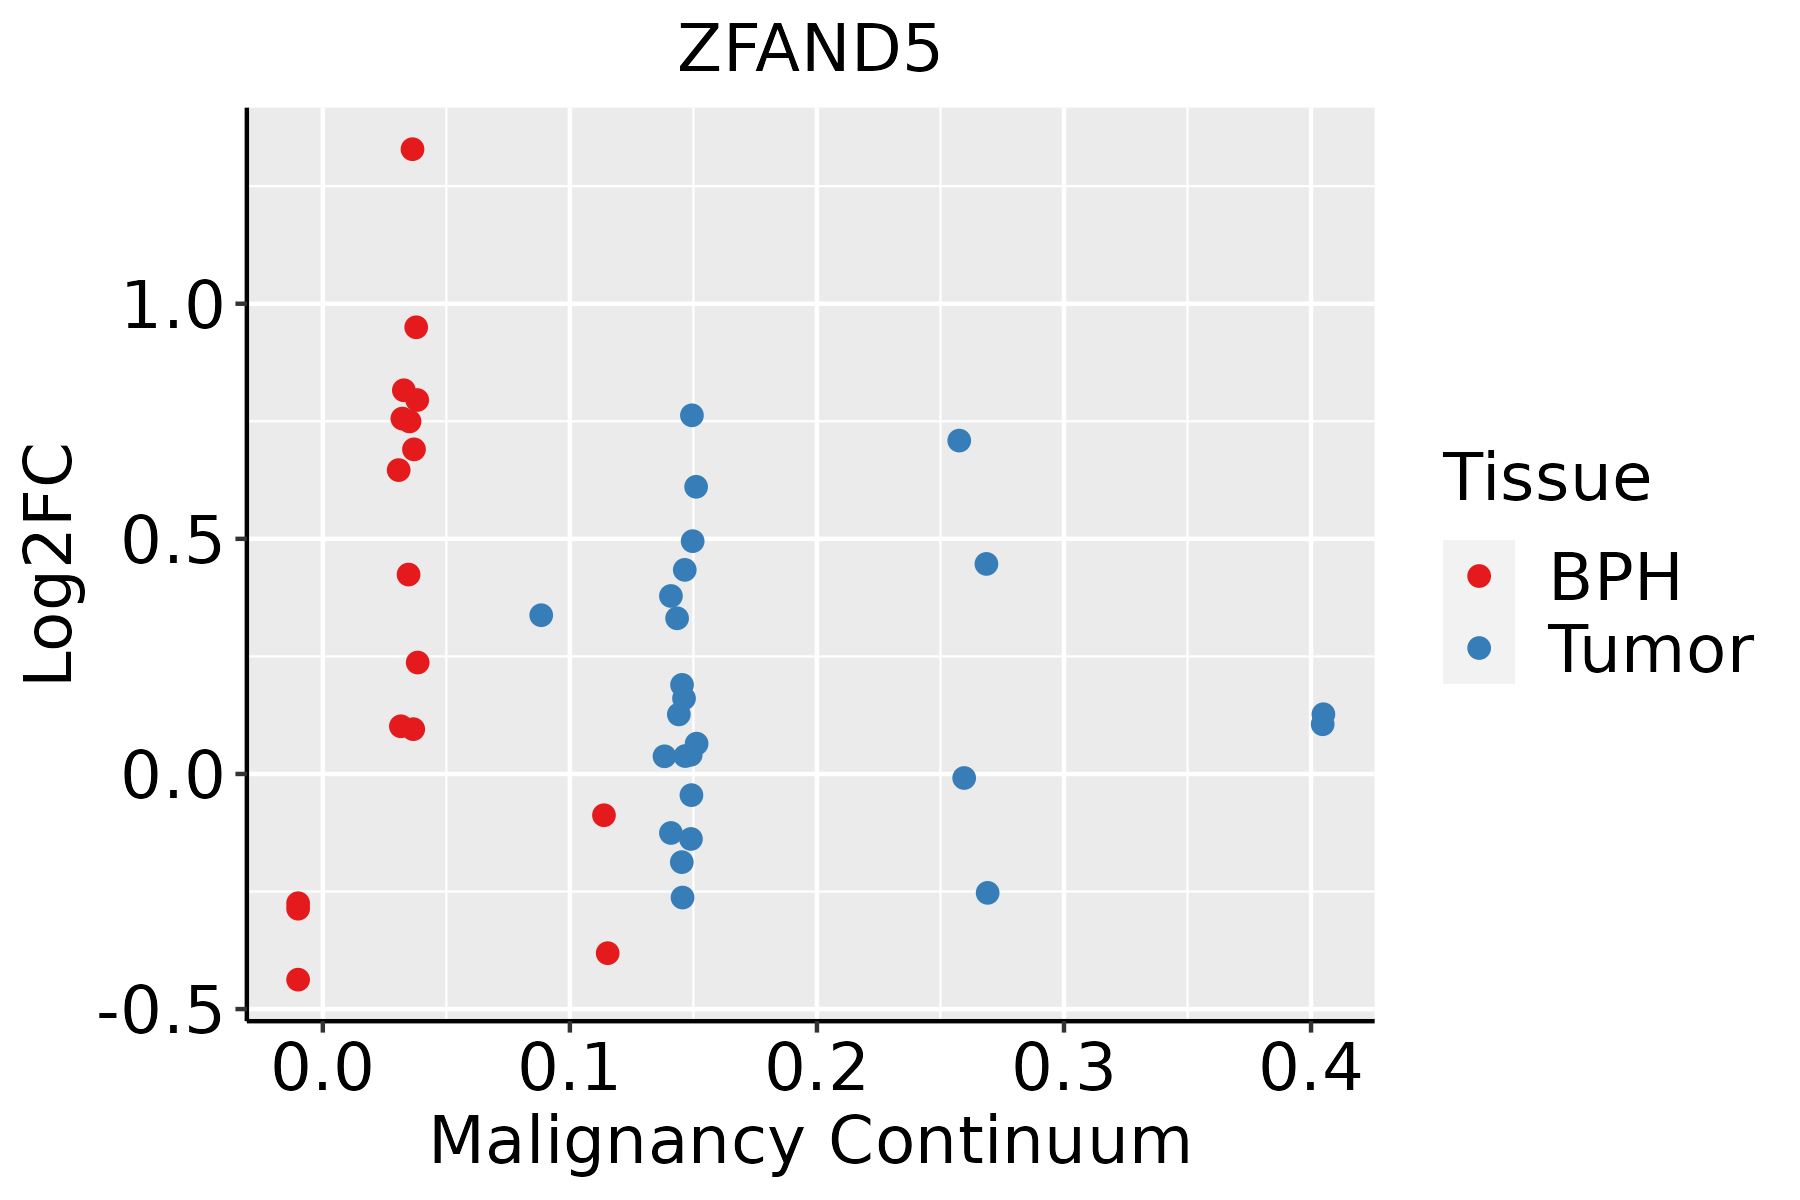
BPH: Benign Prostatic Hyperplasia
SkinThe image shows the transcriptomic changes along malignancy continuum.log2FC in expression of this searched gene in stem-like cells from each diseased tissue sample relative to stem-like cells in normal samples in each tissue plotted against the malignancy continuum. Samples are colored based on if they are from different disease stage.
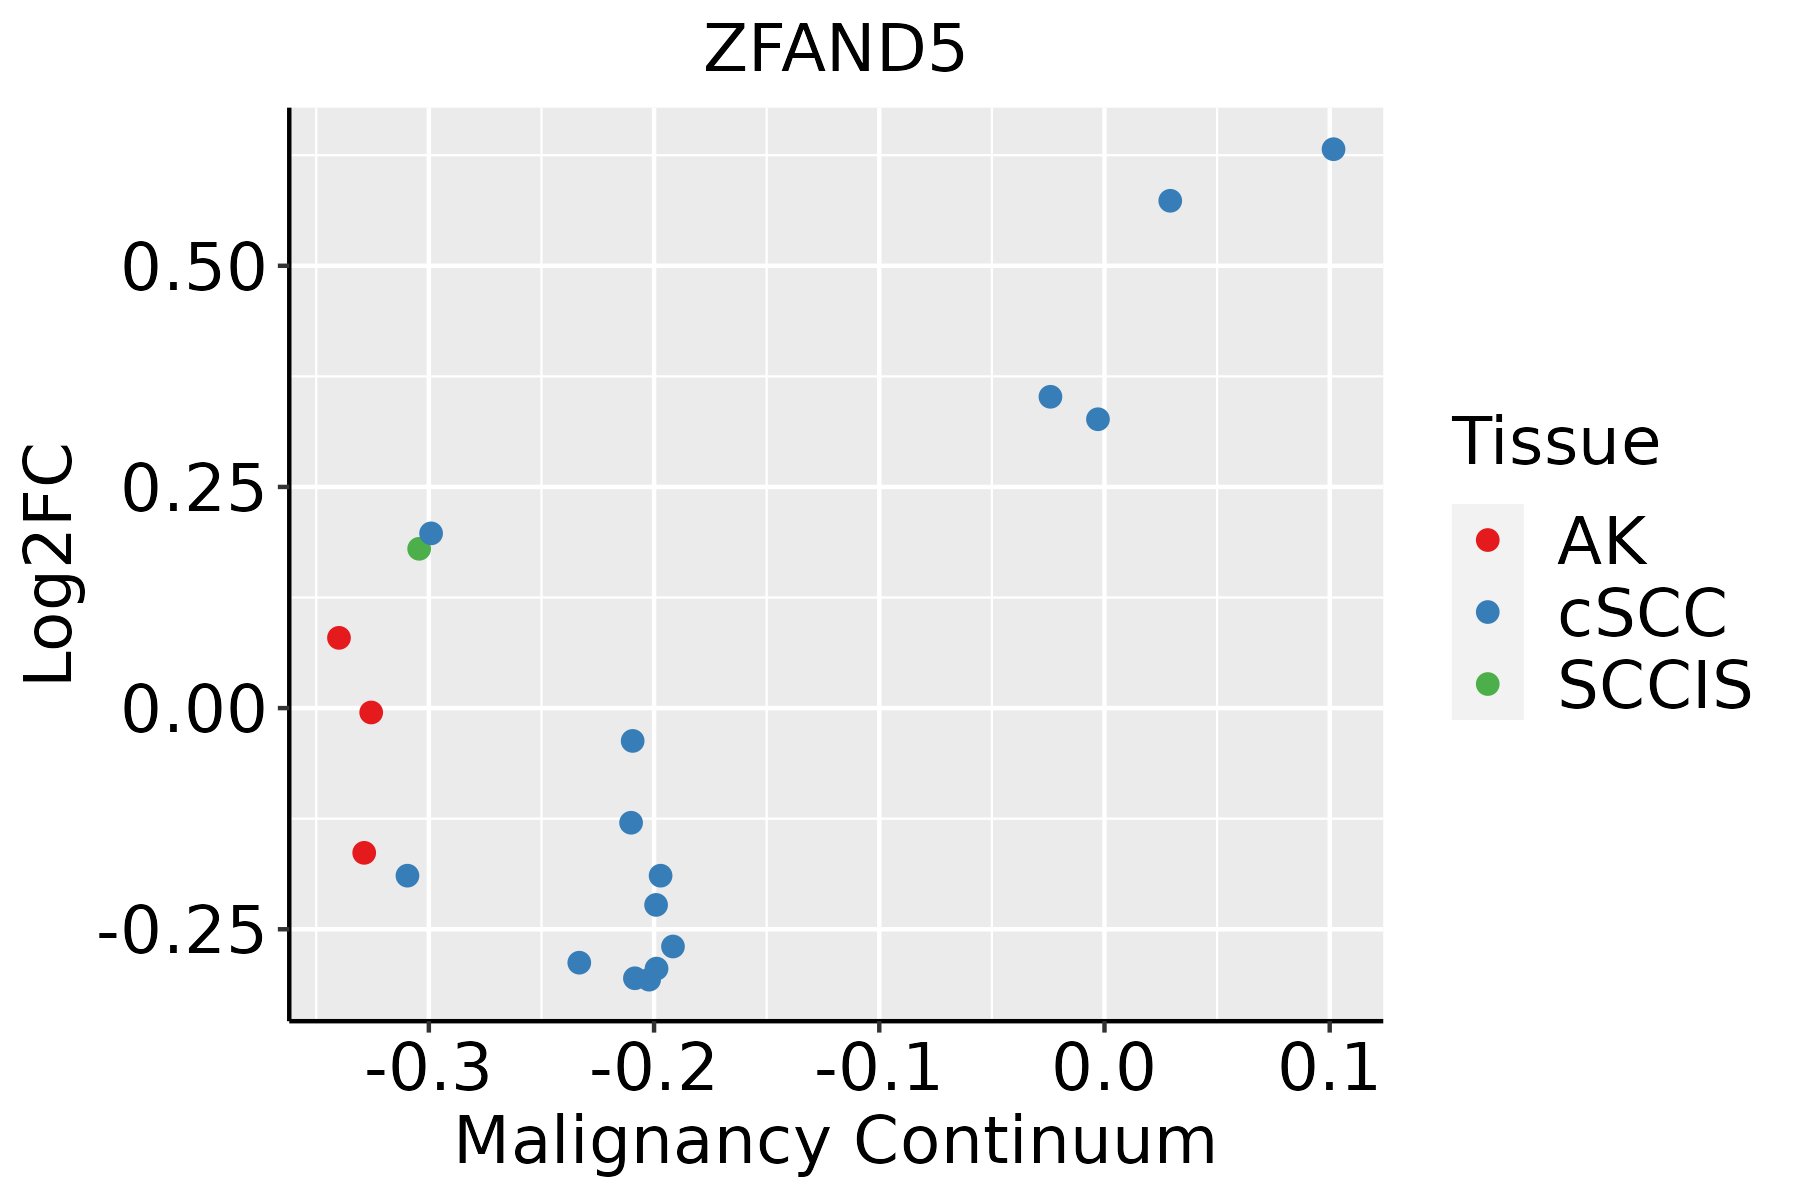
AK: Actinic keratosis
cSCC: Cutaneous squamous cell carcinoma
SCCIS:squamous cell carcinoma in situ
ThyroidThe image shows the transcriptomic changes along malignancy continuum.log2FC in expression of this searched gene in stem-like cells from each diseased tissue sample relative to stem-like cells in normal samples in each tissue plotted against the malignancy continuum. Samples are colored based on if they are from different disease stage.ATC: Anaplastic thyroid cancer
HT: Hashimoto's thyroiditis
PTC: Papillary thyroid cancer
∗log2FC in expression of this searched gene in stem-like cells from each diseased tissue sample relative to stem-like cells in normal samples in each tissue plotted against the malignancy continuum. Samples are colored based on if they are from different disease stage.

Top

Malignant transformation related pathway analysis

check buttonFind out the enriched GO biological processes and KEGG pathways involved in transition from healthy to precancer to cancer
check button Figure of enriched GO biological processes.
TissueDisease StageEnriched GO biological Processes
ColorectumADGO analysis - Figure of enriched GO biological processes: Top 15 enriched GO BP terms are showed in the bar plot of each disease state in each tissue. Each row represents a significant GO biological process which is colored according to the -log10(p.adjust).
ColorectumSERGO analysis - Figure of enriched GO biological processes: Top 15 enriched GO BP terms are showed in the bar plot of each disease state in each tissue. Each row represents a significant GO biological process which is colored according to the -log10(p.adjust).
ColorectumMSSGO analysis - Figure of enriched GO biological processes: Top 15 enriched GO BP terms are showed in the bar plot of each disease state in each tissue. Each row represents a significant GO biological process which is colored according to the -log10(p.adjust).
ColorectumMSI-HGO analysis - Figure of enriched GO biological processes: Top 15 enriched GO BP terms are showed in the bar plot of each disease state in each tissue. Each row represents a significant GO biological process which is colored according to the -log10(p.adjust).
ColorectumFAPGO analysis - Figure of enriched GO biological processes: Top 15 enriched GO BP terms are showed in the bar plot of each disease state in each tissue. Each row represents a significant GO biological process which is colored according to the -log10(p.adjust).
∗Top 15 enriched GO BP terms are showed in the bar plot of each disease state in each tissue. Each row represents a significant GO biological process which is colored according to the -log10(p.adjust).
Page: 1 2 3 4 5 6 7 8 9 

check button Enriched GO biological processes.
GO IDTissueDisease StageDescriptionGene RatioBg Ratiopvaluep.adjustCount
GO:00016678BreastPrecancerameboidal-type cell migration47/1080475/187232.19e-043.35e-0347
GO:00017017BreastPrecancerin utero embryonic development35/1080367/187232.47e-032.27e-0235
GO:00605374BreastPrecancermuscle tissue development37/1080403/187233.60e-032.98e-0237
GO:000166714BreastIDCameboidal-type cell migration64/1434475/187236.65e-062.05e-0464
GO:006053711BreastIDCmuscle tissue development50/1434403/187234.91e-046.45e-0350
GO:000170113BreastIDCin utero embryonic development42/1434367/187235.85e-034.24e-0242
GO:000166723BreastDCISameboidal-type cell migration62/1390475/187239.60e-062.56e-0462
GO:006053721BreastDCISmuscle tissue development50/1390403/187232.39e-043.74e-0350
GO:000170122BreastDCISin utero embryonic development41/1390367/187235.74e-034.13e-0241
GO:00605376EndometriumAEHmuscle tissue development83/2100403/187232.57e-081.50e-0683
GO:000166710EndometriumAEHameboidal-type cell migration90/2100475/187233.73e-071.57e-0590
GO:00017019EndometriumAEHin utero embryonic development73/2100367/187237.18e-072.63e-0573
GO:00107616EndometriumAEHfibroblast migration14/210047/187234.51e-044.76e-0314
GO:006053713EndometriumEECmuscle tissue development82/2168403/187232.14e-079.38e-0682
GO:000170114EndometriumEECin utero embryonic development75/2168367/187235.86e-072.16e-0575
GO:000166716EndometriumEECameboidal-type cell migration91/2168475/187237.87e-072.80e-0591
GO:001076112EndometriumEECfibroblast migration14/216847/187236.25e-046.14e-0314
GO:000170119EsophagusESCCin utero embryonic development243/8552367/187231.00e-156.86e-14243
GO:00480087EsophagusESCCplatelet-derived growth factor receptor signaling pathway42/855256/187237.62e-067.54e-0542
GO:00603242EsophagusESCCface development34/855244/187231.90e-051.67e-0434
Page: 1 2 3 4 5 

check button Enriched KEGG pathways.
Pathway IDTissueDisease StageDescriptionGene RatioBg Ratiopvaluep.adjustqvalueCount
Page: 1 

Top

Cell-cell communication analysis

check buttonIdentification of potential cell-cell interactions between two cell types and their ligand-receptor pairs for different disease states
LigandReceptorLRpairPathwayTissueDisease Stage
Page: 1 

Top

Single-cell gene regulatory network inference analysis

check buttonFind out the significant the regulons (TFs) and the target genes of each regulon across cell types for different disease states
TFCell TypeTissueDisease StageTarget GeneRSSRegulon Activity
∗The dot plots of a searched regulon are shown for all cell subpopulations in each disease state of each tissue based on the regulon specific score inferred using pySCENIC and by calculating the average expression.
Page: 1 

Top

Somatic mutation of malignant transformation related genes

check buttonAnnotation of somatic variants for genes involved in malignant transformation
Hugo SymbolVariant ClassVariant ClassificationdbSNP RSHGVScHGVSpHGVSp ShortSWISSPROTBIOTYPESIFTPolyPhenTumor Sample BarcodeTissueHistologySexAgeStageTherapy TypesDrugsOutcome
ZFAND5SNVMissense_Mutationc.359C>Tp.Ser120Leup.S120LO76080protein_codingtolerated(0.37)benign(0)TCGA-GM-A2DO-01Breastbreast invasive carcinomaFemale<65I/IIHormone TherapytamoxiphenCR
ZFAND5SNVMissense_Mutationnovelc.545A>Tp.Asp182Valp.D182VO76080protein_codingdeleterious(0)probably_damaging(0.995)TCGA-S3-AA10-01Breastbreast invasive carcinomaFemale>=65I/IIChemotherapycytoxanCR
ZFAND5SNVMissense_Mutationc.465N>Ap.Phe155Leup.F155LO76080protein_codingdeleterious(0.03)probably_damaging(0.982)TCGA-C5-A1M6-01Cervixcervical & endocervical cancerFemale<65I/IIChemotherapycisplatinPD
ZFAND5SNVMissense_Mutationc.397N>Ap.Gln133Lysp.Q133KO76080protein_codingtolerated(0.54)benign(0.014)TCGA-C5-A7XC-01Cervixcervical & endocervical cancerFemale<65I/IIUnknownUnknownSD
ZFAND5SNVMissense_Mutationnovelc.333N>Cp.Lys111Asnp.K111NO76080protein_codingtolerated(0.54)benign(0.01)TCGA-F5-6814-01Colorectumrectum adenocarcinomaMale<65I/IIUnknownUnknownSD
ZFAND5SNVMissense_Mutationnovelc.314N>Tp.Ser105Ilep.S105IO76080protein_codingdeleterious(0.02)benign(0.204)TCGA-A5-A1OF-01Endometriumuterine corpus endometrioid carcinomaFemale<65I/IIUnknownUnknownSD
ZFAND5SNVMissense_Mutationc.468N>Ap.Met156Ilep.M156IO76080protein_codingtolerated(0.28)benign(0.026)TCGA-AP-A051-01Endometriumuterine corpus endometrioid carcinomaFemale>=65I/IIUnknownUnknownSD
ZFAND5SNVMissense_Mutationc.120N>Tp.Arg40Serp.R40SO76080protein_codingdeleterious(0)probably_damaging(0.972)TCGA-B5-A0JY-01Endometriumuterine corpus endometrioid carcinomaFemale<65III/IVChemotherapydoxorubicinSD
ZFAND5SNVMissense_Mutationnovelc.23C>Tp.Thr8Ilep.T8IO76080protein_codingdeleterious(0)probably_damaging(0.921)TCGA-B5-A3FC-01Endometriumuterine corpus endometrioid carcinomaFemale<65I/IIUnknownUnknownSD
ZFAND5SNVMissense_Mutationc.79A>Cp.Asn27Hisp.N27HO76080protein_codingdeleterious(0.02)probably_damaging(0.983)TCGA-D1-A103-01Endometriumuterine corpus endometrioid carcinomaFemale>=65I/IIUnknownUnknownSD
Page: 1 2 3 

Top

Related drugs of malignant transformation related genes

check buttonIdentification of chemicals and drugs interact with genes involved in malignant transfromation
(DGIdb 4.0)
Entrez IDSymbolCategoryInteraction TypesDrug Claim NameDrug NamePMIDs
Page: 1