| Tissue | Expression Dynamics | Abbreviation |
| Cervix | 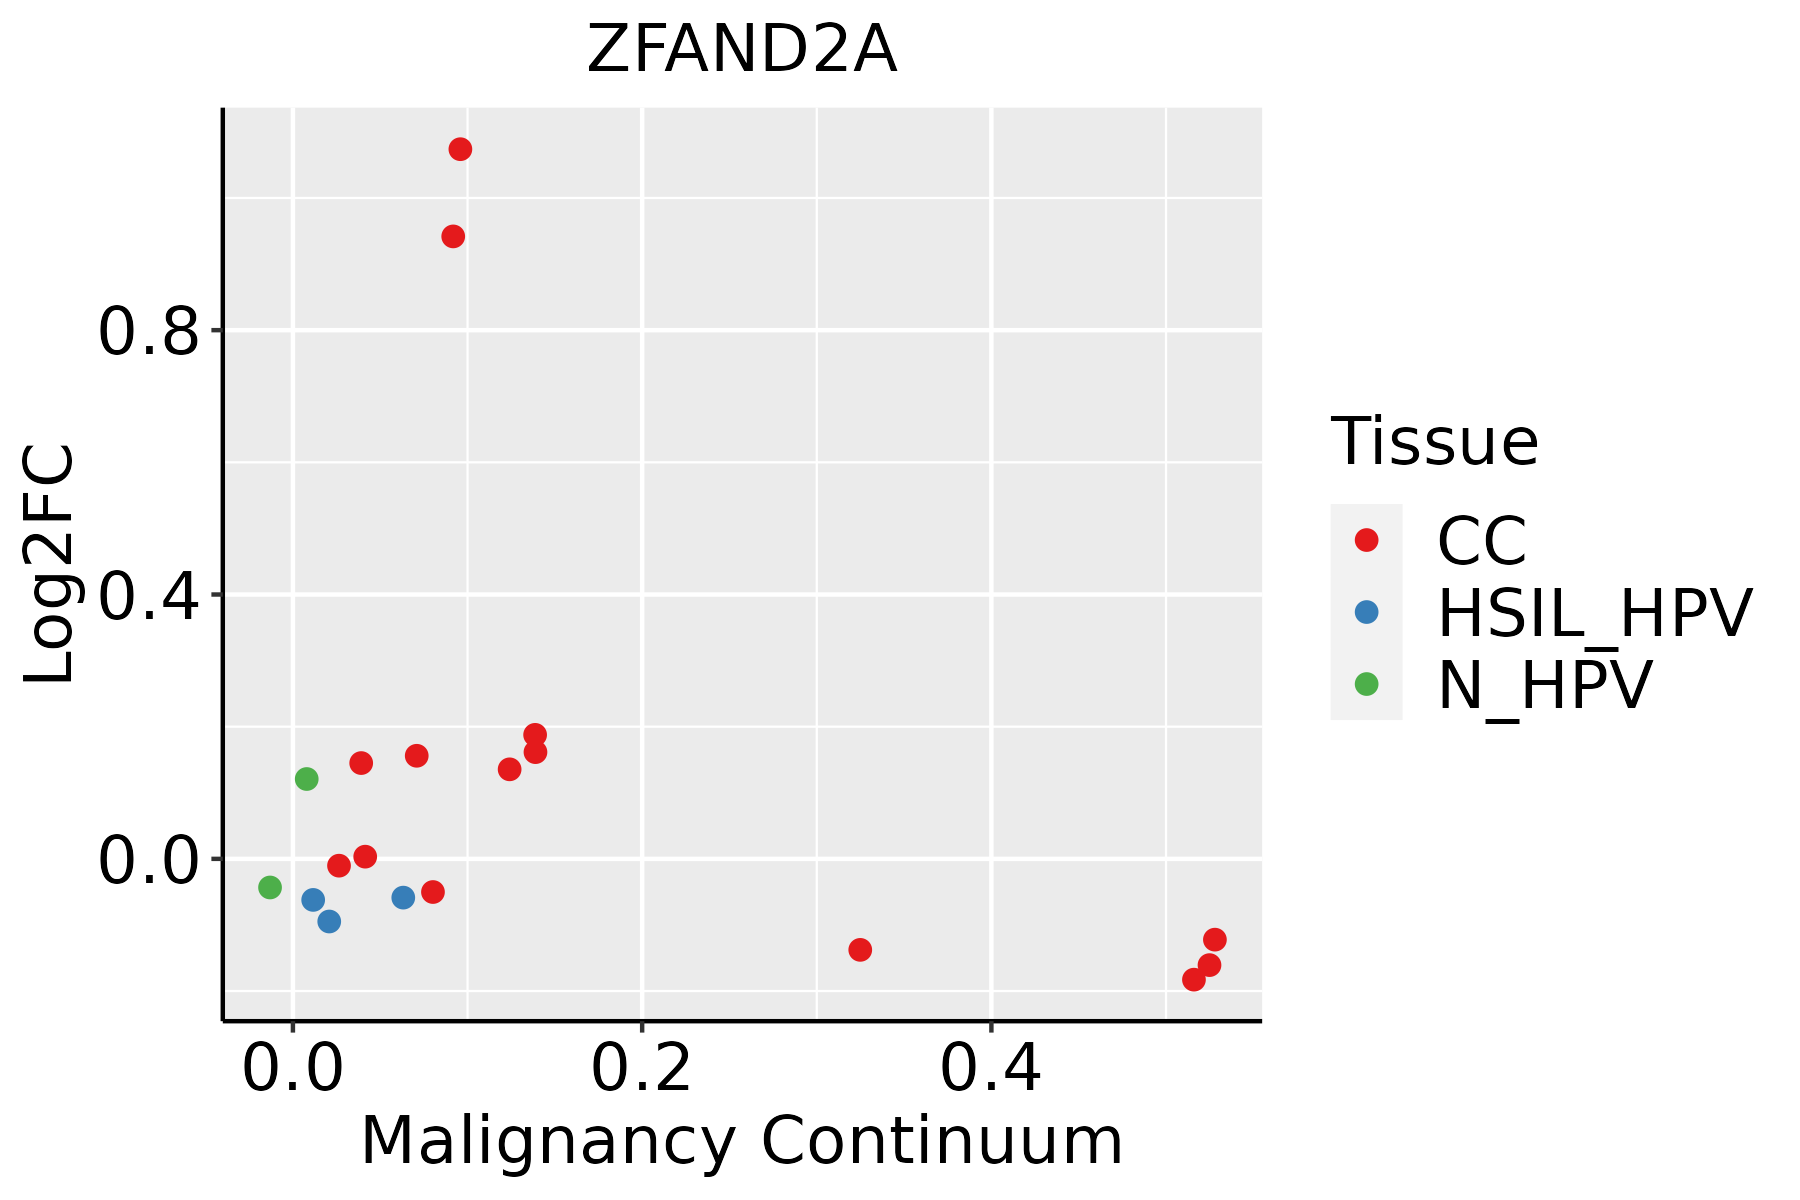 | CC: Cervix cancer |
| HSIL_HPV: HPV-infected high-grade squamous intraepithelial lesions |
| N_HPV: HPV-infected normal cervix |
| Esophagus | 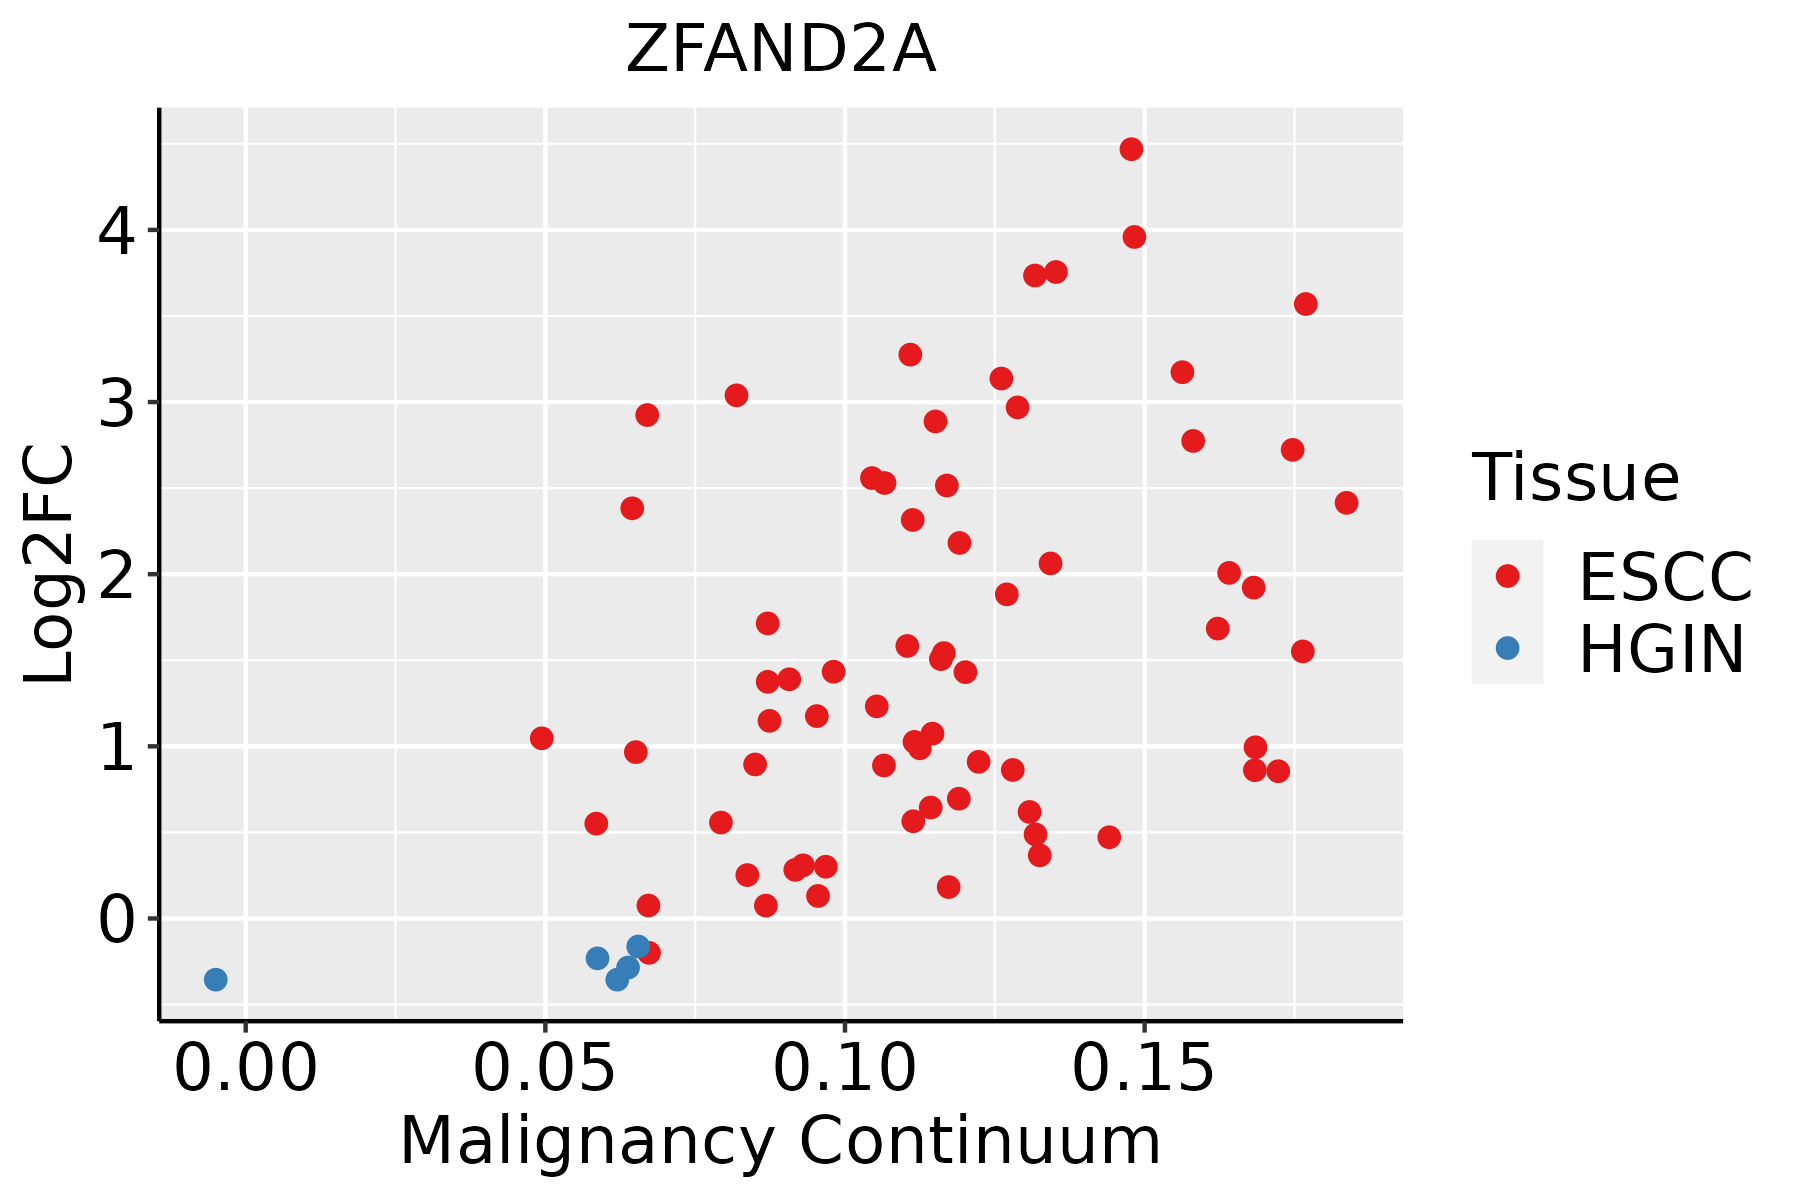 | ESCC: Esophageal squamous cell carcinoma |
| HGIN: High-grade intraepithelial neoplasias |
| LGIN: Low-grade intraepithelial neoplasias |
| GC |  | CAG: Chronic atrophic gastritis |
| CAG with IM: Chronic atrophic gastritis with intestinal metaplasia |
| CSG: Chronic superficial gastritis |
| GC: Gastric cancer |
| SIM: Severe intestinal metaplasia |
| WIM: Wild intestinal metaplasia |
| Liver |  | HCC: Hepatocellular carcinoma |
| NAFLD: Non-alcoholic fatty liver disease |
| Oral Cavity | 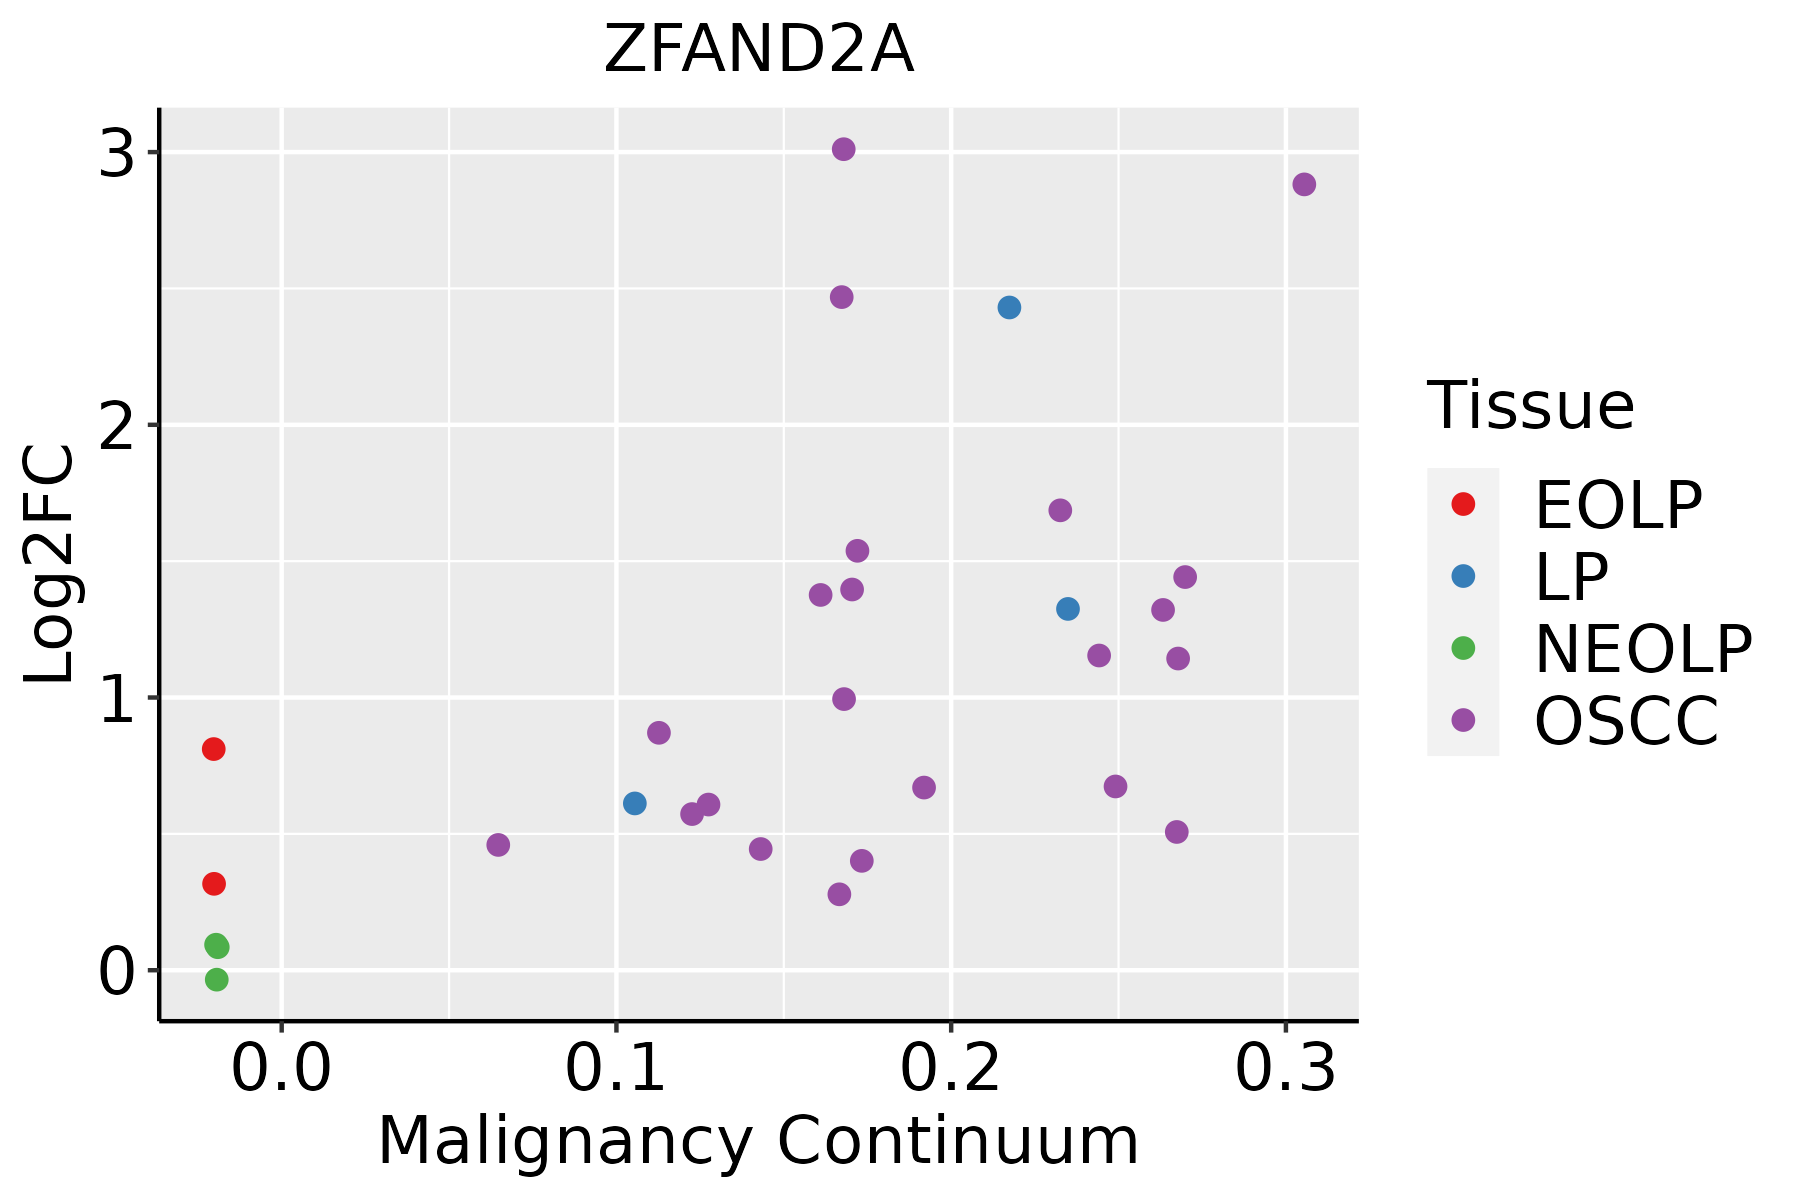 | EOLP: Erosive Oral lichen planus |
| LP: leukoplakia |
| NEOLP: Non-erosive oral lichen planus |
| OSCC: Oral squamous cell carcinoma |
| Prostate | 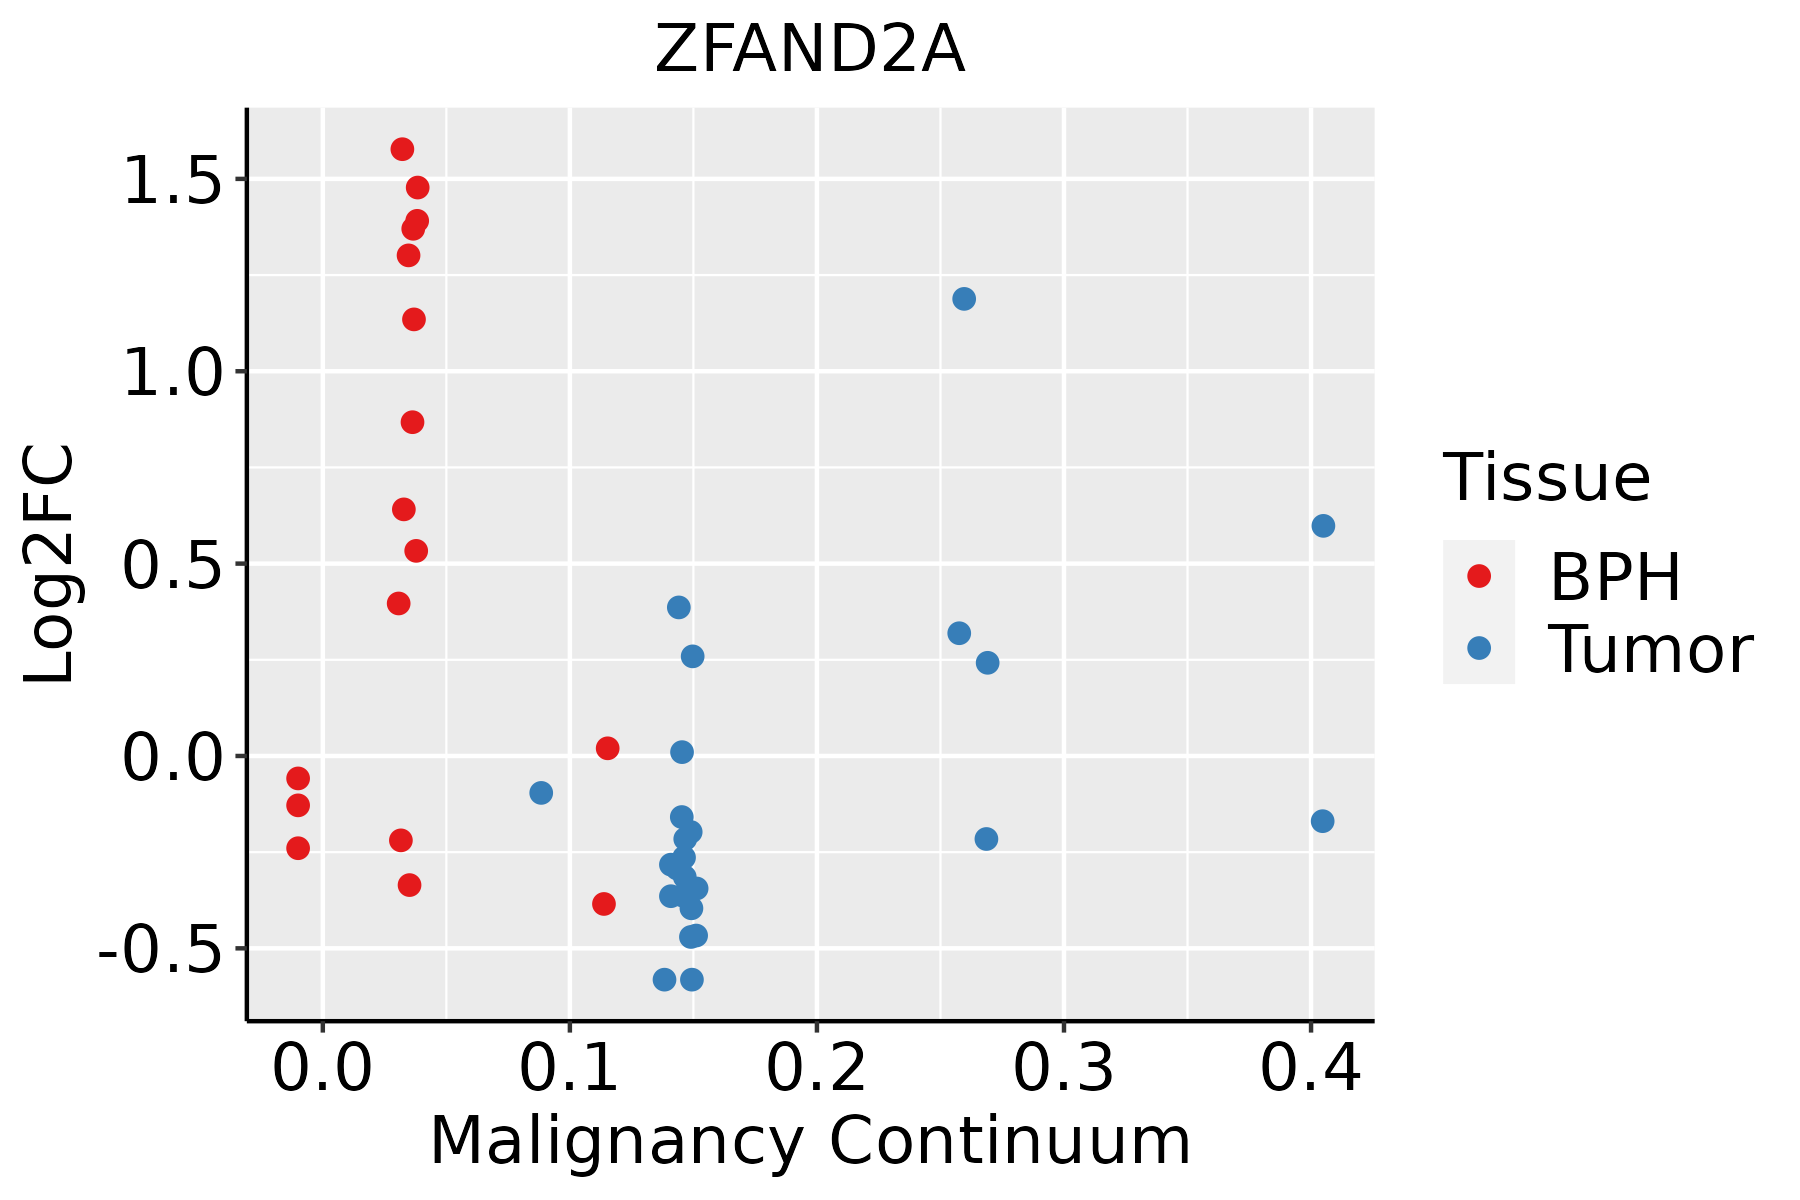 | BPH: Benign Prostatic Hyperplasia |
| Skin |  | AK: Actinic keratosis |
| cSCC: Cutaneous squamous cell carcinoma |
| SCCIS:squamous cell carcinoma in situ |
| Thyroid |  | ATC: Anaplastic thyroid cancer |
| HT: Hashimoto's thyroiditis |
| PTC: Papillary thyroid cancer |
| GO ID | Tissue | Disease Stage | Description | Gene Ratio | Bg Ratio | pvalue | p.adjust | Count |
| GO:004217610 | Cervix | CC | regulation of protein catabolic process | 104/2311 | 391/18723 | 9.39e-15 | 9.36e-12 | 104 |
| GO:004586210 | Cervix | CC | positive regulation of proteolysis | 95/2311 | 372/18723 | 1.84e-12 | 6.86e-10 | 95 |
| GO:190336210 | Cervix | CC | regulation of cellular protein catabolic process | 72/2311 | 255/18723 | 5.98e-12 | 2.10e-09 | 72 |
| GO:004573210 | Cervix | CC | positive regulation of protein catabolic process | 65/2311 | 231/18723 | 7.44e-11 | 1.39e-08 | 65 |
| GO:001049810 | Cervix | CC | proteasomal protein catabolic process | 111/2311 | 490/18723 | 8.98e-11 | 1.58e-08 | 111 |
| GO:00725949 | Cervix | CC | establishment of protein localization to organelle | 99/2311 | 422/18723 | 1.23e-10 | 2.11e-08 | 99 |
| GO:000989610 | Cervix | CC | positive regulation of catabolic process | 109/2311 | 492/18723 | 5.26e-10 | 6.99e-08 | 109 |
| GO:190305010 | Cervix | CC | regulation of proteolysis involved in cellular protein catabolic process | 60/2311 | 221/18723 | 1.82e-09 | 1.98e-07 | 60 |
| GO:200005810 | Cervix | CC | regulation of ubiquitin-dependent protein catabolic process | 47/2311 | 164/18723 | 1.63e-08 | 1.25e-06 | 47 |
| GO:004316110 | Cervix | CC | proteasome-mediated ubiquitin-dependent protein catabolic process | 91/2311 | 412/18723 | 1.65e-08 | 1.25e-06 | 91 |
| GO:003133110 | Cervix | CC | positive regulation of cellular catabolic process | 91/2311 | 427/18723 | 9.64e-08 | 5.25e-06 | 91 |
| GO:190336410 | Cervix | CC | positive regulation of cellular protein catabolic process | 43/2311 | 155/18723 | 1.80e-07 | 8.28e-06 | 43 |
| GO:006113610 | Cervix | CC | regulation of proteasomal protein catabolic process | 48/2311 | 187/18723 | 4.63e-07 | 1.77e-05 | 48 |
| GO:003243410 | Cervix | CC | regulation of proteasomal ubiquitin-dependent protein catabolic process | 38/2311 | 134/18723 | 4.99e-07 | 1.88e-05 | 38 |
| GO:000660510 | Cervix | CC | protein targeting | 68/2311 | 314/18723 | 2.17e-06 | 6.55e-05 | 68 |
| GO:19030528 | Cervix | CC | positive regulation of proteolysis involved in cellular protein catabolic process | 34/2311 | 133/18723 | 2.28e-05 | 4.01e-04 | 34 |
| GO:200006010 | Cervix | CC | positive regulation of ubiquitin-dependent protein catabolic process | 29/2311 | 107/18723 | 2.77e-05 | 4.62e-04 | 29 |
| GO:00324369 | Cervix | CC | positive regulation of proteasomal ubiquitin-dependent protein catabolic process | 25/2311 | 90/18723 | 6.22e-05 | 8.90e-04 | 25 |
| GO:19018008 | Cervix | CC | positive regulation of proteasomal protein catabolic process | 29/2311 | 114/18723 | 9.71e-05 | 1.27e-03 | 29 |
| GO:00709726 | Cervix | CC | protein localization to endoplasmic reticulum | 21/2311 | 74/18723 | 1.69e-04 | 2.00e-03 | 21 |
| Hugo Symbol | Variant Class | Variant Classification | dbSNP RS | HGVSc | HGVSp | HGVSp Short | SWISSPROT | BIOTYPE | SIFT | PolyPhen | Tumor Sample Barcode | Tissue | Histology | Sex | Age | Stage | Therapy Types | Drugs | Outcome |
| ZFAND2A | SNV | Missense_Mutation | novel | c.157N>T | p.His53Tyr | p.H53Y | Q8N6M9 | protein_coding | deleterious(0.02) | benign(0) | TCGA-C5-A8XJ-01 | Cervix | cervical & endocervical cancer | Female | >=65 | I/II | Chemotherapy | cisplatin | SD |
| ZFAND2A | SNV | Missense_Mutation | | c.283N>T | p.Ile95Phe | p.I95F | Q8N6M9 | protein_coding | deleterious(0) | possibly_damaging(0.643) | TCGA-AZ-6608-01 | Colorectum | colon adenocarcinoma | Female | <65 | III/IV | Unknown | Unknown | SD |
| ZFAND2A | SNV | Missense_Mutation | novel | c.196G>T | p.Val66Leu | p.V66L | Q8N6M9 | protein_coding | tolerated(0.09) | benign(0.003) | TCGA-A5-A0G1-01 | Endometrium | uterine corpus endometrioid carcinoma | Female | >=65 | I/II | Unknown | Unknown | SD |
| ZFAND2A | SNV | Missense_Mutation | novel | c.196N>T | p.Val66Leu | p.V66L | Q8N6M9 | protein_coding | tolerated(0.09) | benign(0.003) | TCGA-A5-A0GG-01 | Endometrium | uterine corpus endometrioid carcinoma | Female | >=65 | I/II | Unknown | Unknown | SD |
| ZFAND2A | SNV | Missense_Mutation | novel | c.413G>A | p.Ser138Asn | p.S138N | Q8N6M9 | protein_coding | tolerated(0.08) | benign(0.013) | TCGA-A5-A1OF-01 | Endometrium | uterine corpus endometrioid carcinoma | Female | <65 | I/II | Unknown | Unknown | SD |
| ZFAND2A | SNV | Missense_Mutation | novel | c.26N>G | p.His9Arg | p.H9R | Q8N6M9 | protein_coding | deleterious(0.02) | possibly_damaging(0.703) | TCGA-AJ-A3BG-01 | Endometrium | uterine corpus endometrioid carcinoma | Female | >=65 | I/II | Chemotherapy | carboplatin | PD |
| ZFAND2A | SNV | Missense_Mutation | | c.91G>T | p.Asp31Tyr | p.D31Y | Q8N6M9 | protein_coding | deleterious(0.02) | possibly_damaging(0.454) | TCGA-AX-A05Z-01 | Endometrium | uterine corpus endometrioid carcinoma | Female | <65 | III/IV | Chemotherapy | adriamycin | SD |
| ZFAND2A | SNV | Missense_Mutation | novel | c.380G>T | p.Arg127Ile | p.R127I | Q8N6M9 | protein_coding | deleterious(0) | probably_damaging(1) | TCGA-AX-A2HC-01 | Endometrium | uterine corpus endometrioid carcinoma | Female | <65 | III/IV | Chemotherapy | paclitaxel | PD |
| ZFAND2A | SNV | Missense_Mutation | rs748607914 | c.295N>T | p.Arg99Cys | p.R99C | Q8N6M9 | protein_coding | deleterious(0) | probably_damaging(0.915) | TCGA-DF-A2KU-01 | Endometrium | uterine corpus endometrioid carcinoma | Female | Unknown | I/II | Unknown | Unknown | SD |
| ZFAND2A | insertion | Frame_Shift_Ins | novel | c.129_130insCCAATCAGGAAGGCAGTAAATACGCTTATTGATTTGAATAACTGCA | p.Cys44ProfsTer33 | p.C44Pfs*33 | Q8N6M9 | protein_coding | | | TCGA-A5-A0GW-01 | Endometrium | uterine corpus endometrioid carcinoma | Female | <65 | I/II | Unknown | Unknown | SD |


