
|
|||||
|
 | |
| |
| |
| |
| |
| |
|
Gene: ZFAND1 |
Gene summary for ZFAND1 |
| Gene information | Species | Human | Gene symbol | ZFAND1 | Gene ID | 79752 |
| Gene name | zinc finger AN1-type containing 1 | |
| Gene Alias | ZFAND1 | |
| Cytomap | 8q21.13 | |
| Gene Type | protein-coding | GO ID | GO:0006810 | UniProtAcc | Q8TCF1 |
Top |
Malignant transformation analysis |
| Identification of the aberrant gene expression in precancerous and cancerous lesions by comparing the gene expression of stem-like cells in diseased tissues with normal stem cells |
| Entrez ID | Symbol | Replicates | Species | Organ | Tissue | Adj P-value | Log2FC | Malignancy |
| 79752 | ZFAND1 | LZE4T | Human | Esophagus | ESCC | 3.03e-17 | 3.86e-01 | 0.0811 |
| 79752 | ZFAND1 | LZE8T | Human | Esophagus | ESCC | 7.08e-14 | 2.96e-01 | 0.067 |
| 79752 | ZFAND1 | LZE20T | Human | Esophagus | ESCC | 1.97e-07 | 3.73e-01 | 0.0662 |
| 79752 | ZFAND1 | LZE22D1 | Human | Esophagus | HGIN | 1.30e-10 | 9.75e-02 | 0.0595 |
| 79752 | ZFAND1 | LZE22T | Human | Esophagus | ESCC | 2.12e-03 | 2.62e-01 | 0.068 |
| 79752 | ZFAND1 | LZE24T | Human | Esophagus | ESCC | 5.94e-21 | 8.03e-01 | 0.0596 |
| 79752 | ZFAND1 | LZE21T | Human | Esophagus | ESCC | 6.45e-09 | 3.56e-01 | 0.0655 |
| 79752 | ZFAND1 | LZE6T | Human | Esophagus | ESCC | 1.36e-11 | 3.62e-01 | 0.0845 |
| 79752 | ZFAND1 | P1T-E | Human | Esophagus | ESCC | 1.96e-08 | 2.82e-01 | 0.0875 |
| 79752 | ZFAND1 | P2T-E | Human | Esophagus | ESCC | 1.23e-41 | 7.61e-01 | 0.1177 |
| 79752 | ZFAND1 | P4T-E | Human | Esophagus | ESCC | 1.22e-27 | 7.83e-01 | 0.1323 |
| 79752 | ZFAND1 | P5T-E | Human | Esophagus | ESCC | 8.83e-24 | 4.43e-01 | 0.1327 |
| 79752 | ZFAND1 | P8T-E | Human | Esophagus | ESCC | 7.19e-15 | 3.77e-01 | 0.0889 |
| 79752 | ZFAND1 | P9T-E | Human | Esophagus | ESCC | 9.00e-14 | 4.12e-01 | 0.1131 |
| 79752 | ZFAND1 | P10T-E | Human | Esophagus | ESCC | 1.64e-31 | 6.71e-01 | 0.116 |
| 79752 | ZFAND1 | P11T-E | Human | Esophagus | ESCC | 2.08e-09 | 5.59e-01 | 0.1426 |
| 79752 | ZFAND1 | P12T-E | Human | Esophagus | ESCC | 2.41e-29 | 7.62e-01 | 0.1122 |
| 79752 | ZFAND1 | P15T-E | Human | Esophagus | ESCC | 1.18e-27 | 6.37e-01 | 0.1149 |
| 79752 | ZFAND1 | P16T-E | Human | Esophagus | ESCC | 6.65e-62 | 1.30e+00 | 0.1153 |
| 79752 | ZFAND1 | P17T-E | Human | Esophagus | ESCC | 2.73e-12 | 5.08e-01 | 0.1278 |
| Page: 1 2 3 4 5 6 |
| Tissue | Expression Dynamics | Abbreviation |
| Esophagus | 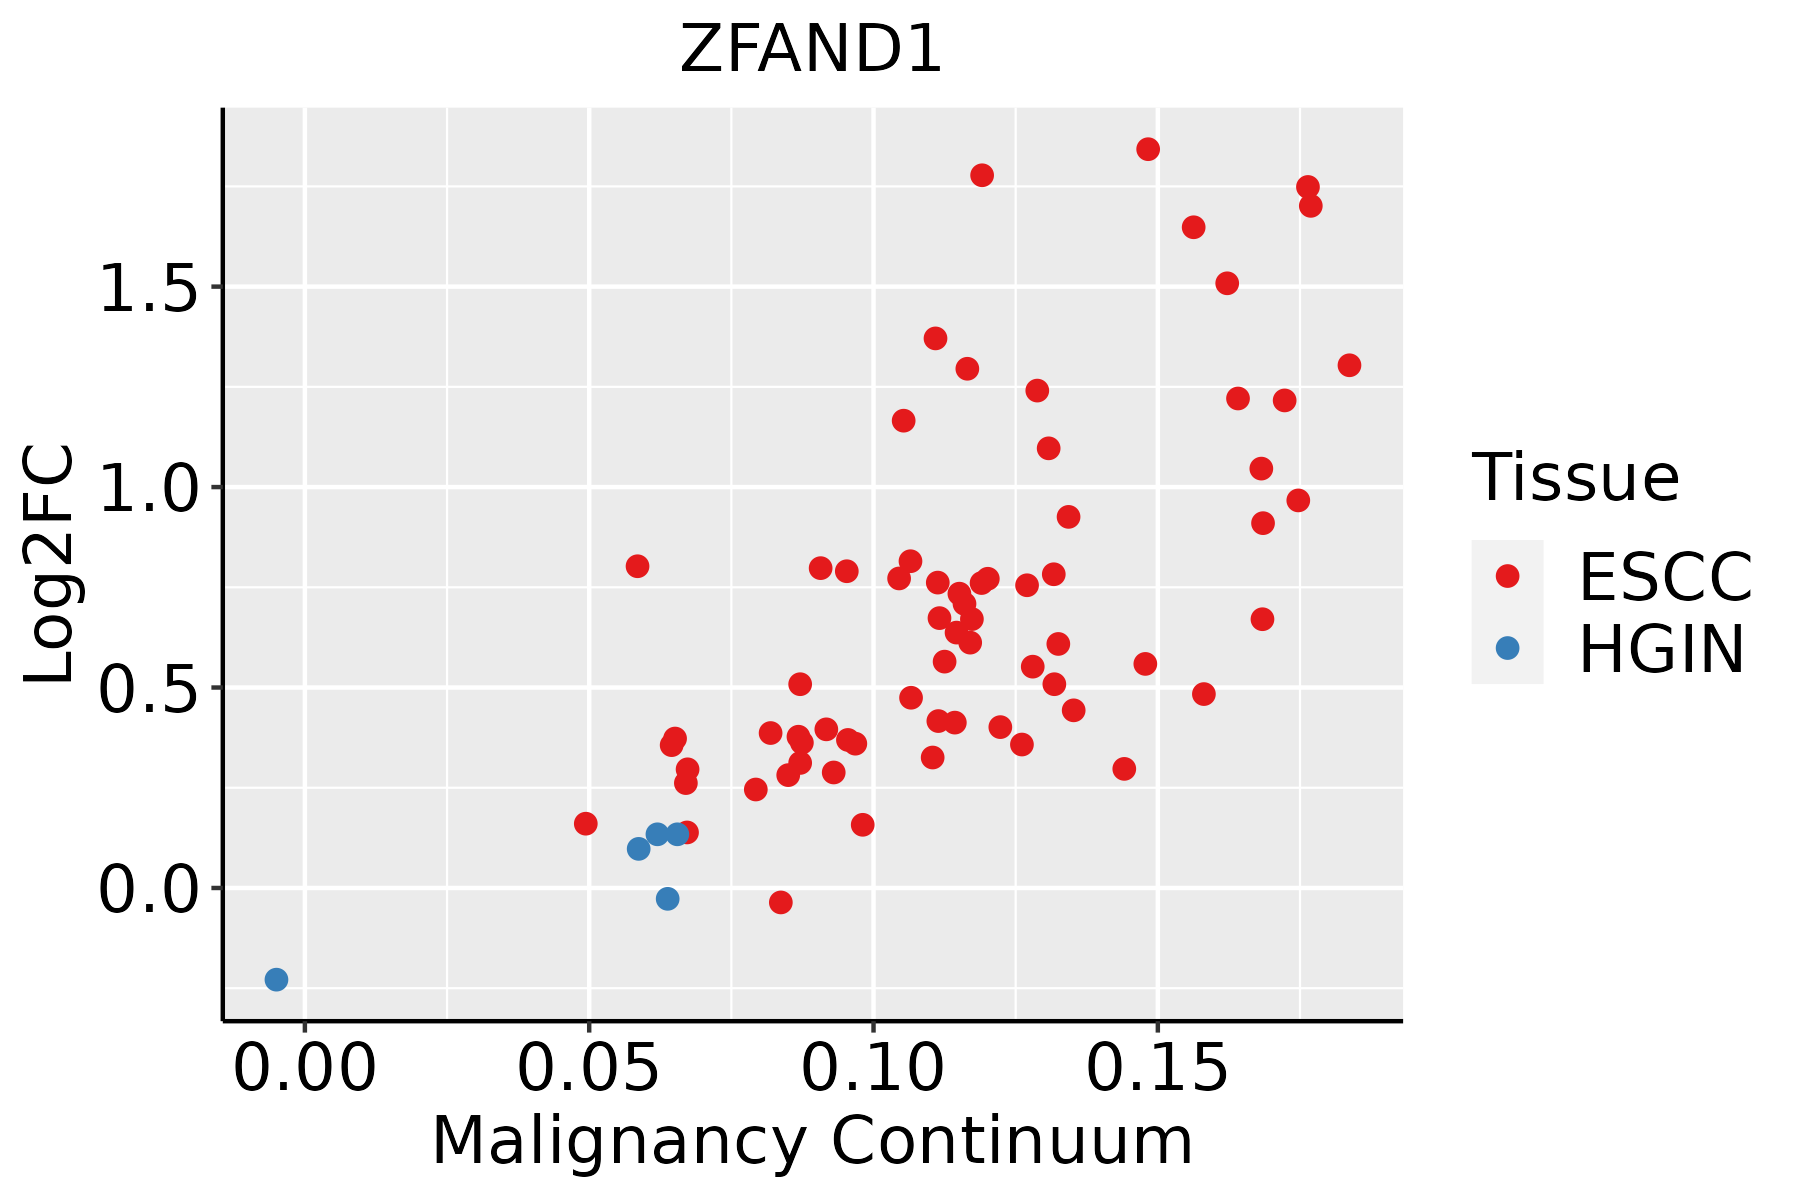 | ESCC: Esophageal squamous cell carcinoma |
| HGIN: High-grade intraepithelial neoplasias | ||
| LGIN: Low-grade intraepithelial neoplasias | ||
| Liver |  | HCC: Hepatocellular carcinoma |
| NAFLD: Non-alcoholic fatty liver disease | ||
| Oral Cavity |  | EOLP: Erosive Oral lichen planus |
| LP: leukoplakia | ||
| NEOLP: Non-erosive oral lichen planus | ||
| OSCC: Oral squamous cell carcinoma | ||
| Skin | 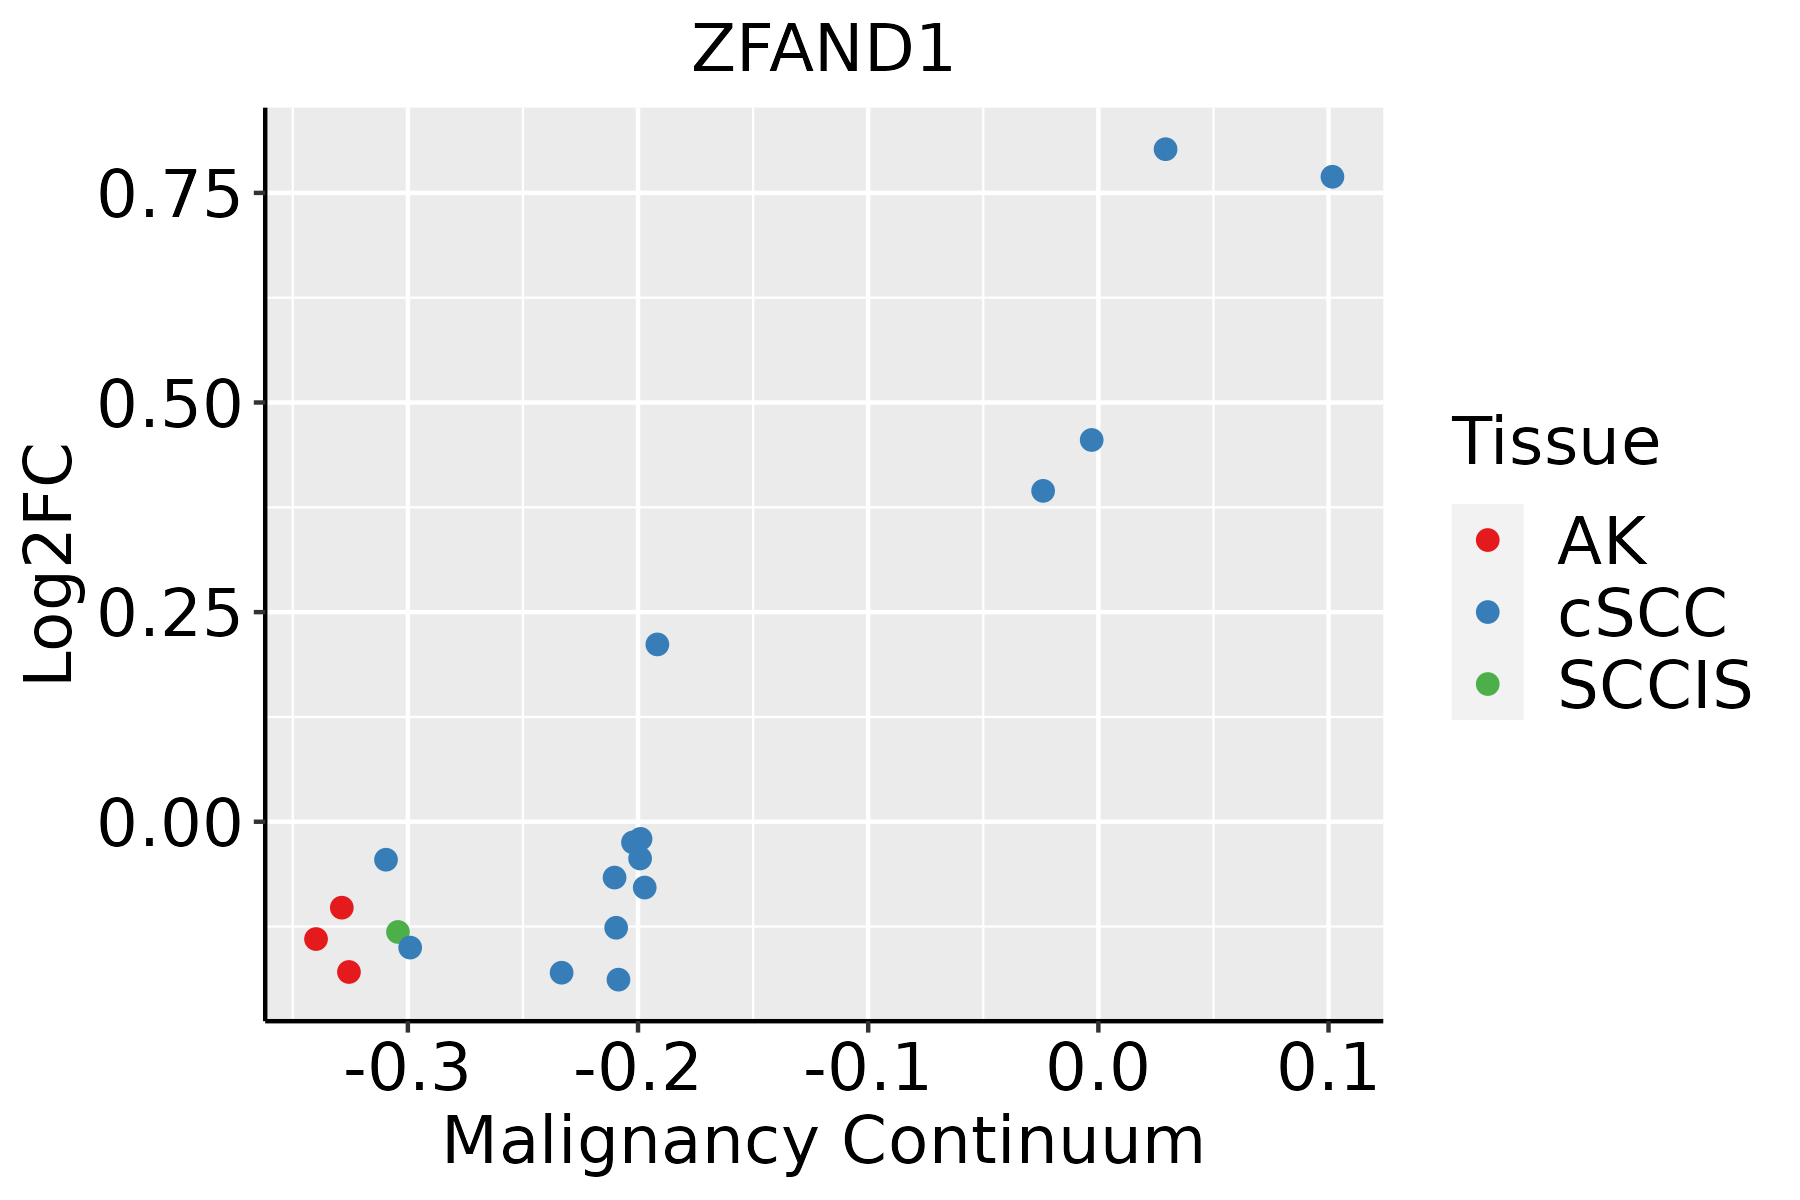 | AK: Actinic keratosis |
| cSCC: Cutaneous squamous cell carcinoma | ||
| SCCIS:squamous cell carcinoma in situ | ||
| Thyroid | 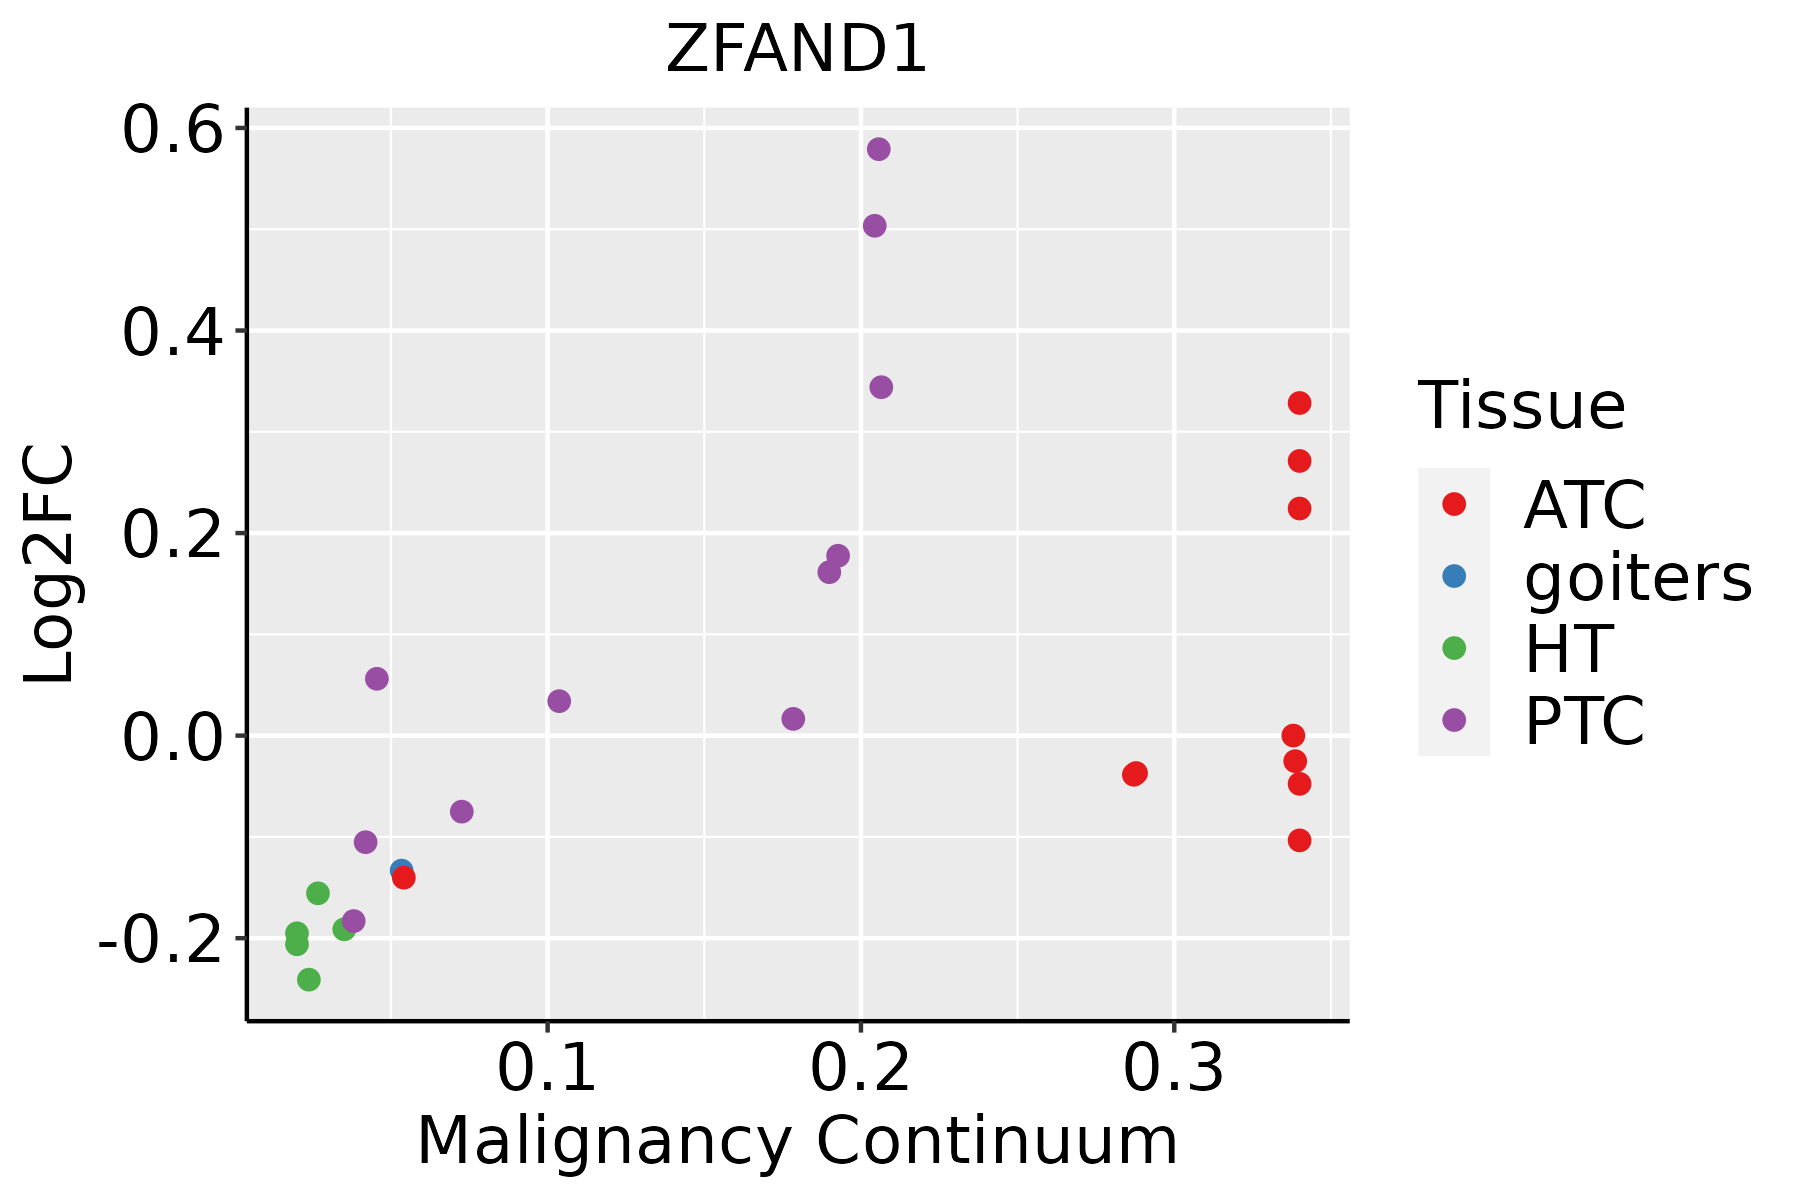 | ATC: Anaplastic thyroid cancer |
| HT: Hashimoto's thyroiditis | ||
| PTC: Papillary thyroid cancer |
| ∗log2FC in expression of this searched gene in stem-like cells from each diseased tissue sample relative to stem-like cells in normal samples in each tissue plotted against the malignancy continuum. Samples are colored based on if they are from different disease stage. |
Top |
Malignant transformation related pathway analysis |
| Find out the enriched GO biological processes and KEGG pathways involved in transition from healthy to precancer to cancer |
| Tissue | Disease Stage | Enriched GO biological Processes |
| Colorectum | AD |  |
| Colorectum | SER |  |
| Colorectum | MSS |  |
| Colorectum | MSI-H |  |
| Colorectum | FAP |  |
| ∗Top 15 enriched GO BP terms are showed in the bar plot of each disease state in each tissue. Each row represents a significant GO biological process which is colored according to the -log10(p.adjust). |
| Page: 1 2 3 4 5 6 7 8 9 |
| GO ID | Tissue | Disease Stage | Description | Gene Ratio | Bg Ratio | pvalue | p.adjust | Count |
| GO:007182627 | Esophagus | HGIN | ribonucleoprotein complex subunit organization | 84/2587 | 227/18723 | 1.34e-18 | 5.37e-16 | 84 |
| GO:002241120 | Esophagus | HGIN | cellular component disassembly | 102/2587 | 443/18723 | 8.31e-08 | 4.33e-06 | 102 |
| GO:19030089 | Esophagus | HGIN | organelle disassembly | 36/2587 | 114/18723 | 8.60e-07 | 3.58e-05 | 36 |
| GO:003238617 | Esophagus | HGIN | regulation of intracellular transport | 79/2587 | 337/18723 | 1.11e-06 | 4.36e-05 | 79 |
| GO:00712439 | Esophagus | HGIN | cellular response to arsenic-containing substance | 12/2587 | 20/18723 | 2.02e-06 | 7.39e-05 | 12 |
| GO:003315720 | Esophagus | HGIN | regulation of intracellular protein transport | 58/2587 | 229/18723 | 2.29e-06 | 8.29e-05 | 58 |
| GO:190495120 | Esophagus | HGIN | positive regulation of establishment of protein localization | 73/2587 | 319/18723 | 6.99e-06 | 2.14e-04 | 73 |
| GO:003238820 | Esophagus | HGIN | positive regulation of intracellular transport | 51/2587 | 202/18723 | 1.00e-05 | 2.92e-04 | 51 |
| GO:00466859 | Esophagus | HGIN | response to arsenic-containing substance | 15/2587 | 33/18723 | 1.08e-05 | 3.10e-04 | 15 |
| GO:009031616 | Esophagus | HGIN | positive regulation of intracellular protein transport | 42/2587 | 160/18723 | 2.18e-05 | 5.78e-04 | 42 |
| GO:005122220 | Esophagus | HGIN | positive regulation of protein transport | 67/2587 | 303/18723 | 5.13e-05 | 1.22e-03 | 67 |
| GO:003298415 | Esophagus | HGIN | protein-containing complex disassembly | 50/2587 | 224/18723 | 3.43e-04 | 5.56e-03 | 50 |
| GO:0022411111 | Esophagus | ESCC | cellular component disassembly | 305/8552 | 443/18723 | 1.94e-23 | 4.57e-21 | 305 |
| GO:003238618 | Esophagus | ESCC | regulation of intracellular transport | 243/8552 | 337/18723 | 3.20e-23 | 7.25e-21 | 243 |
| GO:0033157110 | Esophagus | ESCC | regulation of intracellular protein transport | 169/8552 | 229/18723 | 3.31e-18 | 3.23e-16 | 169 |
| GO:0032388110 | Esophagus | ESCC | positive regulation of intracellular transport | 152/8552 | 202/18723 | 7.89e-18 | 7.36e-16 | 152 |
| GO:0071826111 | Esophagus | ESCC | ribonucleoprotein complex subunit organization | 166/8552 | 227/18723 | 2.94e-17 | 2.42e-15 | 166 |
| GO:1904951111 | Esophagus | ESCC | positive regulation of establishment of protein localization | 216/8552 | 319/18723 | 1.01e-15 | 6.86e-14 | 216 |
| GO:009031617 | Esophagus | ESCC | positive regulation of intracellular protein transport | 122/8552 | 160/18723 | 2.45e-15 | 1.49e-13 | 122 |
| GO:0051222111 | Esophagus | ESCC | positive regulation of protein transport | 204/8552 | 303/18723 | 1.56e-14 | 8.38e-13 | 204 |
| Page: 1 2 3 4 5 6 |
| Pathway ID | Tissue | Disease Stage | Description | Gene Ratio | Bg Ratio | pvalue | p.adjust | qvalue | Count |
| Page: 1 |
Top |
Cell-cell communication analysis |
| Identification of potential cell-cell interactions between two cell types and their ligand-receptor pairs for different disease states |
| Ligand | Receptor | LRpair | Pathway | Tissue | Disease Stage |
| Page: 1 |
Top |
Single-cell gene regulatory network inference analysis |
| Find out the significant the regulons (TFs) and the target genes of each regulon across cell types for different disease states |
| TF | Cell Type | Tissue | Disease Stage | Target Gene | RSS | Regulon Activity |
| ∗The dot plots of a searched regulon are shown for all cell subpopulations in each disease state of each tissue based on the regulon specific score inferred using pySCENIC and by calculating the average expression. |
| Page: 1 |
Top |
Somatic mutation of malignant transformation related genes |
| Annotation of somatic variants for genes involved in malignant transformation |
| Hugo Symbol | Variant Class | Variant Classification | dbSNP RS | HGVSc | HGVSp | HGVSp Short | SWISSPROT | BIOTYPE | SIFT | PolyPhen | Tumor Sample Barcode | Tissue | Histology | Sex | Age | Stage | Therapy Types | Drugs | Outcome |
| ZFAND1 | SNV | Missense_Mutation | c.283N>C | p.Asp95His | p.D95H | Q8TCF1 | protein_coding | deleterious(0) | probably_damaging(1) | TCGA-AC-A23H-01 | Breast | breast invasive carcinoma | Female | >=65 | I/II | Unknown | Unknown | PD | |
| ZFAND1 | SNV | Missense_Mutation | c.124N>T | p.His42Tyr | p.H42Y | Q8TCF1 | protein_coding | deleterious(0) | possibly_damaging(0.847) | TCGA-BH-A0HK-01 | Breast | breast invasive carcinoma | Female | >=65 | I/II | Hormone Therapy | arimidex | SD | |
| ZFAND1 | SNV | Missense_Mutation | novel | c.739N>G | p.Asn247Asp | p.N247D | Q8TCF1 | protein_coding | tolerated(0.11) | benign(0.006) | TCGA-AA-3984-01 | Colorectum | colon adenocarcinoma | Female | <65 | I/II | Unknown | Unknown | SD |
| ZFAND1 | SNV | Missense_Mutation | c.96N>G | p.Phe32Leu | p.F32L | Q8TCF1 | protein_coding | deleterious(0.03) | probably_damaging(0.999) | TCGA-F5-6814-01 | Colorectum | rectum adenocarcinoma | Male | <65 | I/II | Unknown | Unknown | SD | |
| ZFAND1 | SNV | Missense_Mutation | novel | c.64C>A | p.Pro22Thr | p.P22T | Q8TCF1 | protein_coding | deleterious(0) | probably_damaging(1) | TCGA-A5-A0G2-01 | Endometrium | uterine corpus endometrioid carcinoma | Female | <65 | III/IV | Unknown | Unknown | SD |
| ZFAND1 | SNV | Missense_Mutation | novel | c.350N>G | p.Asp117Gly | p.D117G | Q8TCF1 | protein_coding | tolerated(0.06) | benign(0.202) | TCGA-AJ-A3EK-01 | Endometrium | uterine corpus endometrioid carcinoma | Female | <65 | I/II | Chemotherapy | carboplatin | CR |
| ZFAND1 | SNV | Missense_Mutation | c.143N>A | p.Thr48Asn | p.T48N | Q8TCF1 | protein_coding | tolerated(1) | benign(0.001) | TCGA-AJ-A3EK-01 | Endometrium | uterine corpus endometrioid carcinoma | Female | <65 | I/II | Chemotherapy | carboplatin | CR | |
| ZFAND1 | SNV | Missense_Mutation | novel | c.593C>A | p.Ser198Tyr | p.S198Y | Q8TCF1 | protein_coding | deleterious(0.01) | possibly_damaging(0.732) | TCGA-AJ-A5DW-01 | Endometrium | uterine corpus endometrioid carcinoma | Female | <65 | I/II | Unknown | Unknown | SD |
| ZFAND1 | SNV | Missense_Mutation | novel | c.410G>T | p.Ser137Ile | p.S137I | Q8TCF1 | protein_coding | tolerated(0.06) | possibly_damaging(0.467) | TCGA-AP-A1DK-01 | Endometrium | uterine corpus endometrioid carcinoma | Female | <65 | I/II | Unknown | Unknown | SD |
| ZFAND1 | SNV | Missense_Mutation | novel | c.773N>T | p.Gln258Leu | p.Q258L | Q8TCF1 | protein_coding | tolerated(0.53) | benign(0.001) | TCGA-AX-A1CE-01 | Endometrium | uterine corpus endometrioid carcinoma | Female | <65 | I/II | Unspecific | Paclitaxel | SD |
| Page: 1 2 3 |
Top |
Related drugs of malignant transformation related genes |
| Identification of chemicals and drugs interact with genes involved in malignant transfromation |
| (DGIdb 4.0) |
| Entrez ID | Symbol | Category | Interaction Types | Drug Claim Name | Drug Name | PMIDs |
| Page: 1 |

Copyright 2023-Present -The University of Texas Health Science Center at Houston |