
|
|||||
|
 | |
| |
| |
| |
| |
| |
|
Gene: ZER1 |
Gene summary for ZER1 |
| Gene information | Species | Human | Gene symbol | ZER1 | Gene ID | 10444 |
| Gene name | zyg-11 related cell cycle regulator | |
| Gene Alias | C9orf60 | |
| Cytomap | 9q34.11 | |
| Gene Type | protein-coding | GO ID | GO:0006508 | UniProtAcc | A0A024R8B0 |
Top |
Malignant transformation analysis |
| Identification of the aberrant gene expression in precancerous and cancerous lesions by comparing the gene expression of stem-like cells in diseased tissues with normal stem cells |
| Entrez ID | Symbol | Replicates | Species | Organ | Tissue | Adj P-value | Log2FC | Malignancy |
| 10444 | ZER1 | CCI_2 | Human | Cervix | CC | 2.39e-09 | 7.69e-01 | 0.5249 |
| 10444 | ZER1 | CCI_3 | Human | Cervix | CC | 1.13e-07 | 5.45e-01 | 0.516 |
| 10444 | ZER1 | HTA11_347_2000001011 | Human | Colorectum | AD | 1.01e-10 | 4.97e-01 | -0.1954 |
| 10444 | ZER1 | HTA11_411_2000001011 | Human | Colorectum | SER | 2.83e-02 | 9.48e-01 | -0.2602 |
| 10444 | ZER1 | HTA11_696_2000001011 | Human | Colorectum | AD | 3.50e-11 | 5.37e-01 | -0.1464 |
| 10444 | ZER1 | HTA11_546_2000001011 | Human | Colorectum | AD | 2.29e-02 | 3.11e-01 | -0.0842 |
| 10444 | ZER1 | A015-C-203 | Human | Colorectum | FAP | 2.96e-05 | -4.51e-02 | -0.1294 |
| 10444 | ZER1 | A002-C-205 | Human | Colorectum | FAP | 2.89e-04 | -9.88e-02 | -0.1236 |
| 10444 | ZER1 | A015-C-006 | Human | Colorectum | FAP | 2.47e-02 | 1.48e-02 | -0.0994 |
| 10444 | ZER1 | A002-C-114 | Human | Colorectum | FAP | 8.08e-03 | -1.14e-01 | -0.1561 |
| 10444 | ZER1 | A015-C-104 | Human | Colorectum | FAP | 6.12e-06 | -1.08e-01 | -0.1899 |
| 10444 | ZER1 | A001-C-014 | Human | Colorectum | FAP | 2.83e-02 | -9.96e-02 | 0.0135 |
| 10444 | ZER1 | A002-C-016 | Human | Colorectum | FAP | 5.62e-04 | -1.64e-01 | 0.0521 |
| 10444 | ZER1 | A002-C-116 | Human | Colorectum | FAP | 4.75e-08 | -1.43e-01 | -0.0452 |
| 10444 | ZER1 | A014-C-008 | Human | Colorectum | FAP | 2.78e-02 | -1.91e-01 | -0.191 |
| 10444 | ZER1 | A018-E-020 | Human | Colorectum | FAP | 1.23e-04 | -2.20e-01 | -0.2034 |
| 10444 | ZER1 | F034 | Human | Colorectum | FAP | 4.93e-04 | -1.20e-01 | -0.0665 |
| 10444 | ZER1 | HTA12-25-1 | Human | Pancreas | PDAC | 2.54e-04 | 5.91e-01 | 0.313 |
| 10444 | ZER1 | HTA12-26-1 | Human | Pancreas | PDAC | 1.39e-07 | 5.71e-01 | 0.3728 |
| 10444 | ZER1 | HTA12-29-1 | Human | Pancreas | PDAC | 2.46e-20 | 5.90e-01 | 0.3722 |
| Page: 1 |
| Tissue | Expression Dynamics | Abbreviation |
| Cervix | 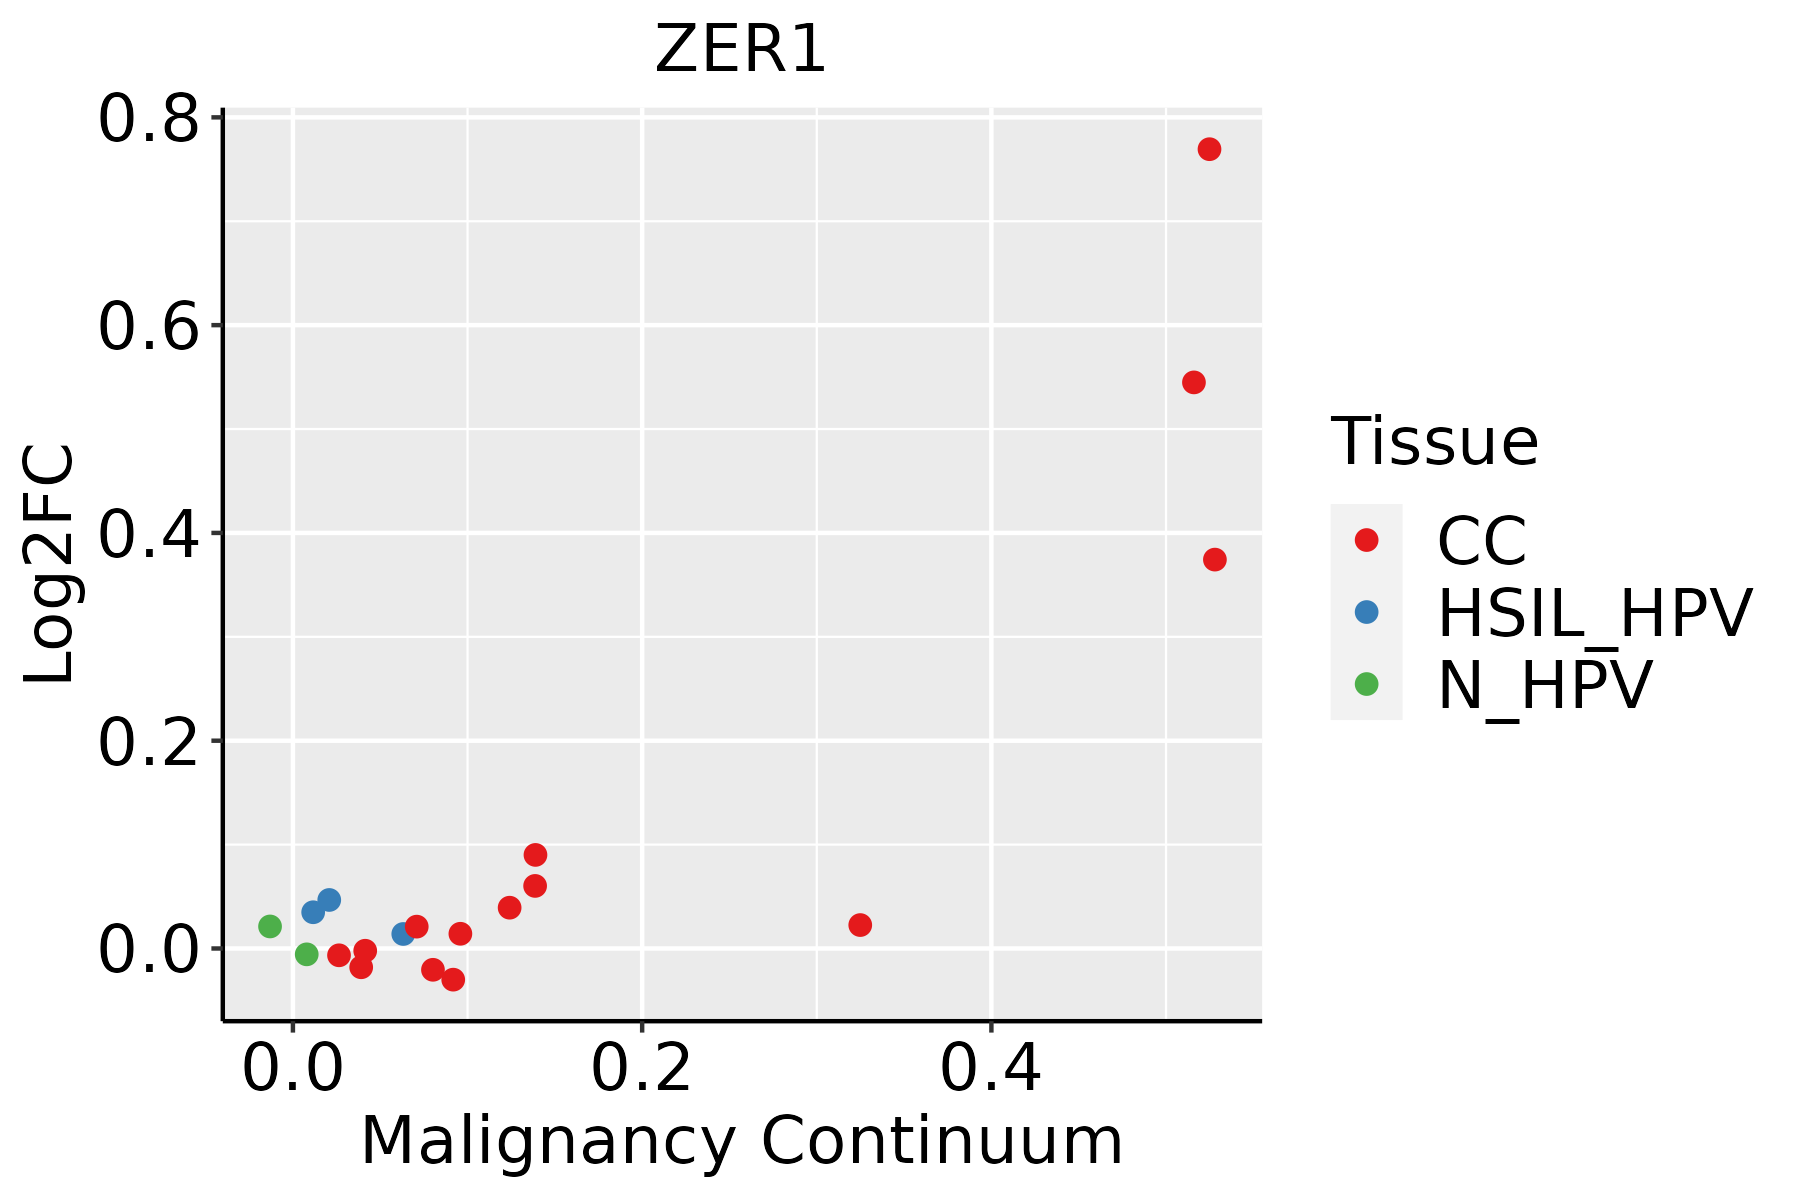 | CC: Cervix cancer |
| HSIL_HPV: HPV-infected high-grade squamous intraepithelial lesions | ||
| N_HPV: HPV-infected normal cervix | ||
| Colorectum (GSE201348) | 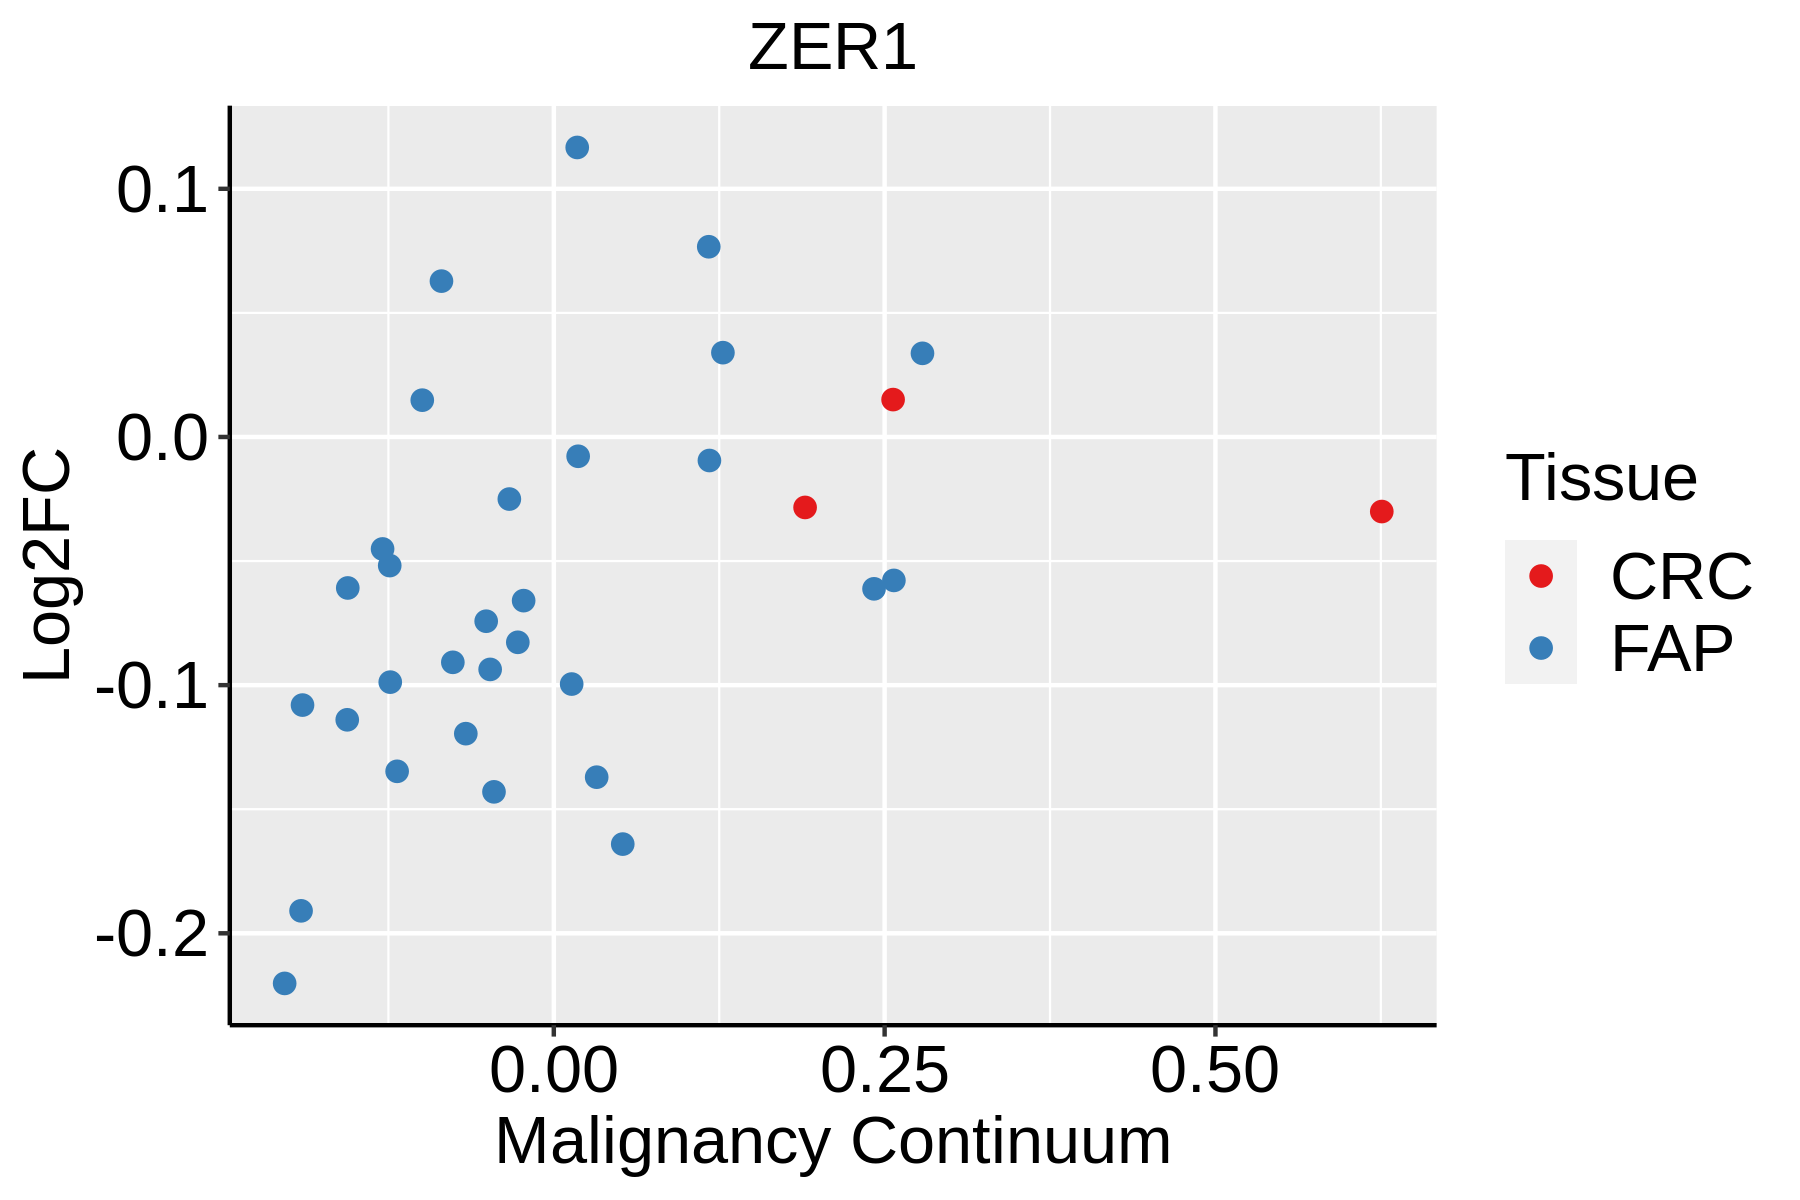 | FAP: Familial adenomatous polyposis |
| CRC: Colorectal cancer | ||
| Colorectum (HTA11) |  | AD: Adenomas |
| SER: Sessile serrated lesions | ||
| MSI-H: Microsatellite-high colorectal cancer | ||
| MSS: Microsatellite stable colorectal cancer |
| ∗log2FC in expression of this searched gene in stem-like cells from each diseased tissue sample relative to stem-like cells in normal samples in each tissue plotted against the malignancy continuum. Samples are colored based on if they are from different disease stage. |
Top |
Malignant transformation related pathway analysis |
| Find out the enriched GO biological processes and KEGG pathways involved in transition from healthy to precancer to cancer |
| Tissue | Disease Stage | Enriched GO biological Processes |
| Colorectum | AD |  |
| Colorectum | SER |  |
| Colorectum | MSS |  |
| Colorectum | MSI-H |  |
| Colorectum | FAP |  |
| ∗Top 15 enriched GO BP terms are showed in the bar plot of each disease state in each tissue. Each row represents a significant GO biological process which is colored according to the -log10(p.adjust). |
| Page: 1 2 3 4 5 6 7 8 9 |
| GO ID | Tissue | Disease Stage | Description | Gene Ratio | Bg Ratio | pvalue | p.adjust | Count |
| GO:004217610 | Cervix | CC | regulation of protein catabolic process | 104/2311 | 391/18723 | 9.39e-15 | 9.36e-12 | 104 |
| GO:004586210 | Cervix | CC | positive regulation of proteolysis | 95/2311 | 372/18723 | 1.84e-12 | 6.86e-10 | 95 |
| GO:190336210 | Cervix | CC | regulation of cellular protein catabolic process | 72/2311 | 255/18723 | 5.98e-12 | 2.10e-09 | 72 |
| GO:004573210 | Cervix | CC | positive regulation of protein catabolic process | 65/2311 | 231/18723 | 7.44e-11 | 1.39e-08 | 65 |
| GO:001049810 | Cervix | CC | proteasomal protein catabolic process | 111/2311 | 490/18723 | 8.98e-11 | 1.58e-08 | 111 |
| GO:000989610 | Cervix | CC | positive regulation of catabolic process | 109/2311 | 492/18723 | 5.26e-10 | 6.99e-08 | 109 |
| GO:190305010 | Cervix | CC | regulation of proteolysis involved in cellular protein catabolic process | 60/2311 | 221/18723 | 1.82e-09 | 1.98e-07 | 60 |
| GO:200005810 | Cervix | CC | regulation of ubiquitin-dependent protein catabolic process | 47/2311 | 164/18723 | 1.63e-08 | 1.25e-06 | 47 |
| GO:004316110 | Cervix | CC | proteasome-mediated ubiquitin-dependent protein catabolic process | 91/2311 | 412/18723 | 1.65e-08 | 1.25e-06 | 91 |
| GO:003133110 | Cervix | CC | positive regulation of cellular catabolic process | 91/2311 | 427/18723 | 9.64e-08 | 5.25e-06 | 91 |
| GO:190336410 | Cervix | CC | positive regulation of cellular protein catabolic process | 43/2311 | 155/18723 | 1.80e-07 | 8.28e-06 | 43 |
| GO:006113610 | Cervix | CC | regulation of proteasomal protein catabolic process | 48/2311 | 187/18723 | 4.63e-07 | 1.77e-05 | 48 |
| GO:003243410 | Cervix | CC | regulation of proteasomal ubiquitin-dependent protein catabolic process | 38/2311 | 134/18723 | 4.99e-07 | 1.88e-05 | 38 |
| GO:19030528 | Cervix | CC | positive regulation of proteolysis involved in cellular protein catabolic process | 34/2311 | 133/18723 | 2.28e-05 | 4.01e-04 | 34 |
| GO:200006010 | Cervix | CC | positive regulation of ubiquitin-dependent protein catabolic process | 29/2311 | 107/18723 | 2.77e-05 | 4.62e-04 | 29 |
| GO:00324369 | Cervix | CC | positive regulation of proteasomal ubiquitin-dependent protein catabolic process | 25/2311 | 90/18723 | 6.22e-05 | 8.90e-04 | 25 |
| GO:19018008 | Cervix | CC | positive regulation of proteasomal protein catabolic process | 29/2311 | 114/18723 | 9.71e-05 | 1.27e-03 | 29 |
| GO:0042176 | Colorectum | AD | regulation of protein catabolic process | 160/3918 | 391/18723 | 1.06e-19 | 7.34e-17 | 160 |
| GO:0009896 | Colorectum | AD | positive regulation of catabolic process | 180/3918 | 492/18723 | 4.33e-16 | 1.94e-13 | 180 |
| GO:1903362 | Colorectum | AD | regulation of cellular protein catabolic process | 109/3918 | 255/18723 | 2.14e-15 | 6.08e-13 | 109 |
| Page: 1 2 3 4 |
| Pathway ID | Tissue | Disease Stage | Description | Gene Ratio | Bg Ratio | pvalue | p.adjust | qvalue | Count |
| Page: 1 |
Top |
Cell-cell communication analysis |
| Identification of potential cell-cell interactions between two cell types and their ligand-receptor pairs for different disease states |
| Ligand | Receptor | LRpair | Pathway | Tissue | Disease Stage |
| Page: 1 |
Top |
Single-cell gene regulatory network inference analysis |
| Find out the significant the regulons (TFs) and the target genes of each regulon across cell types for different disease states |
| TF | Cell Type | Tissue | Disease Stage | Target Gene | RSS | Regulon Activity |
| ∗The dot plots of a searched regulon are shown for all cell subpopulations in each disease state of each tissue based on the regulon specific score inferred using pySCENIC and by calculating the average expression. |
| Page: 1 |
Top |
Somatic mutation of malignant transformation related genes |
| Annotation of somatic variants for genes involved in malignant transformation |
| Hugo Symbol | Variant Class | Variant Classification | dbSNP RS | HGVSc | HGVSp | HGVSp Short | SWISSPROT | BIOTYPE | SIFT | PolyPhen | Tumor Sample Barcode | Tissue | Histology | Sex | Age | Stage | Therapy Types | Drugs | Outcome |
| ZER1 | SNV | Missense_Mutation | c.1048N>A | p.Asp350Asn | p.D350N | Q7Z7L7 | protein_coding | tolerated(0.15) | benign(0.08) | TCGA-BH-A0HF-01 | Breast | breast invasive carcinoma | Female | >=65 | I/II | Hormone Therapy | arimidex | SD | |
| ZER1 | SNV | Missense_Mutation | c.974N>T | p.Pro325Leu | p.P325L | Q7Z7L7 | protein_coding | deleterious(0) | benign(0.435) | TCGA-C8-A12W-01 | Breast | breast invasive carcinoma | Female | <65 | III/IV | Unknown | Unknown | SD | |
| ZER1 | insertion | Frame_Shift_Ins | novel | c.1917_1918insAGCTTGGG | p.His640SerfsTer36 | p.H640Sfs*36 | Q7Z7L7 | protein_coding | TCGA-A8-A07R-01 | Breast | breast invasive carcinoma | Female | >=65 | III/IV | Ancillary | zoledronic | SD | ||
| ZER1 | insertion | Frame_Shift_Ins | novel | c.1915_1916insGCGTCCAGCTGAGCCCAAGATTTCAAGA | p.Ser639CysfsTer15 | p.S639Cfs*15 | Q7Z7L7 | protein_coding | TCGA-A8-A07R-01 | Breast | breast invasive carcinoma | Female | >=65 | III/IV | Ancillary | zoledronic | SD | ||
| ZER1 | insertion | Frame_Shift_Ins | novel | c.2163_2164insGCTTTCACTGCAGCATCTAAAATGTCACCGCCTCCAGTTCTCGAGTT | p.Ile722AlafsTer25 | p.I722Afs*25 | Q7Z7L7 | protein_coding | TCGA-AO-A0J9-01 | Breast | breast invasive carcinoma | Female | <65 | III/IV | Chemotherapy | cyclophosphamide | PD | ||
| ZER1 | SNV | Missense_Mutation | novel | c.1837N>C | p.Phe613Leu | p.F613L | Q7Z7L7 | protein_coding | deleterious(0.01) | probably_damaging(0.982) | TCGA-2W-A8YY-01 | Cervix | cervical & endocervical cancer | Female | <65 | I/II | Chemotherapy | cisplatin | CR |
| ZER1 | SNV | Missense_Mutation | rs754228946 | c.1099N>T | p.Arg367Trp | p.R367W | Q7Z7L7 | protein_coding | deleterious(0) | probably_damaging(0.985) | TCGA-C5-A1MP-01 | Cervix | cervical & endocervical cancer | Female | <65 | I/II | Unknown | Unknown | SD |
| ZER1 | SNV | Missense_Mutation | novel | c.2261G>A | p.Cys754Tyr | p.C754Y | Q7Z7L7 | protein_coding | deleterious(0) | probably_damaging(0.979) | TCGA-C5-A3HD-01 | Cervix | cervical & endocervical cancer | Female | <65 | I/II | Chemotherapy | cisplatin | SD |
| ZER1 | SNV | Missense_Mutation | novel | c.1829N>T | p.Thr610Ile | p.T610I | Q7Z7L7 | protein_coding | deleterious(0) | probably_damaging(0.997) | TCGA-EK-A2R9-01 | Cervix | cervical & endocervical cancer | Female | <65 | I/II | Unknown | Unknown | SD |
| ZER1 | SNV | Missense_Mutation | novel | c.463N>C | p.Glu155Gln | p.E155Q | Q7Z7L7 | protein_coding | tolerated(0.05) | benign(0.094) | TCGA-HM-A4S6-01 | Cervix | cervical & endocervical cancer | Female | <65 | III/IV | Chemotherapy | cisplatin | CR |
| Page: 1 2 3 4 5 6 7 |
Top |
Related drugs of malignant transformation related genes |
| Identification of chemicals and drugs interact with genes involved in malignant transfromation |
| (DGIdb 4.0) |
| Entrez ID | Symbol | Category | Interaction Types | Drug Claim Name | Drug Name | PMIDs |
| Page: 1 |

Copyright 2023-Present -The University of Texas Health Science Center at Houston |