| Tissue | Expression Dynamics | Abbreviation |
| Cervix | 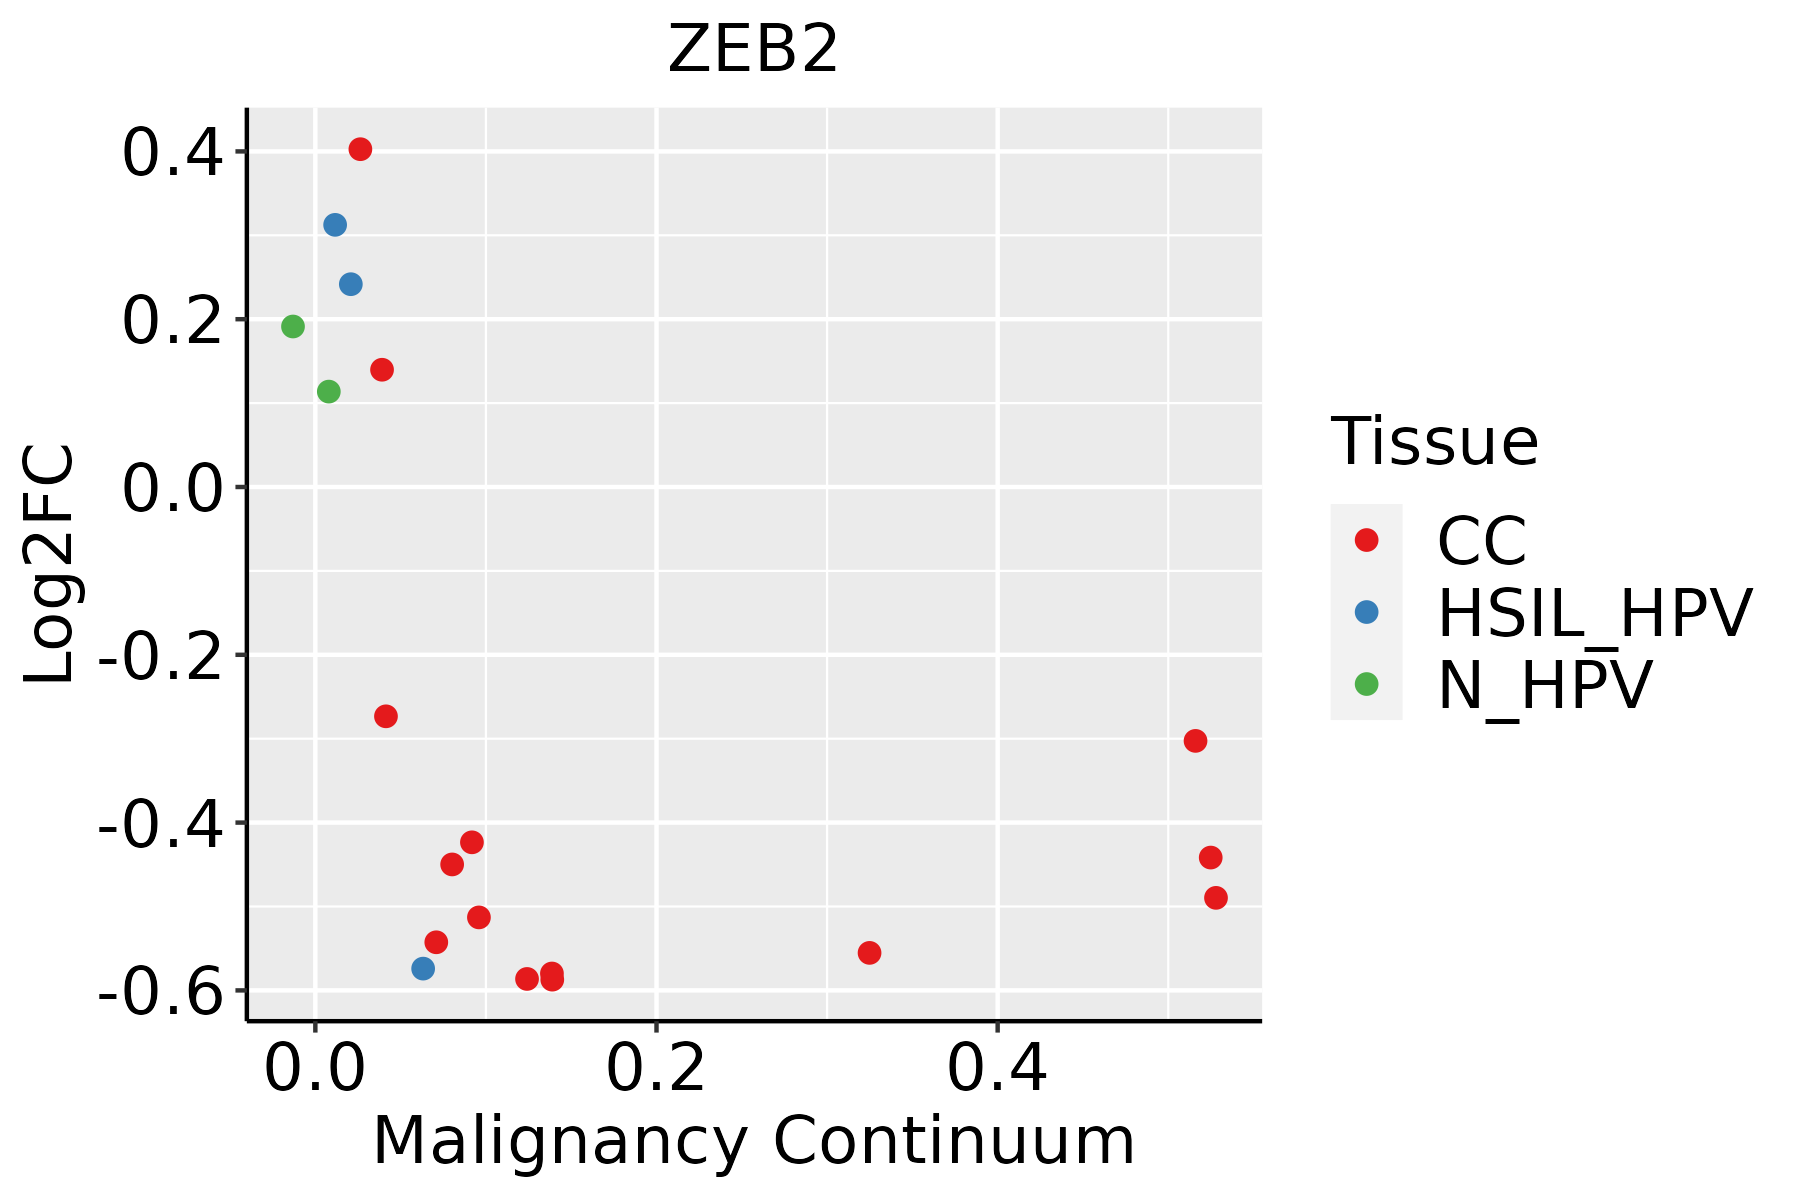 | CC: Cervix cancer |
| HSIL_HPV: HPV-infected high-grade squamous intraepithelial lesions |
| N_HPV: HPV-infected normal cervix |
| Esophagus | 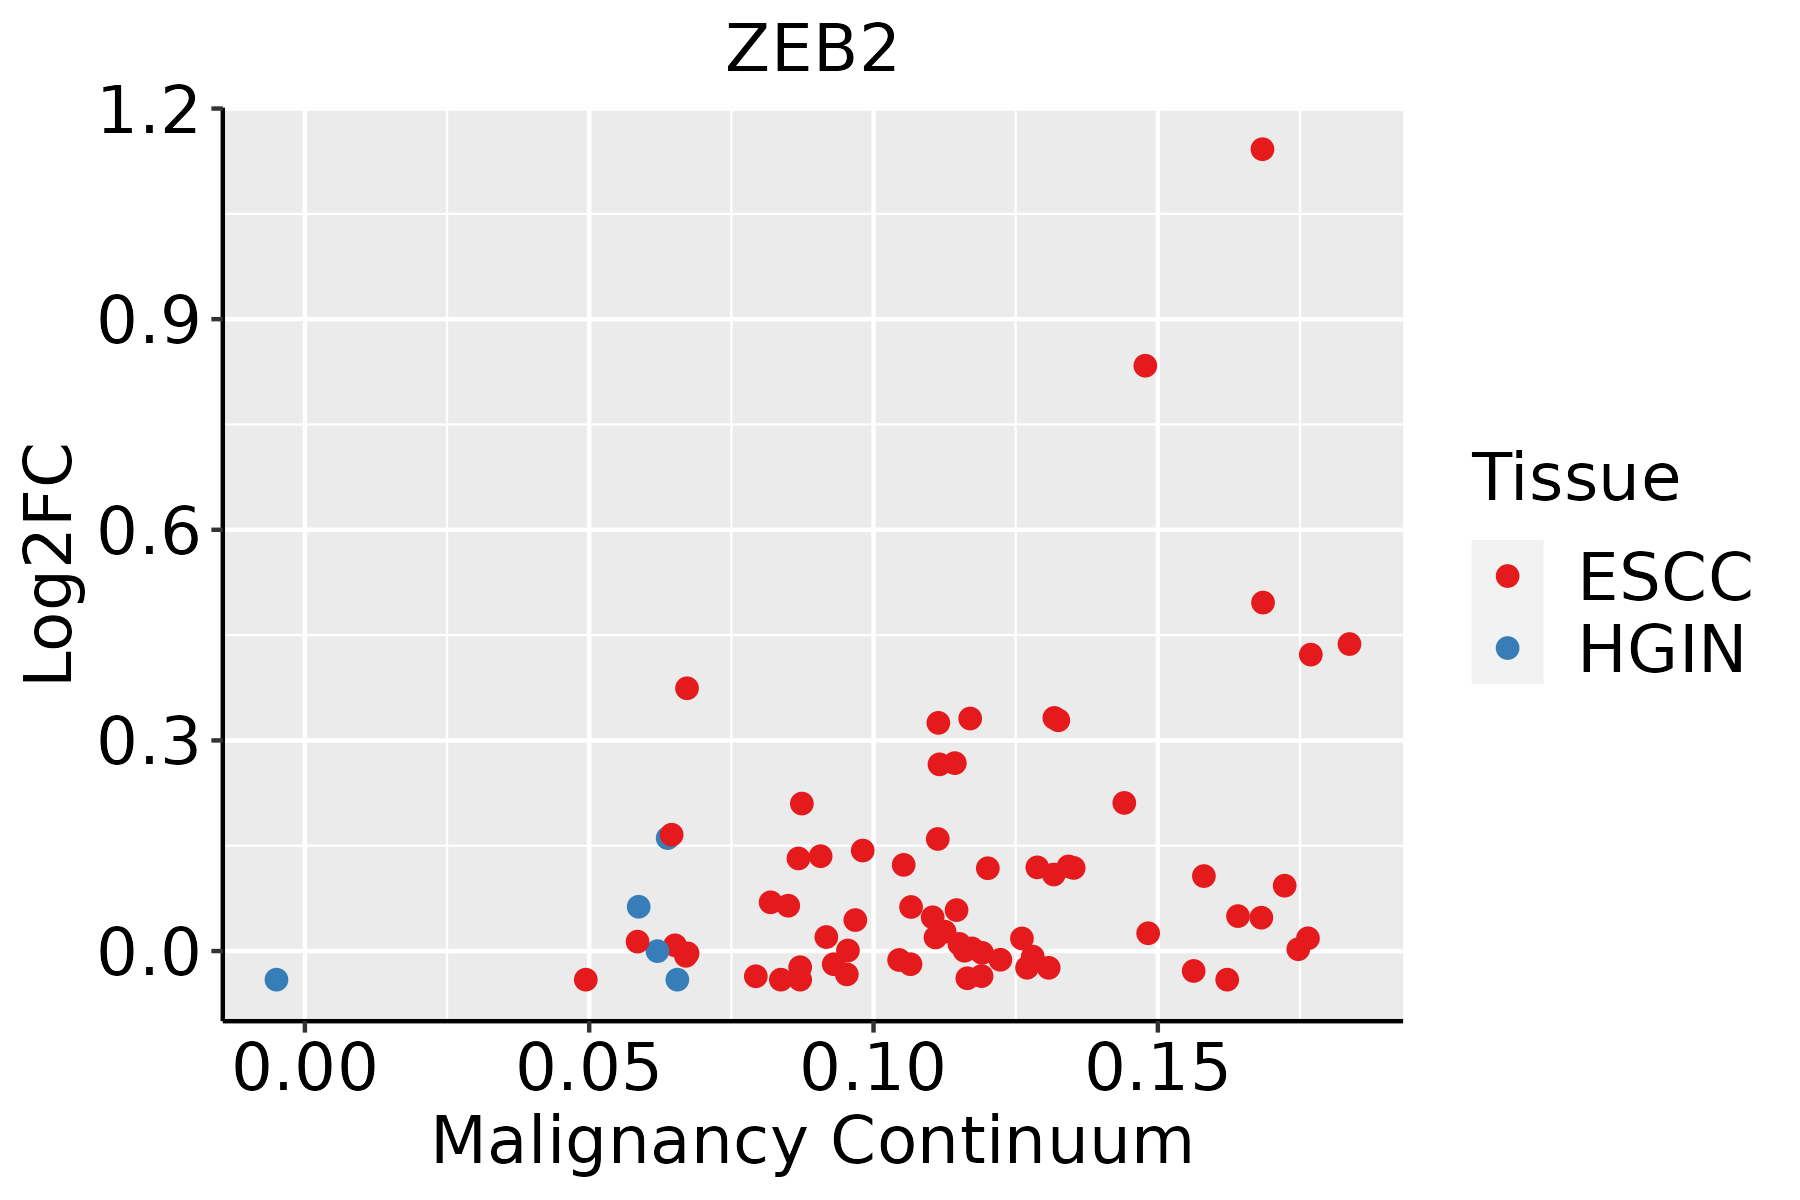 | ESCC: Esophageal squamous cell carcinoma |
| HGIN: High-grade intraepithelial neoplasias |
| LGIN: Low-grade intraepithelial neoplasias |
| Oral Cavity | 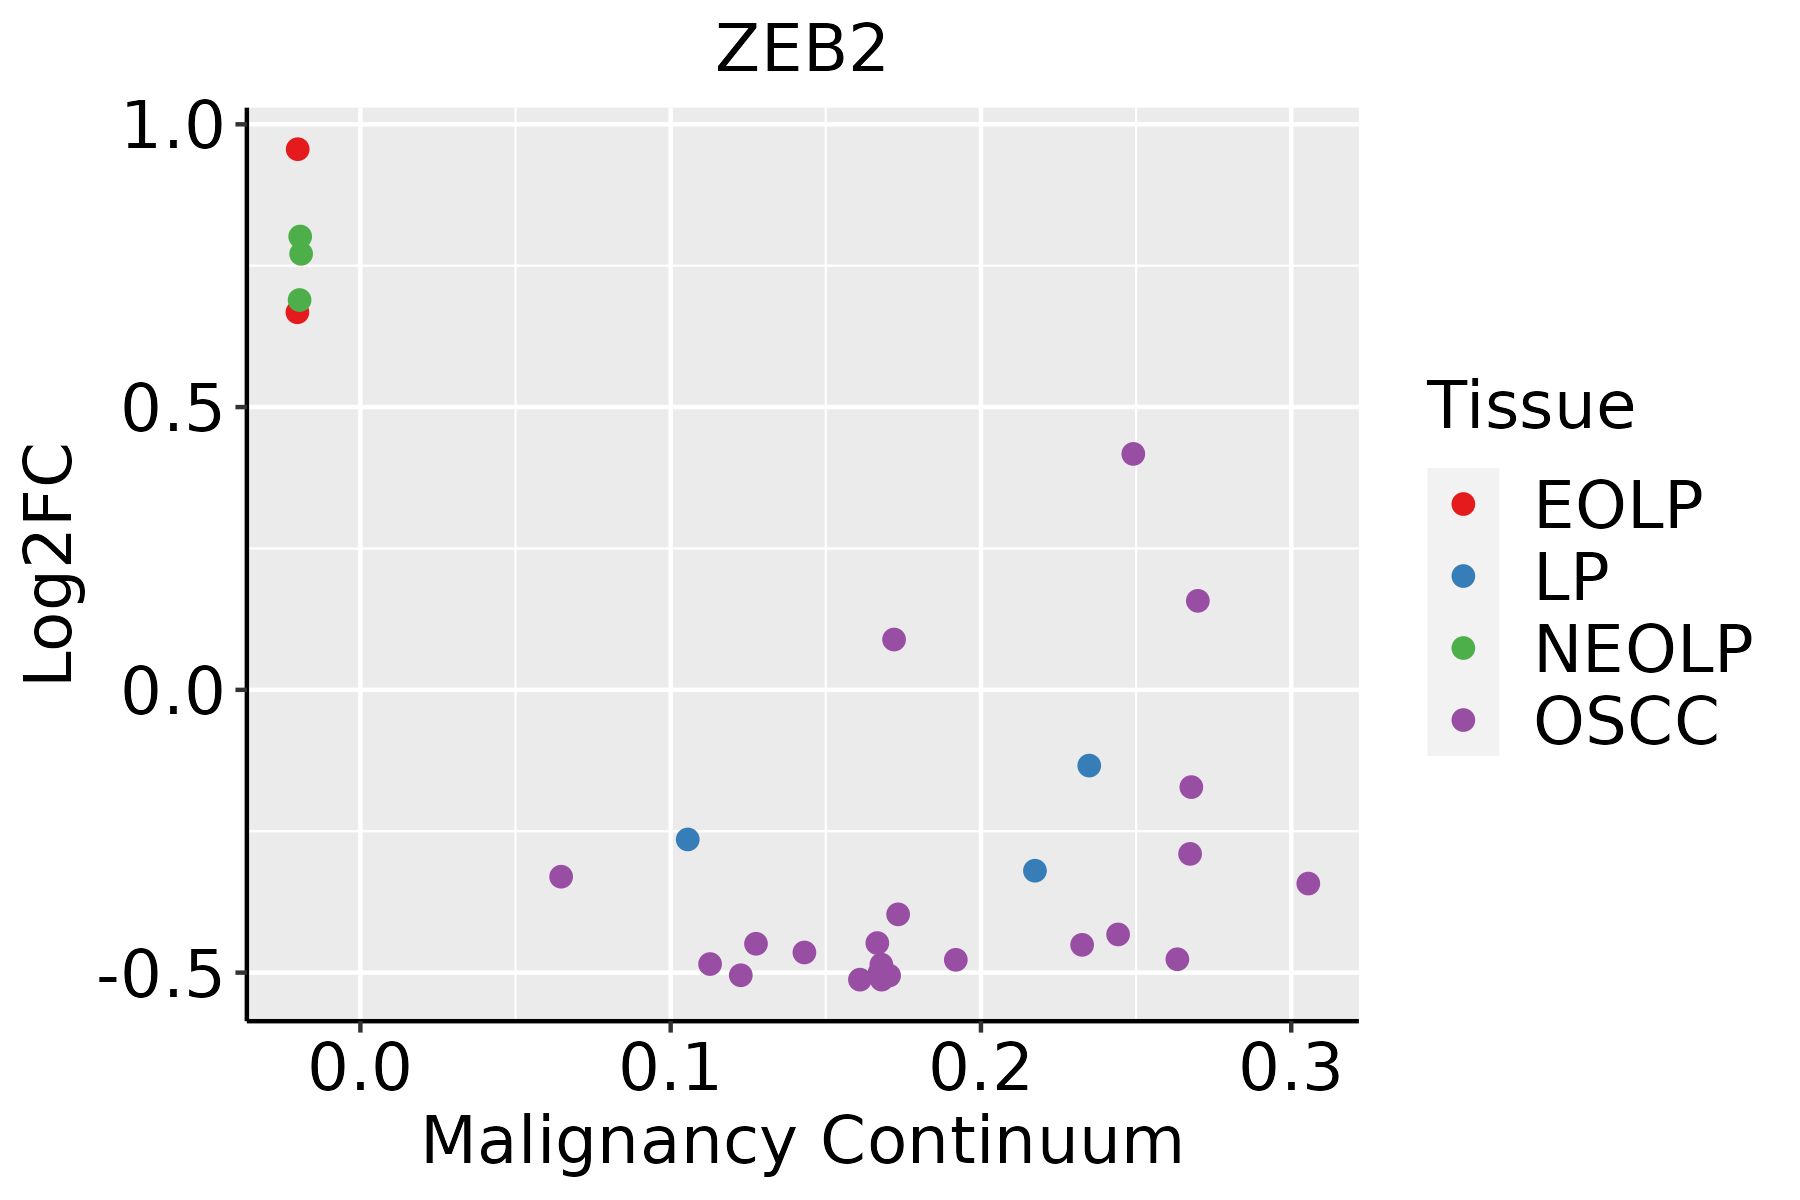 | EOLP: Erosive Oral lichen planus |
| LP: leukoplakia |
| NEOLP: Non-erosive oral lichen planus |
| OSCC: Oral squamous cell carcinoma |
| Thyroid | 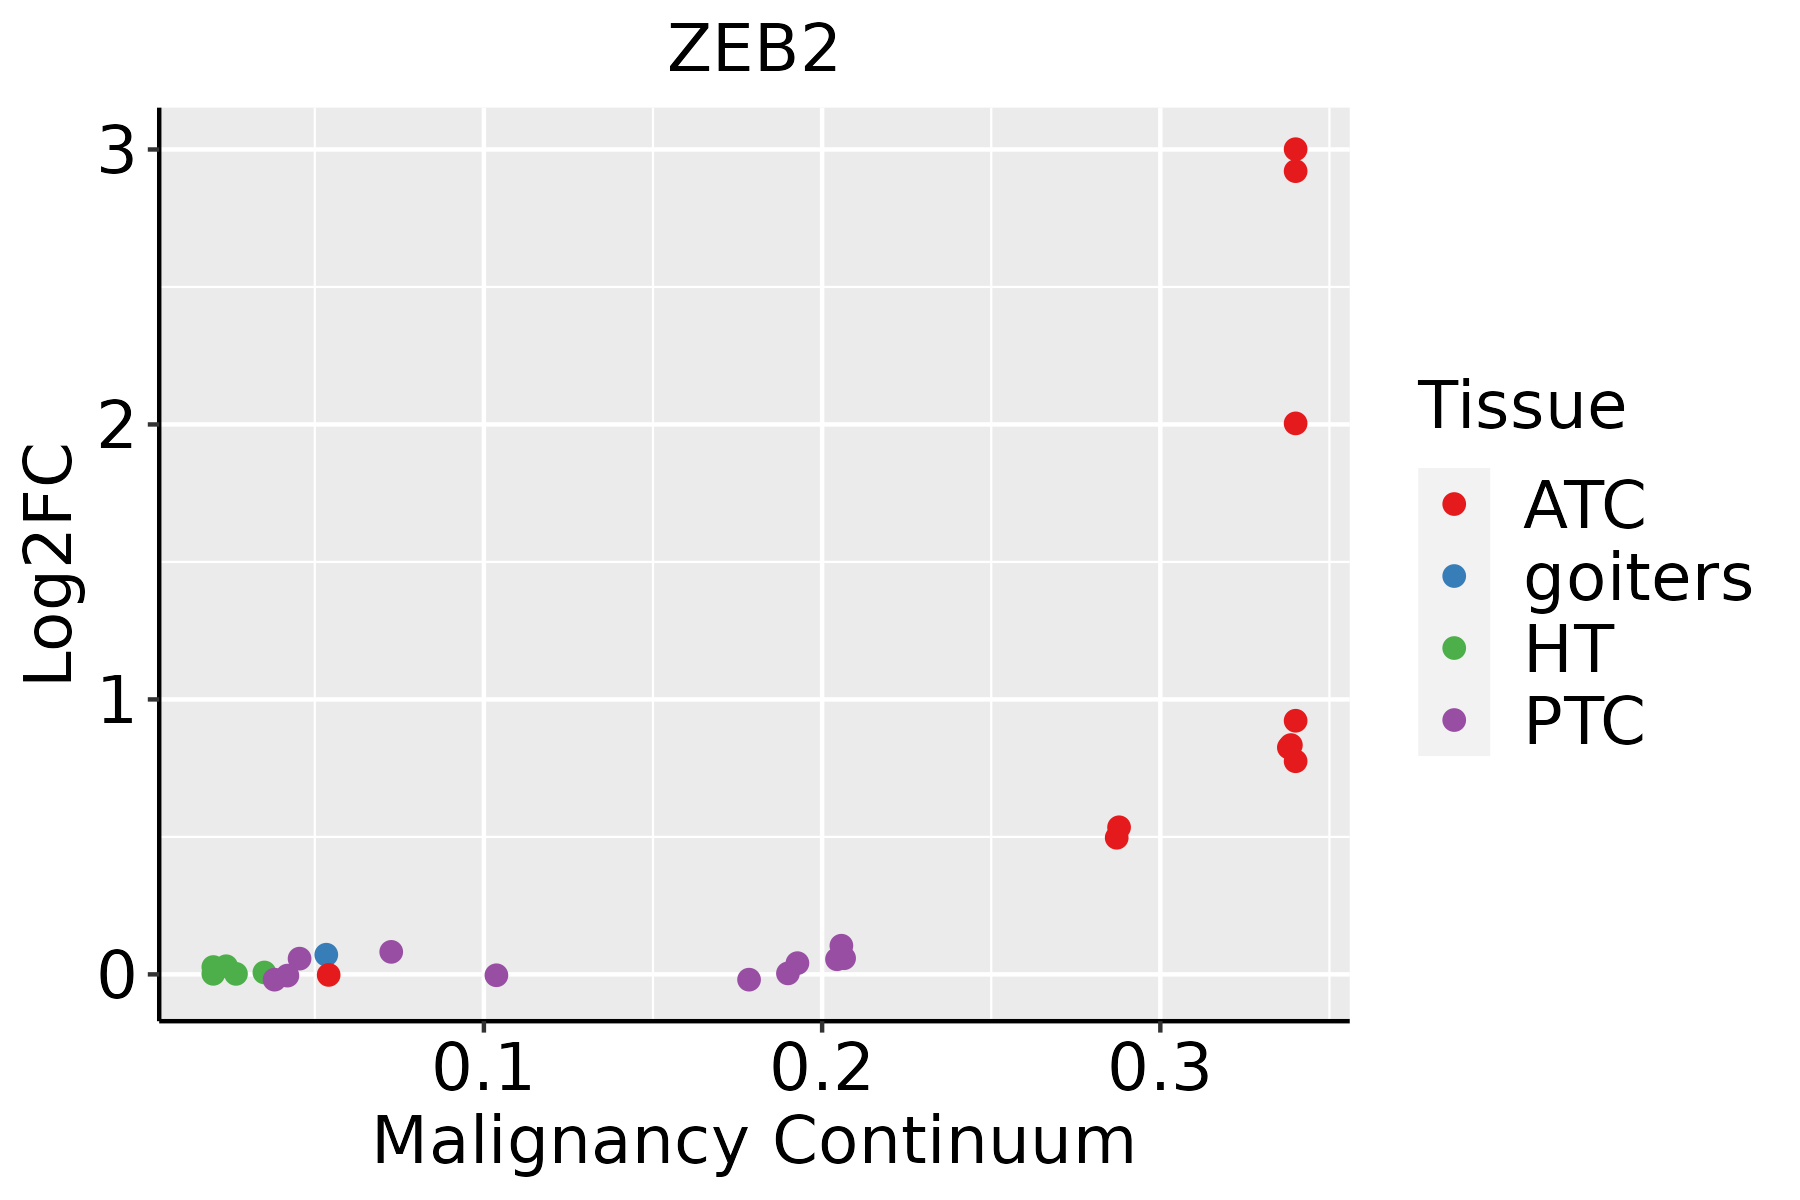 | ATC: Anaplastic thyroid cancer |
| HT: Hashimoto's thyroiditis |
| PTC: Papillary thyroid cancer |
| GO ID | Tissue | Disease Stage | Description | Gene Ratio | Bg Ratio | pvalue | p.adjust | Count |
| GO:009013210 | Cervix | CC | epithelium migration | 90/2311 | 360/18723 | 2.45e-11 | 6.11e-09 | 90 |
| GO:00016679 | Cervix | CC | ameboidal-type cell migration | 110/2311 | 475/18723 | 2.66e-11 | 6.36e-09 | 110 |
| GO:001063110 | Cervix | CC | epithelial cell migration | 89/2311 | 357/18723 | 3.72e-11 | 8.54e-09 | 89 |
| GO:009013010 | Cervix | CC | tissue migration | 90/2311 | 365/18723 | 5.42e-11 | 1.05e-08 | 90 |
| GO:00160557 | Cervix | CC | Wnt signaling pathway | 98/2311 | 444/18723 | 4.82e-09 | 4.65e-07 | 98 |
| GO:01987387 | Cervix | CC | cell-cell signaling by wnt | 98/2311 | 446/18723 | 6.16e-09 | 5.58e-07 | 98 |
| GO:00301117 | Cervix | CC | regulation of Wnt signaling pathway | 76/2311 | 328/18723 | 3.05e-08 | 2.08e-06 | 76 |
| GO:00608287 | Cervix | CC | regulation of canonical Wnt signaling pathway | 58/2311 | 253/18723 | 1.83e-06 | 5.89e-05 | 58 |
| GO:00600707 | Cervix | CC | canonical Wnt signaling pathway | 66/2311 | 303/18723 | 2.47e-06 | 7.35e-05 | 66 |
| GO:00071786 | Cervix | CC | transmembrane receptor protein serine/threonine kinase signaling pathway | 67/2311 | 355/18723 | 2.39e-04 | 2.67e-03 | 67 |
| GO:00715595 | Cervix | CC | response to transforming growth factor beta | 50/2311 | 256/18723 | 6.31e-04 | 5.91e-03 | 50 |
| GO:00715605 | Cervix | CC | cellular response to transforming growth factor beta stimulus | 49/2311 | 250/18723 | 6.55e-04 | 6.05e-03 | 49 |
| GO:00301776 | Cervix | CC | positive regulation of Wnt signaling pathway | 31/2311 | 140/18723 | 8.01e-04 | 7.02e-03 | 31 |
| GO:00160506 | Cervix | CC | vesicle organization | 54/2311 | 300/18723 | 2.71e-03 | 1.85e-02 | 54 |
| GO:00071795 | Cervix | CC | transforming growth factor beta receptor signaling pathway | 38/2311 | 198/18723 | 3.62e-03 | 2.31e-02 | 38 |
| GO:00902636 | Cervix | CC | positive regulation of canonical Wnt signaling pathway | 22/2311 | 106/18723 | 9.52e-03 | 4.72e-02 | 22 |
| GO:001063113 | Cervix | HSIL_HPV | epithelial cell migration | 33/737 | 357/18723 | 5.28e-06 | 2.04e-04 | 33 |
| GO:000166715 | Cervix | HSIL_HPV | ameboidal-type cell migration | 40/737 | 475/18723 | 5.48e-06 | 2.07e-04 | 40 |
| GO:009013213 | Cervix | HSIL_HPV | epithelium migration | 33/737 | 360/18723 | 6.31e-06 | 2.29e-04 | 33 |
| GO:009013013 | Cervix | HSIL_HPV | tissue migration | 33/737 | 365/18723 | 8.43e-06 | 2.97e-04 | 33 |
| Hugo Symbol | Variant Class | Variant Classification | dbSNP RS | HGVSc | HGVSp | HGVSp Short | SWISSPROT | BIOTYPE | SIFT | PolyPhen | Tumor Sample Barcode | Tissue | Histology | Sex | Age | Stage | Therapy Types | Drugs | Outcome |
| ZEB2 | SNV | Missense_Mutation | novel | c.2669N>A | p.Ser890Asn | p.S890N | O60315 | protein_coding | deleterious(0.05) | benign(0.035) | TCGA-3C-AAAU-01 | Breast | breast invasive carcinoma | Female | <65 | I/II | Chemotherapy | zoladex | SD |
| ZEB2 | SNV | Missense_Mutation | novel | c.3206C>T | p.Ser1069Leu | p.S1069L | O60315 | protein_coding | deleterious(0) | probably_damaging(0.968) | TCGA-5L-AAT1-01 | Breast | breast invasive carcinoma | Female | <65 | III/IV | Hormone Therapy | letrozol | SD |
| ZEB2 | SNV | Missense_Mutation | novel | c.1827G>C | p.Glu609Asp | p.E609D | O60315 | protein_coding | tolerated(0.23) | probably_damaging(0.989) | TCGA-5L-AAT1-01 | Breast | breast invasive carcinoma | Female | <65 | III/IV | Hormone Therapy | letrozol | SD |
| ZEB2 | SNV | Missense_Mutation | novel | c.34N>G | p.Cys12Gly | p.C12G | O60315 | protein_coding | deleterious(0.01) | benign(0.007) | TCGA-A2-A04P-01 | Breast | breast invasive carcinoma | Female | <65 | III/IV | Chemotherapy | taxol | PD |
| ZEB2 | SNV | Missense_Mutation | | c.3289N>A | p.Glu1097Lys | p.E1097K | O60315 | protein_coding | tolerated(0.17) | probably_damaging(0.972) | TCGA-A8-A092-01 | Breast | breast invasive carcinoma | Female | <65 | III/IV | Chemotherapy | paclitaxel | CR |
| ZEB2 | SNV | Missense_Mutation | | c.3280N>A | p.Glu1094Lys | p.E1094K | O60315 | protein_coding | deleterious(0.02) | benign(0.444) | TCGA-A8-A09G-01 | Breast | breast invasive carcinoma | Female | >=65 | III/IV | Unknown | Unknown | SD |
| ZEB2 | SNV | Missense_Mutation | | c.270G>T | p.Glu90Asp | p.E90D | O60315 | protein_coding | tolerated(0.91) | benign(0) | TCGA-AR-A250-01 | Breast | breast invasive carcinoma | Female | <65 | I/II | Chemotherapy | doxorubicin | SD |
| ZEB2 | SNV | Missense_Mutation | | c.1204N>C | p.Val402Leu | p.V402L | O60315 | protein_coding | tolerated(0.39) | benign(0) | TCGA-BH-A0AV-01 | Breast | breast invasive carcinoma | Female | <65 | I/II | Chemotherapy | taxotere | CR |
| ZEB2 | SNV | Missense_Mutation | | c.3547N>A | p.Glu1183Lys | p.E1183K | O60315 | protein_coding | tolerated_low_confidence(0.1) | benign(0.039) | TCGA-BH-A0B3-01 | Breast | breast invasive carcinoma | Female | <65 | I/II | Chemotherapy | cyclophosphamide | SD |
| ZEB2 | SNV | Missense_Mutation | rs730881174 | c.905N>A | p.Arg302Gln | p.R302Q | O60315 | protein_coding | deleterious(0) | probably_damaging(0.979) | TCGA-BH-A0HI-01 | Breast | breast invasive carcinoma | Female | >=65 | I/II | Hormone Therapy | arimidex | SD |


