
|
|||||
|
 | |
| |
| |
| |
| |
| |
|
Gene: ZEB1 |
Gene summary for ZEB1 |
| Gene information | Species | Human | Gene symbol | ZEB1 | Gene ID | 6935 |
| Gene name | zinc finger E-box binding homeobox 1 | |
| Gene Alias | AREB6 | |
| Cytomap | 10p11.22 | |
| Gene Type | protein-coding | GO ID | GO:0000122 | UniProtAcc | B2RBI8 |
Top |
Malignant transformation analysis |
| Identification of the aberrant gene expression in precancerous and cancerous lesions by comparing the gene expression of stem-like cells in diseased tissues with normal stem cells |
| Entrez ID | Symbol | Replicates | Species | Organ | Tissue | Adj P-value | Log2FC | Malignancy |
| 6935 | ZEB1 | NAFLD1 | Human | Liver | NAFLD | 9.87e-08 | 8.87e-01 | -0.04 |
| 6935 | ZEB1 | HCC1_Meng | Human | Liver | HCC | 3.36e-31 | -1.25e-01 | 0.0246 |
| 6935 | ZEB1 | HCC2_Meng | Human | Liver | HCC | 8.04e-04 | -1.90e-01 | 0.0107 |
| 6935 | ZEB1 | cirrhotic2 | Human | Liver | Cirrhotic | 9.53e-05 | -1.85e-01 | 0.0201 |
| 6935 | ZEB1 | HCC1 | Human | Liver | HCC | 5.23e-03 | 4.56e+00 | 0.5336 |
| 6935 | ZEB1 | HCC2 | Human | Liver | HCC | 6.96e-04 | 2.40e+00 | 0.5341 |
| 6935 | ZEB1 | Pt13.b | Human | Liver | HCC | 8.90e-03 | -2.83e-02 | 0.0251 |
| 6935 | ZEB1 | S014 | Human | Liver | HCC | 4.40e-11 | 4.60e-01 | 0.2254 |
| 6935 | ZEB1 | S015 | Human | Liver | HCC | 1.52e-09 | 5.51e-01 | 0.2375 |
| 6935 | ZEB1 | S016 | Human | Liver | HCC | 4.25e-06 | 3.11e-01 | 0.2243 |
| 6935 | ZEB1 | S028 | Human | Liver | HCC | 1.09e-04 | 2.78e-01 | 0.2503 |
| 6935 | ZEB1 | S029 | Human | Liver | HCC | 7.89e-04 | 3.84e-01 | 0.2581 |
| 6935 | ZEB1 | C43 | Human | Oral cavity | OSCC | 6.29e-04 | -3.27e-01 | 0.1704 |
| 6935 | ZEB1 | C46 | Human | Oral cavity | OSCC | 9.80e-05 | -3.45e-01 | 0.1673 |
| 6935 | ZEB1 | C08 | Human | Oral cavity | OSCC | 3.02e-04 | -3.23e-01 | 0.1919 |
| 6935 | ZEB1 | EOLP-1 | Human | Oral cavity | EOLP | 1.69e-19 | 5.60e-01 | -0.0202 |
| 6935 | ZEB1 | NEOLP-1 | Human | Oral cavity | NEOLP | 3.65e-19 | 6.20e-01 | -0.0194 |
| 6935 | ZEB1 | NEOLP-2 | Human | Oral cavity | NEOLP | 2.00e-19 | 5.61e-01 | -0.0196 |
| 6935 | ZEB1 | NEOLP-3 | Human | Oral cavity | NEOLP | 5.40e-25 | 6.53e-01 | -0.0191 |
| 6935 | ZEB1 | SYSMH1 | Human | Oral cavity | OSCC | 1.05e-04 | -3.30e-01 | 0.1127 |
| Page: 1 2 |
| Tissue | Expression Dynamics | Abbreviation |
| Liver |  | HCC: Hepatocellular carcinoma |
| NAFLD: Non-alcoholic fatty liver disease | ||
| Oral Cavity | 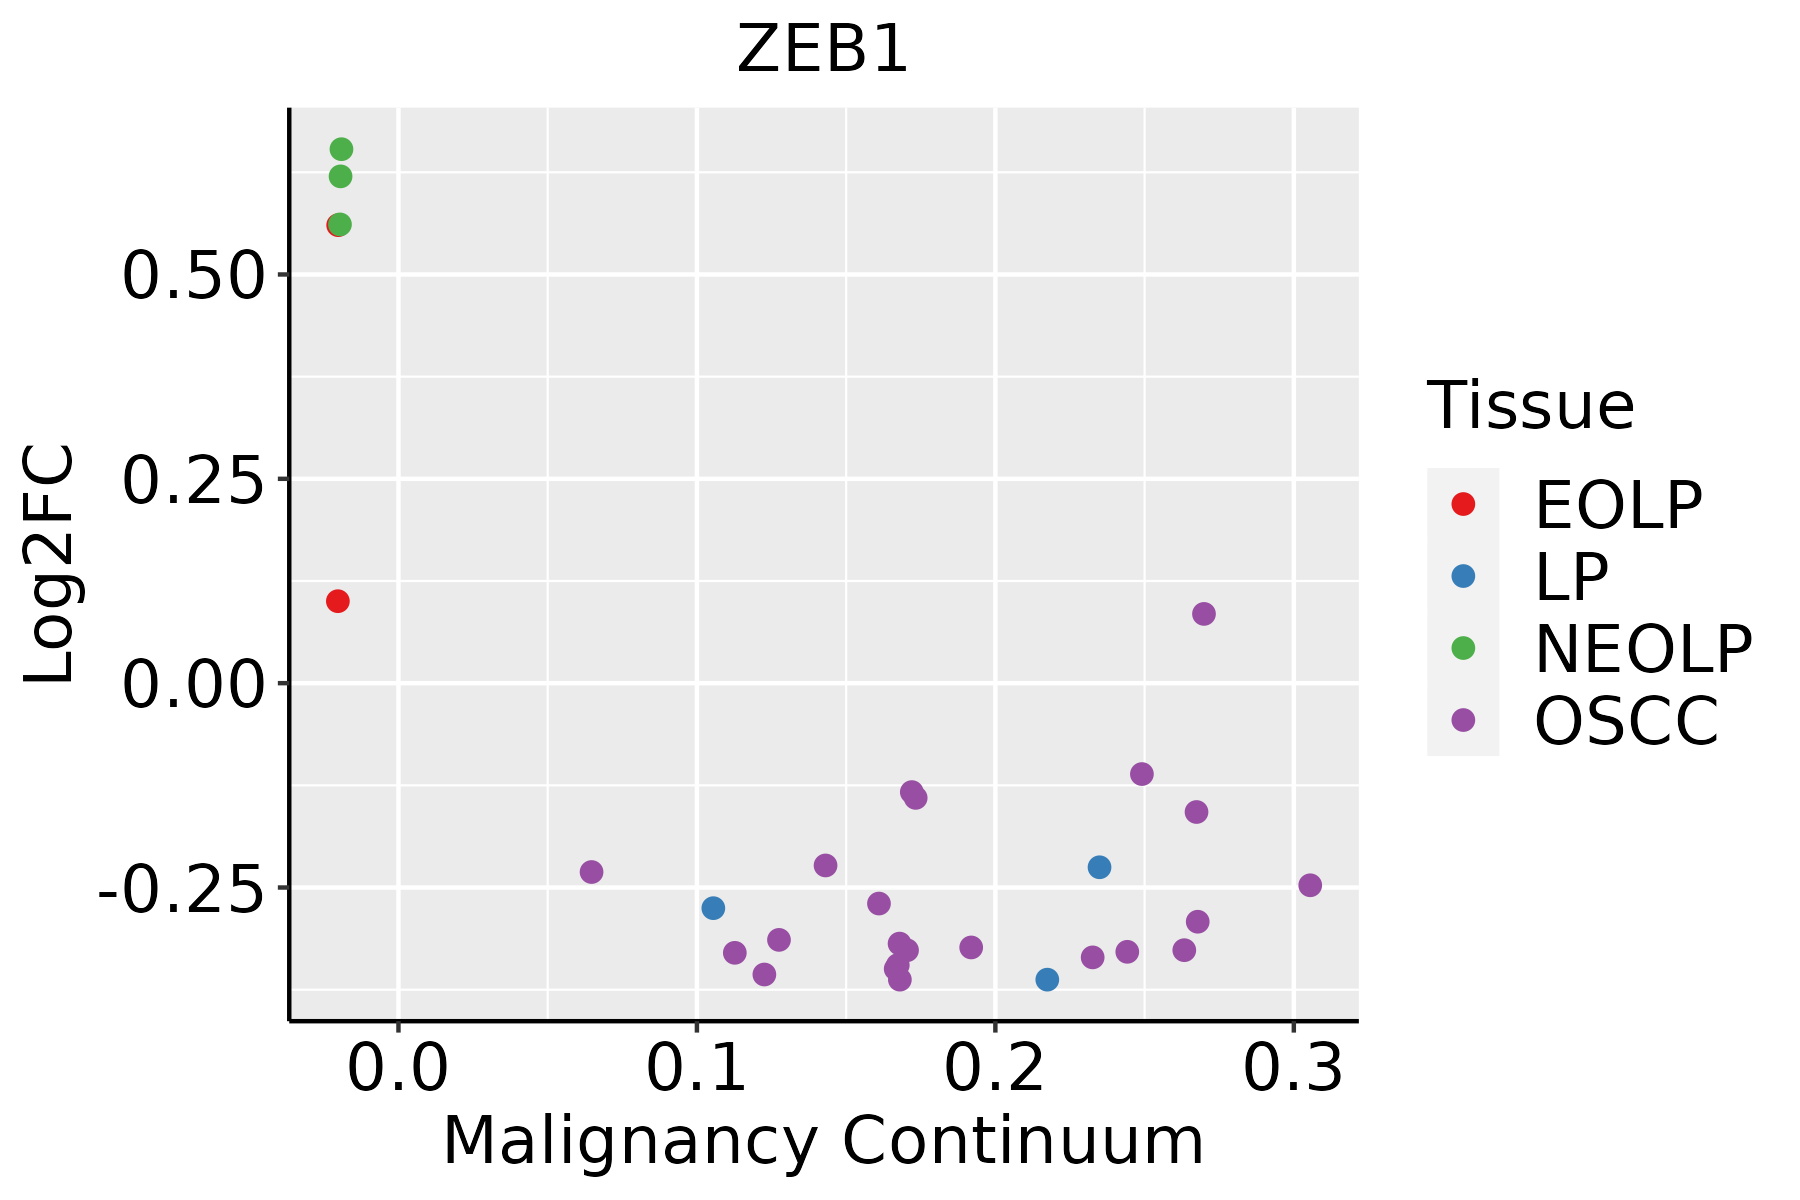 | EOLP: Erosive Oral lichen planus |
| LP: leukoplakia | ||
| NEOLP: Non-erosive oral lichen planus | ||
| OSCC: Oral squamous cell carcinoma | ||
| Thyroid |  | ATC: Anaplastic thyroid cancer |
| HT: Hashimoto's thyroiditis | ||
| PTC: Papillary thyroid cancer |
| ∗log2FC in expression of this searched gene in stem-like cells from each diseased tissue sample relative to stem-like cells in normal samples in each tissue plotted against the malignancy continuum. Samples are colored based on if they are from different disease stage. |
Top |
Malignant transformation related pathway analysis |
| Find out the enriched GO biological processes and KEGG pathways involved in transition from healthy to precancer to cancer |
| Tissue | Disease Stage | Enriched GO biological Processes |
| Colorectum | AD |  |
| Colorectum | SER |  |
| Colorectum | MSS |  |
| Colorectum | MSI-H |  |
| Colorectum | FAP |  |
| ∗Top 15 enriched GO BP terms are showed in the bar plot of each disease state in each tissue. Each row represents a significant GO biological process which is colored according to the -log10(p.adjust). |
| Page: 1 2 3 4 5 6 7 8 9 |
| GO ID | Tissue | Disease Stage | Description | Gene Ratio | Bg Ratio | pvalue | p.adjust | Count |
| GO:00031586 | Liver | Cirrhotic | endothelium development | 49/4634 | 136/18723 | 2.14e-03 | 1.32e-02 | 49 |
| GO:00454465 | Liver | Cirrhotic | endothelial cell differentiation | 43/4634 | 118/18723 | 3.03e-03 | 1.72e-02 | 43 |
| GO:000315816 | Oral cavity | OSCC | endothelium development | 71/7305 | 136/18723 | 1.18e-03 | 5.99e-03 | 71 |
| GO:00454469 | Oral cavity | OSCC | endothelial cell differentiation | 61/7305 | 118/18723 | 3.40e-03 | 1.44e-02 | 61 |
| GO:000315817 | Oral cavity | EOLP | endothelium development | 28/2218 | 136/18723 | 2.37e-03 | 1.45e-02 | 28 |
| GO:004544615 | Oral cavity | EOLP | endothelial cell differentiation | 25/2218 | 118/18723 | 2.63e-03 | 1.59e-02 | 25 |
| GO:000315823 | Oral cavity | NEOLP | endothelium development | 33/2005 | 136/18723 | 4.94e-06 | 1.04e-04 | 33 |
| GO:00308566 | Oral cavity | NEOLP | regulation of epithelial cell differentiation | 33/2005 | 154/18723 | 7.47e-05 | 9.67e-04 | 33 |
| GO:004544622 | Oral cavity | NEOLP | endothelial cell differentiation | 27/2005 | 118/18723 | 1.03e-04 | 1.24e-03 | 27 |
| GO:0003158111 | Thyroid | PTC | endothelium development | 62/5968 | 136/18723 | 5.45e-04 | 3.48e-03 | 62 |
| GO:004544619 | Thyroid | PTC | endothelial cell differentiation | 55/5968 | 118/18723 | 5.64e-04 | 3.59e-03 | 55 |
| GO:000315825 | Thyroid | ATC | endothelium development | 66/6293 | 136/18723 | 2.16e-04 | 1.42e-03 | 66 |
| GO:004544623 | Thyroid | ATC | endothelial cell differentiation | 56/6293 | 118/18723 | 1.23e-03 | 6.44e-03 | 56 |
| Page: 1 |
| Pathway ID | Tissue | Disease Stage | Description | Gene Ratio | Bg Ratio | pvalue | p.adjust | qvalue | Count |
| hsa0521524 | Oral cavity | EOLP | Prostate cancer | 31/1218 | 97/8465 | 7.90e-06 | 4.73e-05 | 2.79e-05 | 31 |
| hsa0521534 | Oral cavity | EOLP | Prostate cancer | 31/1218 | 97/8465 | 7.90e-06 | 4.73e-05 | 2.79e-05 | 31 |
| hsa0521542 | Oral cavity | NEOLP | Prostate cancer | 28/1112 | 97/8465 | 3.15e-05 | 2.57e-04 | 1.62e-04 | 28 |
| hsa0521552 | Oral cavity | NEOLP | Prostate cancer | 28/1112 | 97/8465 | 3.15e-05 | 2.57e-04 | 1.62e-04 | 28 |
| Page: 1 |
Top |
Cell-cell communication analysis |
| Identification of potential cell-cell interactions between two cell types and their ligand-receptor pairs for different disease states |
| Ligand | Receptor | LRpair | Pathway | Tissue | Disease Stage |
| Page: 1 |
Top |
Single-cell gene regulatory network inference analysis |
| Find out the significant the regulons (TFs) and the target genes of each regulon across cell types for different disease states |
| TF | Cell Type | Tissue | Disease Stage | Target Gene | RSS | Regulon Activity |
| ZEB1 | CD8TCM | Esophagus | ADJ | ASTE1,CRYZ,ATP8B3, etc. | 1.78e-01 |  |
| ZEB1 | TFH | Esophagus | ADJ | ASTE1,CRYZ,ATP8B3, etc. | 2.56e-02 | |
| ZEB1 | CD8TEXP | Esophagus | ESCC | ASTE1,CRYZ,ATP8B3, etc. | 7.63e-02 |  |
| ZEB1 | CD8TCM | Esophagus | ESCC | ASTE1,CRYZ,ATP8B3, etc. | 1.65e-01 | |
| ZEB1 | TFH | Liver | HCC | CLIC3,DPM1,TMEM63B, etc. | 1.36e-01 |  |
| ZEB1 | CD4TN | Liver | Healthy | CLIC3,DPM1,TMEM63B, etc. | 2.10e-03 |  |
| ZEB1 | CD8TEXINT | Lung | ADJ | CAMK4,LINC02694,CASK, etc. | 1.34e-01 |  |
| ZEB1 | TREG | Lung | ADJ | CAMK4,LINC02694,CASK, etc. | 8.61e-02 | |
| ZEB1 | CD8TEXP | Lung | ADJ | CAMK4,LINC02694,CASK, etc. | 1.46e-01 | |
| ZEB1 | CD4TN | Lung | ADJ | CAMK4,LINC02694,CASK, etc. | 1.72e-01 | |
| ∗The dot plots of a searched regulon are shown for all cell subpopulations in each disease state of each tissue based on the regulon specific score inferred using pySCENIC and by calculating the average expression. |
| Page: 1 2 |
Top |
Somatic mutation of malignant transformation related genes |
| Annotation of somatic variants for genes involved in malignant transformation |
| Hugo Symbol | Variant Class | Variant Classification | dbSNP RS | HGVSc | HGVSp | HGVSp Short | SWISSPROT | BIOTYPE | SIFT | PolyPhen | Tumor Sample Barcode | Tissue | Histology | Sex | Age | Stage | Therapy Types | Drugs | Outcome |
| ZEB1 | SNV | Missense_Mutation | c.3185N>A | p.Gly1062Glu | p.G1062E | P37275 | protein_coding | tolerated_low_confidence(0.88) | benign(0) | TCGA-A8-A06Q-01 | Breast | breast invasive carcinoma | Female | <65 | III/IV | Unknown | Unknown | SD | |
| ZEB1 | SNV | Missense_Mutation | c.3005N>T | p.Ala1002Val | p.A1002V | P37275 | protein_coding | tolerated(0.22) | benign(0.001) | TCGA-AN-A0FD-01 | Breast | breast invasive carcinoma | Female | >=65 | I/II | Unknown | Unknown | SD | |
| ZEB1 | SNV | Missense_Mutation | novel | c.2078N>A | p.Gly693Glu | p.G693E | P37275 | protein_coding | tolerated(0.45) | possibly_damaging(0.722) | TCGA-AN-A0FT-01 | Breast | breast invasive carcinoma | Female | <65 | I/II | Unknown | Unknown | SD |
| ZEB1 | SNV | Missense_Mutation | c.2858N>A | p.Arg953Gln | p.R953Q | P37275 | protein_coding | deleterious(0) | possibly_damaging(0.673) | TCGA-AR-A0TZ-01 | Breast | breast invasive carcinoma | Female | <65 | III/IV | Unspecific | Doxorubicin | PD | |
| ZEB1 | SNV | Missense_Mutation | c.2024C>A | p.Thr675Lys | p.T675K | P37275 | protein_coding | tolerated(0.3) | benign(0) | TCGA-B6-A0I6-01 | Breast | breast invasive carcinoma | Female | <65 | I/II | Unknown | Unknown | PD | |
| ZEB1 | SNV | Missense_Mutation | c.3173A>G | p.Glu1058Gly | p.E1058G | P37275 | protein_coding | tolerated_low_confidence(0.68) | benign(0) | TCGA-BH-A18G-01 | Breast | breast invasive carcinoma | Female | >=65 | I/II | Unknown | Unknown | SD | |
| ZEB1 | SNV | Missense_Mutation | c.533N>C | p.Arg178Thr | p.R178T | P37275 | protein_coding | deleterious(0) | probably_damaging(0.994) | TCGA-D8-A1JA-01 | Breast | breast invasive carcinoma | Female | <65 | III/IV | Chemotherapy | adriamycin | PD | |
| ZEB1 | SNV | Missense_Mutation | rs771873166 | c.1337A>G | p.Asn446Ser | p.N446S | P37275 | protein_coding | tolerated(0.78) | benign(0) | TCGA-D8-A1XZ-01 | Breast | breast invasive carcinoma | Female | >=65 | III/IV | Hormone Therapy | tamoxiphen+anastrozolum | SD |
| ZEB1 | SNV | Missense_Mutation | novel | c.2530T>C | p.Tyr844His | p.Y844H | P37275 | protein_coding | deleterious(0.01) | probably_damaging(0.994) | TCGA-UU-A93S-01 | Breast | breast invasive carcinoma | Female | <65 | III/IV | Unknown | Unknown | PD |
| ZEB1 | insertion | In_Frame_Ins | novel | c.956_957insCCTAACCTCCATAGATAAATTAGTGAT | p.Ala319_Ser320insLeuThrSerIleAspLysLeuValIle | p.A319_S320insLTSIDKLVI | P37275 | protein_coding | TCGA-BH-A0HF-01 | Breast | breast invasive carcinoma | Female | >=65 | I/II | Hormone Therapy | arimidex | SD |
| Page: 1 2 3 4 5 6 7 8 9 10 11 12 13 14 15 16 17 18 |
Top |
Related drugs of malignant transformation related genes |
| Identification of chemicals and drugs interact with genes involved in malignant transfromation |
| (DGIdb 4.0) |
| Entrez ID | Symbol | Category | Interaction Types | Drug Claim Name | Drug Name | PMIDs |
| 6935 | ZEB1 | TRANSCRIPTION FACTOR, DRUG RESISTANCE | DOXORUBICIN | DOXORUBICIN | 24013721 | |
| 6935 | ZEB1 | TRANSCRIPTION FACTOR, DRUG RESISTANCE | OXALIPLATIN | OXALIPLATIN | 29151941 | |
| 6935 | ZEB1 | TRANSCRIPTION FACTOR, DRUG RESISTANCE | SALINOMYCIN | SALINOMYCIN | 24013721 |
| Page: 1 |

Copyright 2023-Present -The University of Texas Health Science Center at Houston |