
|
|||||
|
 | |
| |
| |
| |
| |
| |
|
Gene: ZDHHC7 |
Gene summary for ZDHHC7 |
| Gene information | Species | Human | Gene symbol | ZDHHC7 | Gene ID | 55625 |
| Gene name | zinc finger DHHC-type palmitoyltransferase 7 | |
| Gene Alias | DHHC7 | |
| Cytomap | 16q24.1 | |
| Gene Type | protein-coding | GO ID | GO:0001738 | UniProtAcc | Q9NXF8 |
Top |
Malignant transformation analysis |
| Identification of the aberrant gene expression in precancerous and cancerous lesions by comparing the gene expression of stem-like cells in diseased tissues with normal stem cells |
| Entrez ID | Symbol | Replicates | Species | Organ | Tissue | Adj P-value | Log2FC | Malignancy |
| 55625 | ZDHHC7 | HTA11_3410_2000001011 | Human | Colorectum | AD | 1.86e-02 | -8.32e-02 | 0.0155 |
| 55625 | ZDHHC7 | HTA11_347_2000001011 | Human | Colorectum | AD | 1.08e-10 | 5.59e-01 | -0.1954 |
| 55625 | ZDHHC7 | A015-C-203 | Human | Colorectum | FAP | 1.98e-09 | -2.12e-01 | -0.1294 |
| 55625 | ZDHHC7 | A002-C-201 | Human | Colorectum | FAP | 2.71e-04 | -5.89e-02 | 0.0324 |
| 55625 | ZDHHC7 | A001-C-108 | Human | Colorectum | FAP | 9.39e-03 | -9.43e-02 | -0.0272 |
| 55625 | ZDHHC7 | A002-C-205 | Human | Colorectum | FAP | 3.97e-09 | -1.21e-01 | -0.1236 |
| 55625 | ZDHHC7 | A015-C-006 | Human | Colorectum | FAP | 6.10e-07 | -2.68e-01 | -0.0994 |
| 55625 | ZDHHC7 | A015-C-106 | Human | Colorectum | FAP | 2.66e-03 | -1.60e-01 | -0.0511 |
| 55625 | ZDHHC7 | A002-C-114 | Human | Colorectum | FAP | 9.05e-06 | -1.53e-01 | -0.1561 |
| 55625 | ZDHHC7 | A015-C-104 | Human | Colorectum | FAP | 4.71e-09 | -1.68e-01 | -0.1899 |
| 55625 | ZDHHC7 | A002-C-016 | Human | Colorectum | FAP | 7.14e-07 | -1.49e-01 | 0.0521 |
| 55625 | ZDHHC7 | A015-C-002 | Human | Colorectum | FAP | 1.03e-03 | -1.04e-01 | -0.0763 |
| 55625 | ZDHHC7 | A002-C-116 | Human | Colorectum | FAP | 1.20e-11 | -1.27e-01 | -0.0452 |
| 55625 | ZDHHC7 | A014-C-008 | Human | Colorectum | FAP | 2.41e-04 | -1.23e-01 | -0.191 |
| 55625 | ZDHHC7 | A018-E-020 | Human | Colorectum | FAP | 4.37e-07 | -1.65e-01 | -0.2034 |
| 55625 | ZDHHC7 | F034 | Human | Colorectum | FAP | 3.93e-07 | -9.39e-02 | -0.0665 |
| 55625 | ZDHHC7 | CRC-1-8810 | Human | Colorectum | CRC | 1.02e-04 | -1.69e-01 | 0.6257 |
| 55625 | ZDHHC7 | LZE8T | Human | Esophagus | ESCC | 5.99e-05 | 1.27e-01 | 0.067 |
| 55625 | ZDHHC7 | LZE20T | Human | Esophagus | ESCC | 3.79e-09 | 2.88e-01 | 0.0662 |
| 55625 | ZDHHC7 | LZE22T | Human | Esophagus | ESCC | 1.08e-02 | 4.65e-01 | 0.068 |
| Page: 1 2 3 4 5 6 |
| Tissue | Expression Dynamics | Abbreviation |
| Colorectum (GSE201348) |  | FAP: Familial adenomatous polyposis |
| CRC: Colorectal cancer | ||
| Colorectum (HTA11) |  | AD: Adenomas |
| SER: Sessile serrated lesions | ||
| MSI-H: Microsatellite-high colorectal cancer | ||
| MSS: Microsatellite stable colorectal cancer | ||
| Esophagus |  | ESCC: Esophageal squamous cell carcinoma |
| HGIN: High-grade intraepithelial neoplasias | ||
| LGIN: Low-grade intraepithelial neoplasias | ||
| Liver | 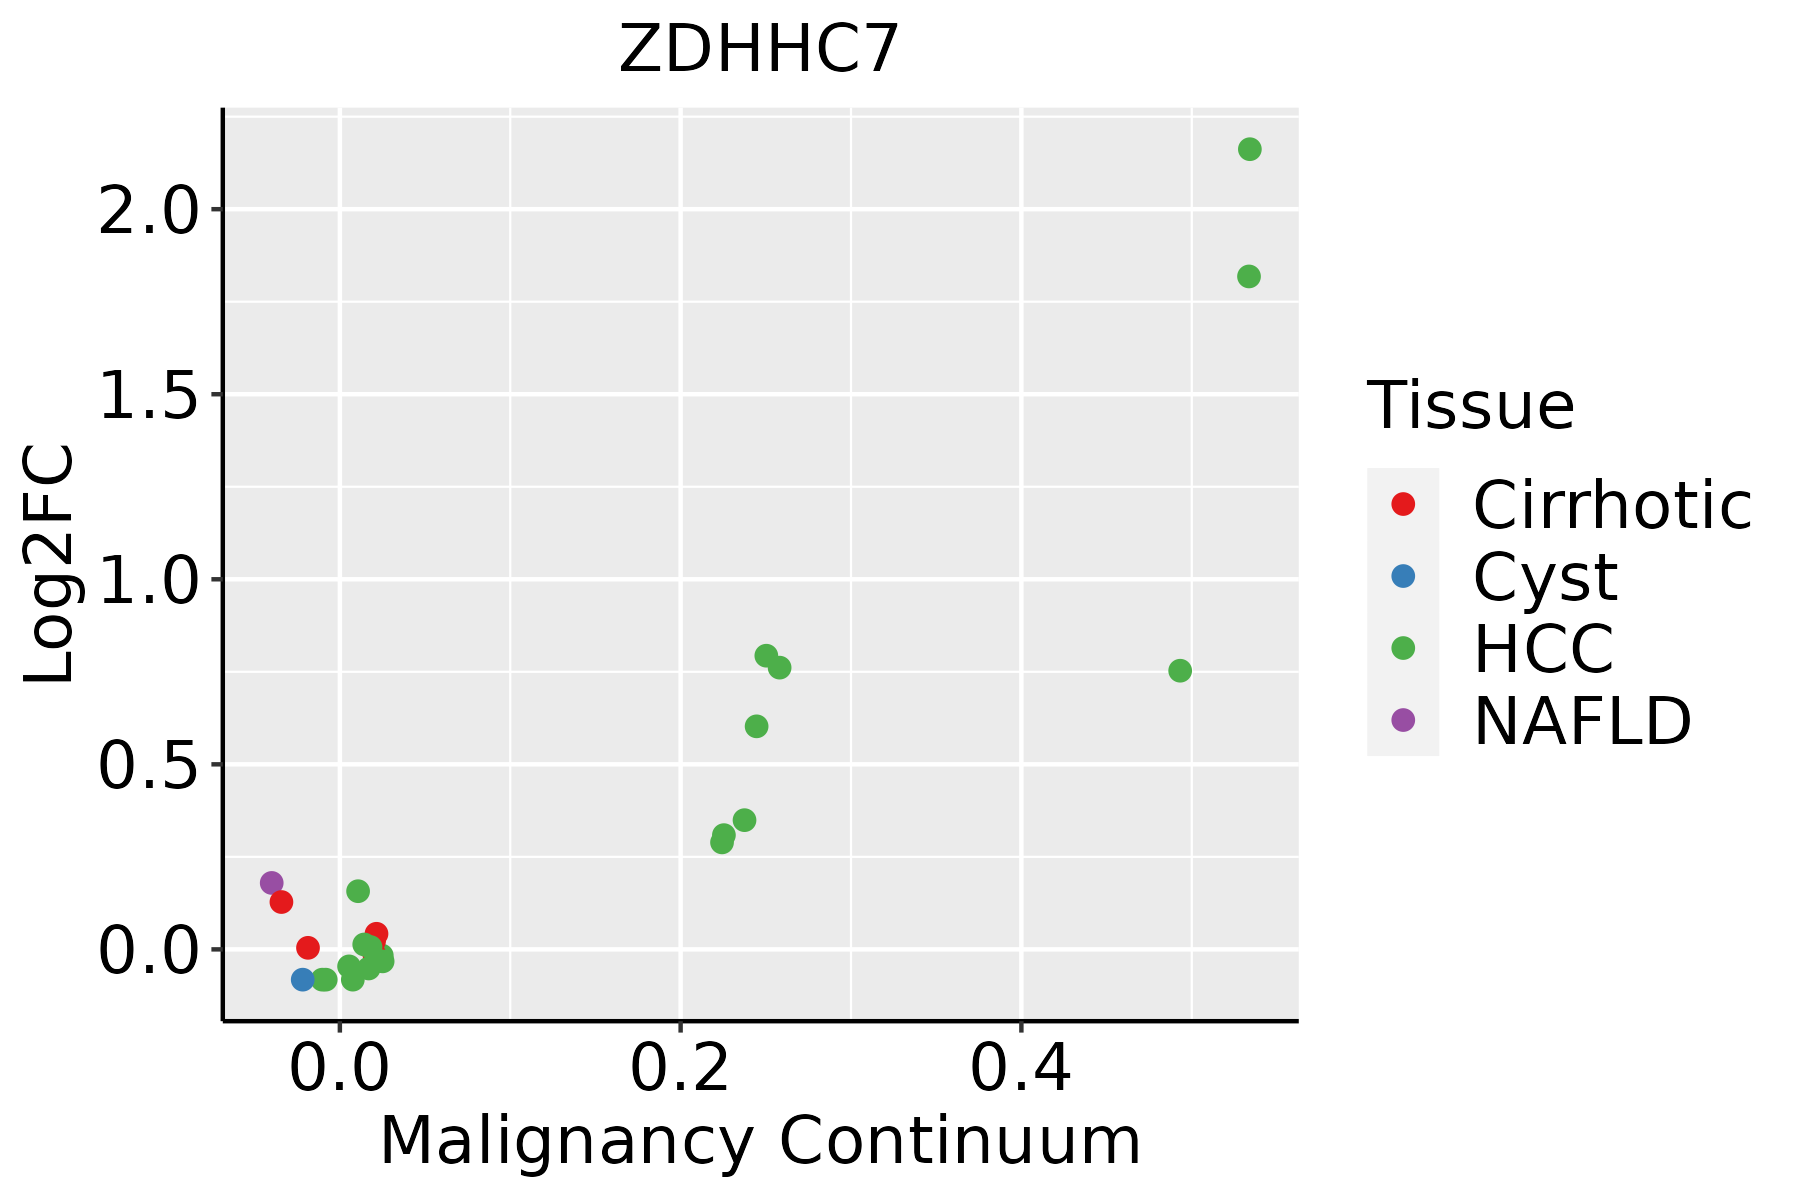 | HCC: Hepatocellular carcinoma |
| NAFLD: Non-alcoholic fatty liver disease | ||
| Oral Cavity |  | EOLP: Erosive Oral lichen planus |
| LP: leukoplakia | ||
| NEOLP: Non-erosive oral lichen planus | ||
| OSCC: Oral squamous cell carcinoma |
| ∗log2FC in expression of this searched gene in stem-like cells from each diseased tissue sample relative to stem-like cells in normal samples in each tissue plotted against the malignancy continuum. Samples are colored based on if they are from different disease stage. |
Top |
Malignant transformation related pathway analysis |
| Find out the enriched GO biological processes and KEGG pathways involved in transition from healthy to precancer to cancer |
| Tissue | Disease Stage | Enriched GO biological Processes |
| Colorectum | AD |  |
| Colorectum | SER |  |
| Colorectum | MSS |  |
| Colorectum | MSI-H |  |
| Colorectum | FAP |  |
| ∗Top 15 enriched GO BP terms are showed in the bar plot of each disease state in each tissue. Each row represents a significant GO biological process which is colored according to the -log10(p.adjust). |
| Page: 1 2 3 4 5 6 7 8 9 |
| GO ID | Tissue | Disease Stage | Description | Gene Ratio | Bg Ratio | pvalue | p.adjust | Count |
| GO:0072659 | Colorectum | AD | protein localization to plasma membrane | 122/3918 | 284/18723 | 2.86e-17 | 1.49e-14 | 122 |
| GO:1990778 | Colorectum | AD | protein localization to cell periphery | 129/3918 | 333/18723 | 5.51e-14 | 1.15e-11 | 129 |
| GO:0009895 | Colorectum | AD | negative regulation of catabolic process | 124/3918 | 320/18723 | 1.66e-13 | 3.35e-11 | 124 |
| GO:0090150 | Colorectum | AD | establishment of protein localization to membrane | 100/3918 | 260/18723 | 6.01e-11 | 6.33e-09 | 100 |
| GO:1905475 | Colorectum | AD | regulation of protein localization to membrane | 73/3918 | 175/18723 | 3.37e-10 | 2.93e-08 | 73 |
| GO:1903076 | Colorectum | AD | regulation of protein localization to plasma membrane | 48/3918 | 104/18723 | 7.17e-09 | 4.36e-07 | 48 |
| GO:1904375 | Colorectum | AD | regulation of protein localization to cell periphery | 54/3918 | 125/18723 | 1.52e-08 | 9.00e-07 | 54 |
| GO:0006605 | Colorectum | AD | protein targeting | 105/3918 | 314/18723 | 1.39e-07 | 6.44e-06 | 105 |
| GO:0032868 | Colorectum | AD | response to insulin | 91/3918 | 264/18723 | 2.02e-07 | 8.48e-06 | 91 |
| GO:1901653 | Colorectum | AD | cellular response to peptide | 114/3918 | 359/18723 | 8.32e-07 | 2.88e-05 | 114 |
| GO:0032869 | Colorectum | AD | cellular response to insulin stimulus | 72/3918 | 203/18723 | 1.10e-06 | 3.68e-05 | 72 |
| GO:0071375 | Colorectum | AD | cellular response to peptide hormone stimulus | 95/3918 | 290/18723 | 1.50e-06 | 4.66e-05 | 95 |
| GO:0043434 | Colorectum | AD | response to peptide hormone | 126/3918 | 414/18723 | 2.70e-06 | 7.86e-05 | 126 |
| GO:0150105 | Colorectum | AD | protein localization to cell-cell junction | 11/3918 | 21/18723 | 1.43e-03 | 1.22e-02 | 11 |
| GO:0001738 | Colorectum | AD | morphogenesis of a polarized epithelium | 31/3918 | 94/18723 | 4.30e-03 | 2.95e-02 | 31 |
| GO:1902414 | Colorectum | AD | protein localization to cell junction | 31/3918 | 94/18723 | 4.30e-03 | 2.95e-02 | 31 |
| GO:0030859 | Colorectum | AD | polarized epithelial cell differentiation | 11/3918 | 24/18723 | 5.43e-03 | 3.55e-02 | 11 |
| GO:00726594 | Colorectum | FAP | protein localization to plasma membrane | 95/2622 | 284/18723 | 4.86e-17 | 9.93e-14 | 95 |
| GO:19907784 | Colorectum | FAP | protein localization to cell periphery | 100/2622 | 333/18723 | 2.19e-14 | 2.68e-11 | 100 |
| GO:00098954 | Colorectum | FAP | negative regulation of catabolic process | 91/2622 | 320/18723 | 9.66e-12 | 4.96e-09 | 91 |
| Page: 1 2 3 4 5 6 7 |
| Pathway ID | Tissue | Disease Stage | Description | Gene Ratio | Bg Ratio | pvalue | p.adjust | qvalue | Count |
| Page: 1 |
Top |
Cell-cell communication analysis |
| Identification of potential cell-cell interactions between two cell types and their ligand-receptor pairs for different disease states |
| Ligand | Receptor | LRpair | Pathway | Tissue | Disease Stage |
| Page: 1 |
Top |
Single-cell gene regulatory network inference analysis |
| Find out the significant the regulons (TFs) and the target genes of each regulon across cell types for different disease states |
| TF | Cell Type | Tissue | Disease Stage | Target Gene | RSS | Regulon Activity |
| ∗The dot plots of a searched regulon are shown for all cell subpopulations in each disease state of each tissue based on the regulon specific score inferred using pySCENIC and by calculating the average expression. |
| Page: 1 |
Top |
Somatic mutation of malignant transformation related genes |
| Annotation of somatic variants for genes involved in malignant transformation |
| Hugo Symbol | Variant Class | Variant Classification | dbSNP RS | HGVSc | HGVSp | HGVSp Short | SWISSPROT | BIOTYPE | SIFT | PolyPhen | Tumor Sample Barcode | Tissue | Histology | Sex | Age | Stage | Therapy Types | Drugs | Outcome |
| ZDHHC7 | insertion | Nonsense_Mutation | novel | c.976_977insATTAGCTCCGATGCTTTGCACTGAAGTTGCAAAAGATCTGTGCACT | p.Gly326AspfsTer2 | p.G326Dfs*2 | Q9NXF8 | protein_coding | TCGA-A8-A08H-01 | Breast | breast invasive carcinoma | Female | >=65 | I/II | Unknown | Unknown | SD | ||
| ZDHHC7 | insertion | Frame_Shift_Ins | novel | c.676_677insGAAGGGTGGCCCTCCTCTGCTCCTTGGAGAACAATGAATGTGCC | p.Ala226GlyfsTer17 | p.A226Gfs*17 | Q9NXF8 | protein_coding | TCGA-A8-A08H-01 | Breast | breast invasive carcinoma | Female | >=65 | I/II | Unknown | Unknown | SD | ||
| ZDHHC7 | SNV | Missense_Mutation | c.398N>A | p.Gly133Glu | p.G133E | Q9NXF8 | protein_coding | tolerated_low_confidence(0.08) | benign(0.05) | TCGA-IR-A3LK-01 | Cervix | cervical & endocervical cancer | Female | >=65 | I/II | Chemotherapy | cisplatin | PD | |
| ZDHHC7 | SNV | Missense_Mutation | rs139969155 | c.852N>G | p.Asn284Lys | p.N284K | Q9NXF8 | protein_coding | tolerated(0.08) | benign(0.232) | TCGA-VS-A8QC-01 | Cervix | cervical & endocervical cancer | Female | <65 | I/II | Chemotherapy | paclitaxel | PD |
| ZDHHC7 | SNV | Missense_Mutation | rs751003316 | c.572N>A | p.Arg191Gln | p.R191Q | Q9NXF8 | protein_coding | deleterious(0) | benign(0.395) | TCGA-AA-3811-01 | Colorectum | colon adenocarcinoma | Female | >=65 | III/IV | Unknown | Unknown | PD |
| ZDHHC7 | SNV | Missense_Mutation | rs779916049 | c.448N>A | p.Ala150Thr | p.A150T | Q9NXF8 | protein_coding | deleterious(0.01) | possibly_damaging(0.576) | TCGA-AA-3949-01 | Colorectum | colon adenocarcinoma | Female | >=65 | III/IV | Unknown | Unknown | SD |
| ZDHHC7 | SNV | Missense_Mutation | novel | c.983G>A | p.Arg328Gln | p.R328Q | Q9NXF8 | protein_coding | tolerated(0.27) | benign(0.001) | TCGA-AA-3984-01 | Colorectum | colon adenocarcinoma | Female | <65 | I/II | Unknown | Unknown | SD |
| ZDHHC7 | SNV | Missense_Mutation | c.629N>T | p.Arg210Ile | p.R210I | Q9NXF8 | protein_coding | deleterious(0) | possibly_damaging(0.622) | TCGA-AZ-4315-01 | Colorectum | colon adenocarcinoma | Male | <65 | I/II | Unknown | Unknown | SD | |
| ZDHHC7 | SNV | Missense_Mutation | c.784C>T | p.Leu262Phe | p.L262F | Q9NXF8 | protein_coding | tolerated(1) | benign(0.005) | TCGA-D5-6930-01 | Colorectum | colon adenocarcinoma | Male | >=65 | I/II | Unknown | Unknown | SD | |
| ZDHHC7 | SNV | Missense_Mutation | rs766777560 | c.538N>A | p.Ala180Thr | p.A180T | Q9NXF8 | protein_coding | deleterious(0) | probably_damaging(0.922) | TCGA-G4-6304-01 | Colorectum | colon adenocarcinoma | Female | >=65 | I/II | Chemotherapy | fluorouracil | PD |
| Page: 1 2 3 |
Top |
Related drugs of malignant transformation related genes |
| Identification of chemicals and drugs interact with genes involved in malignant transfromation |
| (DGIdb 4.0) |
| Entrez ID | Symbol | Category | Interaction Types | Drug Claim Name | Drug Name | PMIDs |
| 55625 | ZDHHC7 | NA | methylphenidate | METHYLPHENIDATE | 29382897 |
| Page: 1 |

Copyright 2023-Present -The University of Texas Health Science Center at Houston |