
|
|||||
|
 | |
| |
| |
| |
| |
| |
|
Gene: ZDHHC6 |
Gene summary for ZDHHC6 |
| Gene information | Species | Human | Gene symbol | ZDHHC6 | Gene ID | 64429 |
| Gene name | zinc finger DHHC-type palmitoyltransferase 6 | |
| Gene Alias | DHHC-6 | |
| Cytomap | 10q25.2 | |
| Gene Type | protein-coding | GO ID | GO:0006464 | UniProtAcc | Q9H6R6 |
Top |
Malignant transformation analysis |
| Identification of the aberrant gene expression in precancerous and cancerous lesions by comparing the gene expression of stem-like cells in diseased tissues with normal stem cells |
| Entrez ID | Symbol | Replicates | Species | Organ | Tissue | Adj P-value | Log2FC | Malignancy |
| 64429 | ZDHHC6 | LZE2T | Human | Esophagus | ESCC | 1.86e-02 | 3.08e-01 | 0.082 |
| 64429 | ZDHHC6 | LZE4T | Human | Esophagus | ESCC | 5.44e-13 | 1.73e-01 | 0.0811 |
| 64429 | ZDHHC6 | LZE5T | Human | Esophagus | ESCC | 1.22e-06 | 2.28e-01 | 0.0514 |
| 64429 | ZDHHC6 | LZE7T | Human | Esophagus | ESCC | 2.59e-04 | 3.69e-01 | 0.0667 |
| 64429 | ZDHHC6 | LZE8T | Human | Esophagus | ESCC | 3.57e-08 | 1.04e-01 | 0.067 |
| 64429 | ZDHHC6 | LZE24T | Human | Esophagus | ESCC | 1.27e-18 | 4.49e-01 | 0.0596 |
| 64429 | ZDHHC6 | LZE6T | Human | Esophagus | ESCC | 1.51e-15 | 5.08e-01 | 0.0845 |
| 64429 | ZDHHC6 | P1T-E | Human | Esophagus | ESCC | 2.00e-03 | 1.70e-01 | 0.0875 |
| 64429 | ZDHHC6 | P2T-E | Human | Esophagus | ESCC | 3.27e-18 | 2.96e-01 | 0.1177 |
| 64429 | ZDHHC6 | P4T-E | Human | Esophagus | ESCC | 9.93e-30 | 5.65e-01 | 0.1323 |
| 64429 | ZDHHC6 | P5T-E | Human | Esophagus | ESCC | 8.76e-18 | 3.23e-01 | 0.1327 |
| 64429 | ZDHHC6 | P8T-E | Human | Esophagus | ESCC | 1.84e-20 | 3.47e-01 | 0.0889 |
| 64429 | ZDHHC6 | P9T-E | Human | Esophagus | ESCC | 3.97e-06 | 1.01e-01 | 0.1131 |
| 64429 | ZDHHC6 | P10T-E | Human | Esophagus | ESCC | 1.54e-09 | 1.30e-01 | 0.116 |
| 64429 | ZDHHC6 | P11T-E | Human | Esophagus | ESCC | 8.40e-19 | 5.45e-01 | 0.1426 |
| 64429 | ZDHHC6 | P12T-E | Human | Esophagus | ESCC | 1.96e-16 | 2.62e-01 | 0.1122 |
| 64429 | ZDHHC6 | P15T-E | Human | Esophagus | ESCC | 1.02e-18 | 2.93e-01 | 0.1149 |
| 64429 | ZDHHC6 | P16T-E | Human | Esophagus | ESCC | 3.86e-36 | 6.41e-01 | 0.1153 |
| 64429 | ZDHHC6 | P17T-E | Human | Esophagus | ESCC | 2.67e-08 | 2.51e-01 | 0.1278 |
| 64429 | ZDHHC6 | P19T-E | Human | Esophagus | ESCC | 1.78e-02 | 4.38e-01 | 0.1662 |
| Page: 1 2 3 4 5 |
| Tissue | Expression Dynamics | Abbreviation |
| Esophagus | 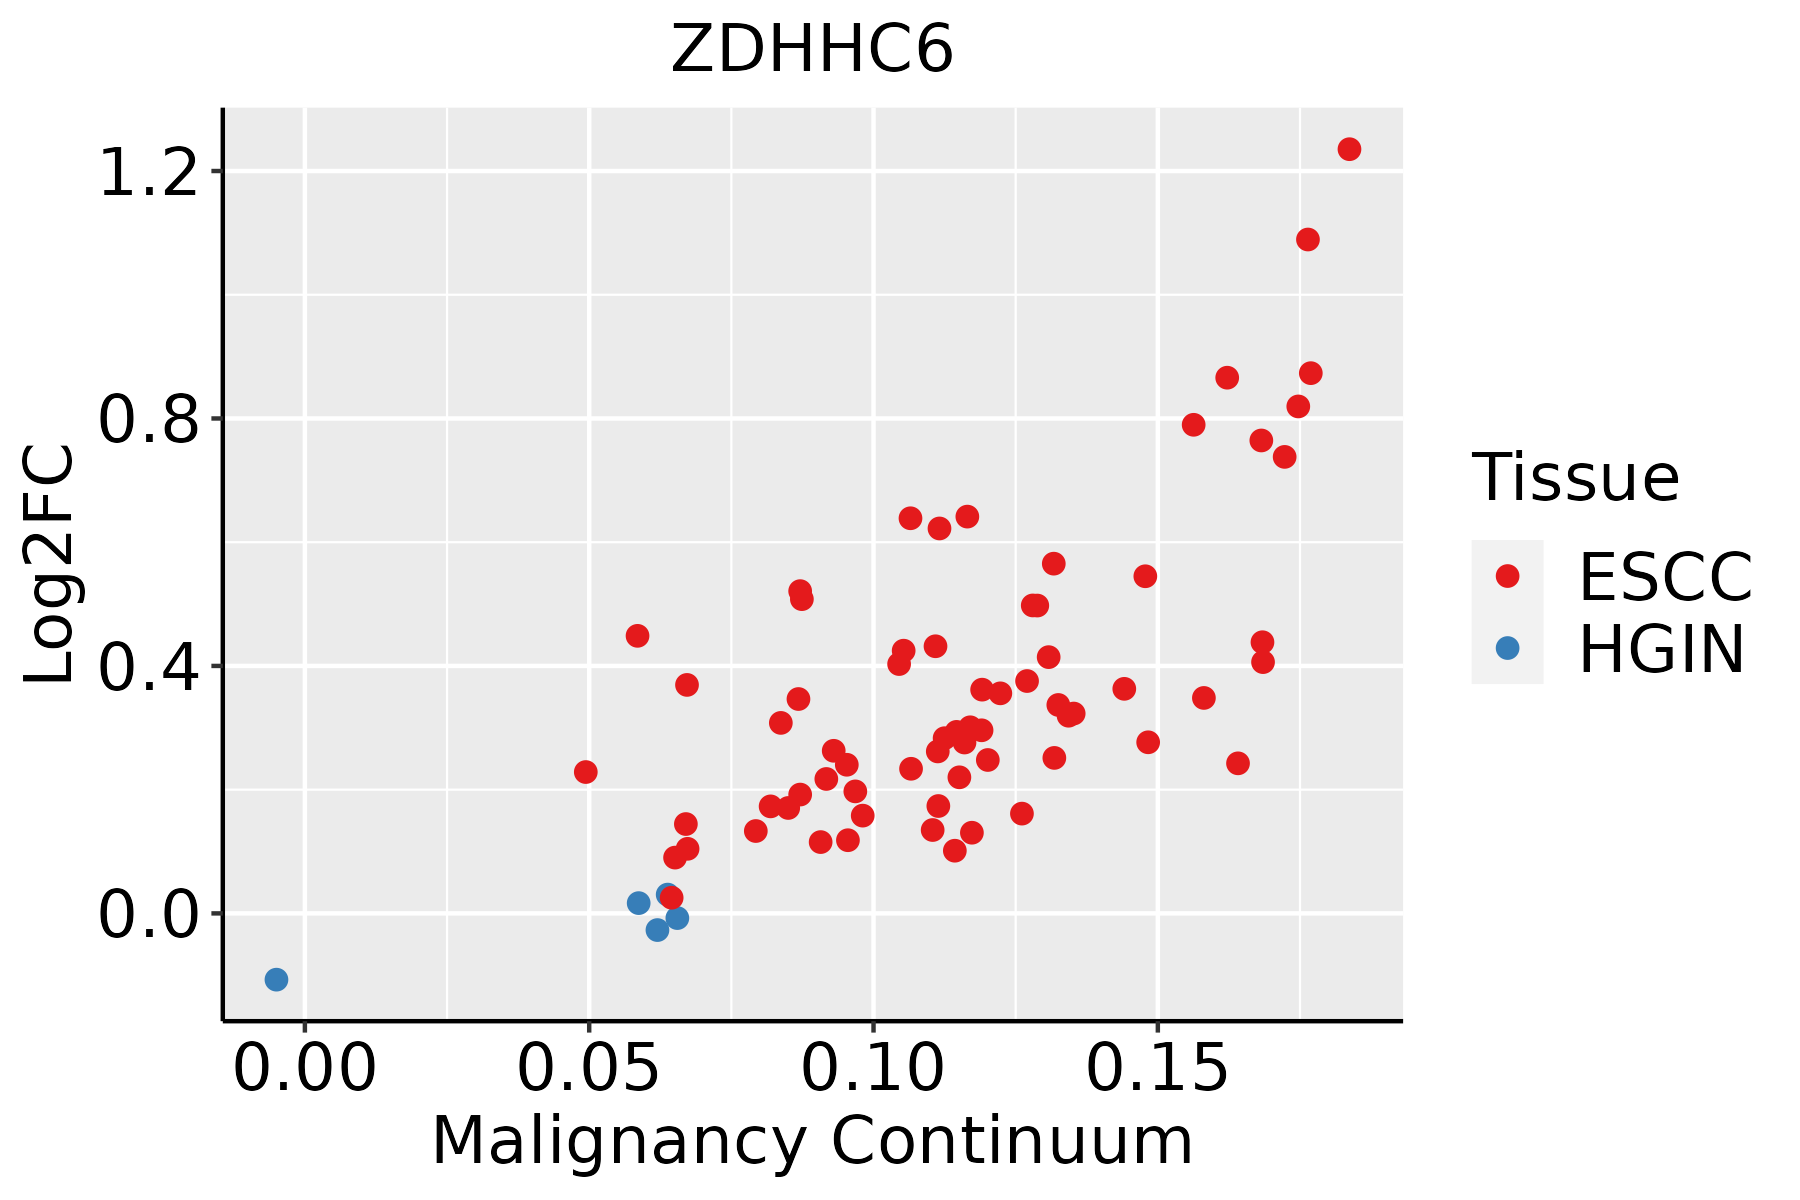 | ESCC: Esophageal squamous cell carcinoma |
| HGIN: High-grade intraepithelial neoplasias | ||
| LGIN: Low-grade intraepithelial neoplasias | ||
| Liver |  | HCC: Hepatocellular carcinoma |
| NAFLD: Non-alcoholic fatty liver disease | ||
| Oral Cavity | 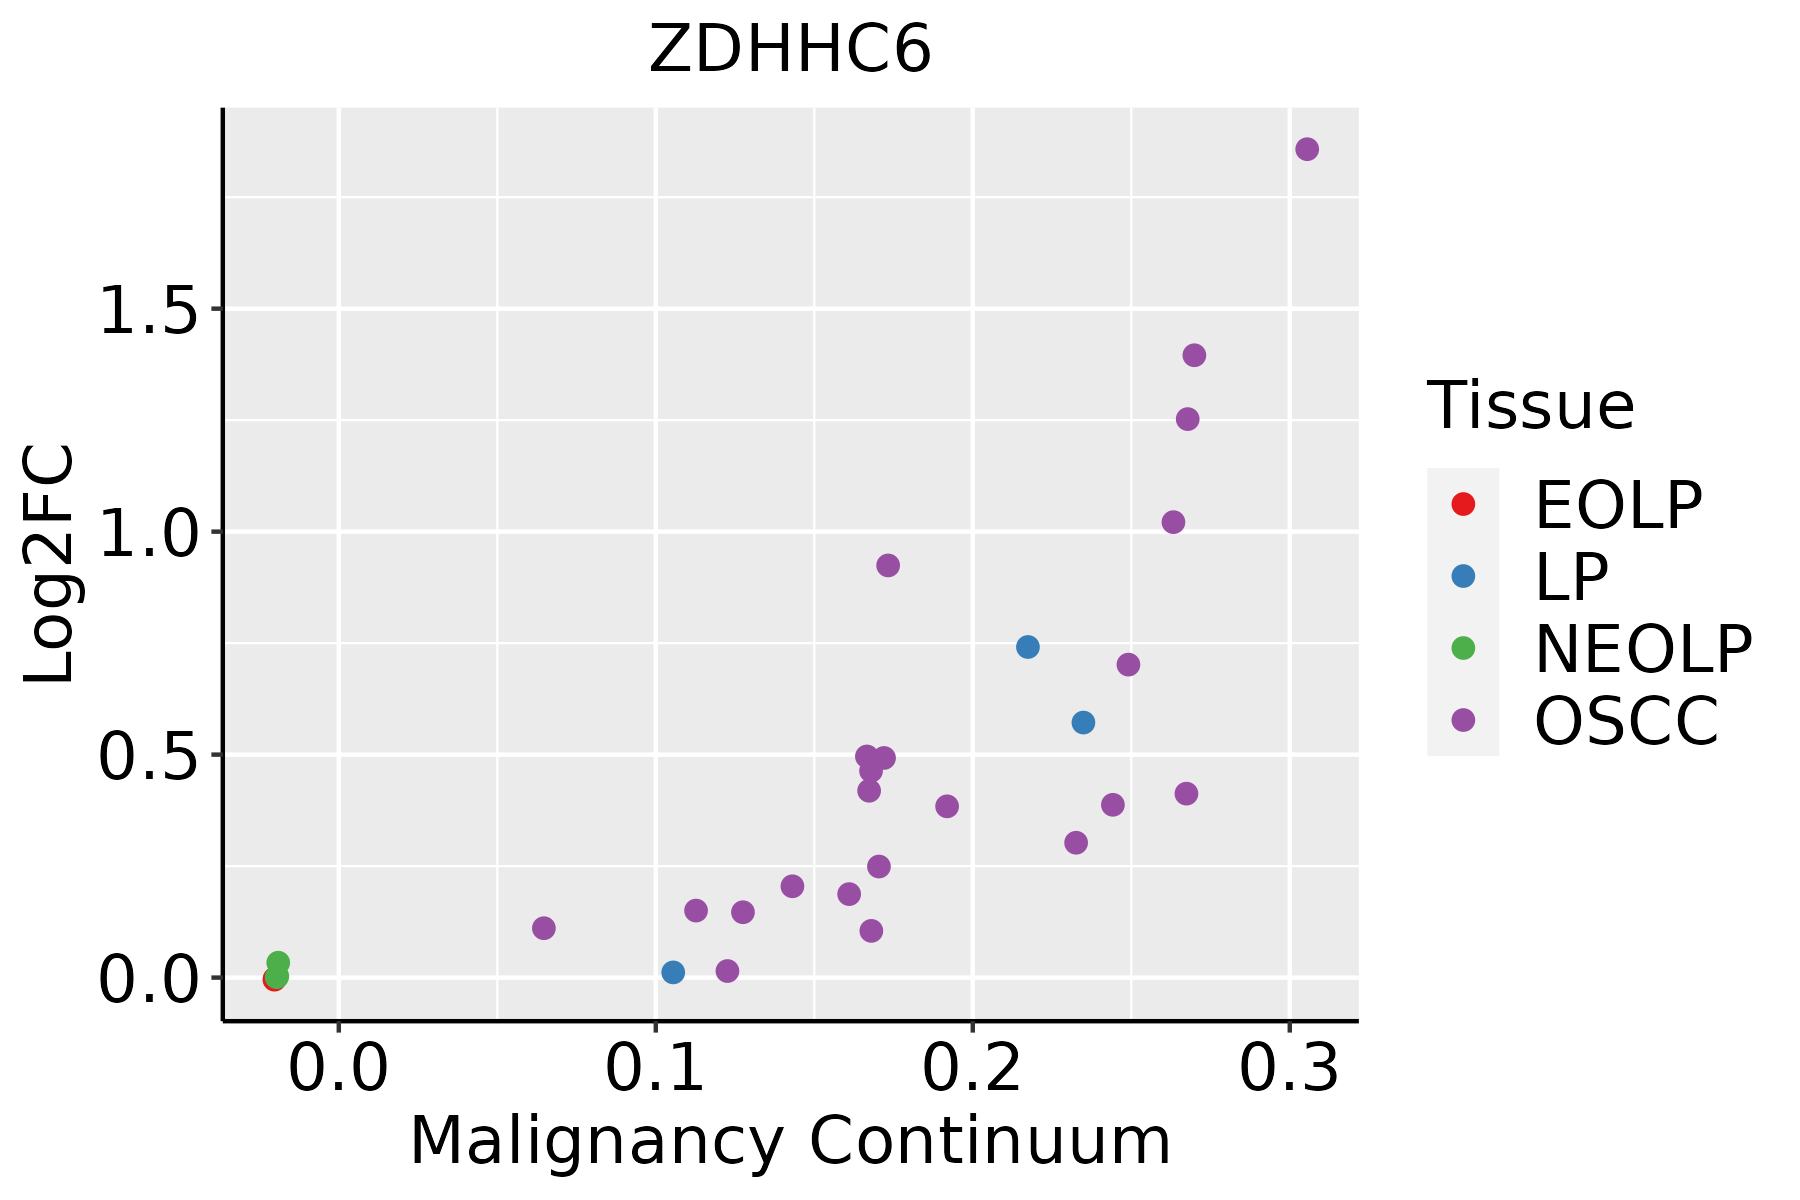 | EOLP: Erosive Oral lichen planus |
| LP: leukoplakia | ||
| NEOLP: Non-erosive oral lichen planus | ||
| OSCC: Oral squamous cell carcinoma | ||
| Skin | 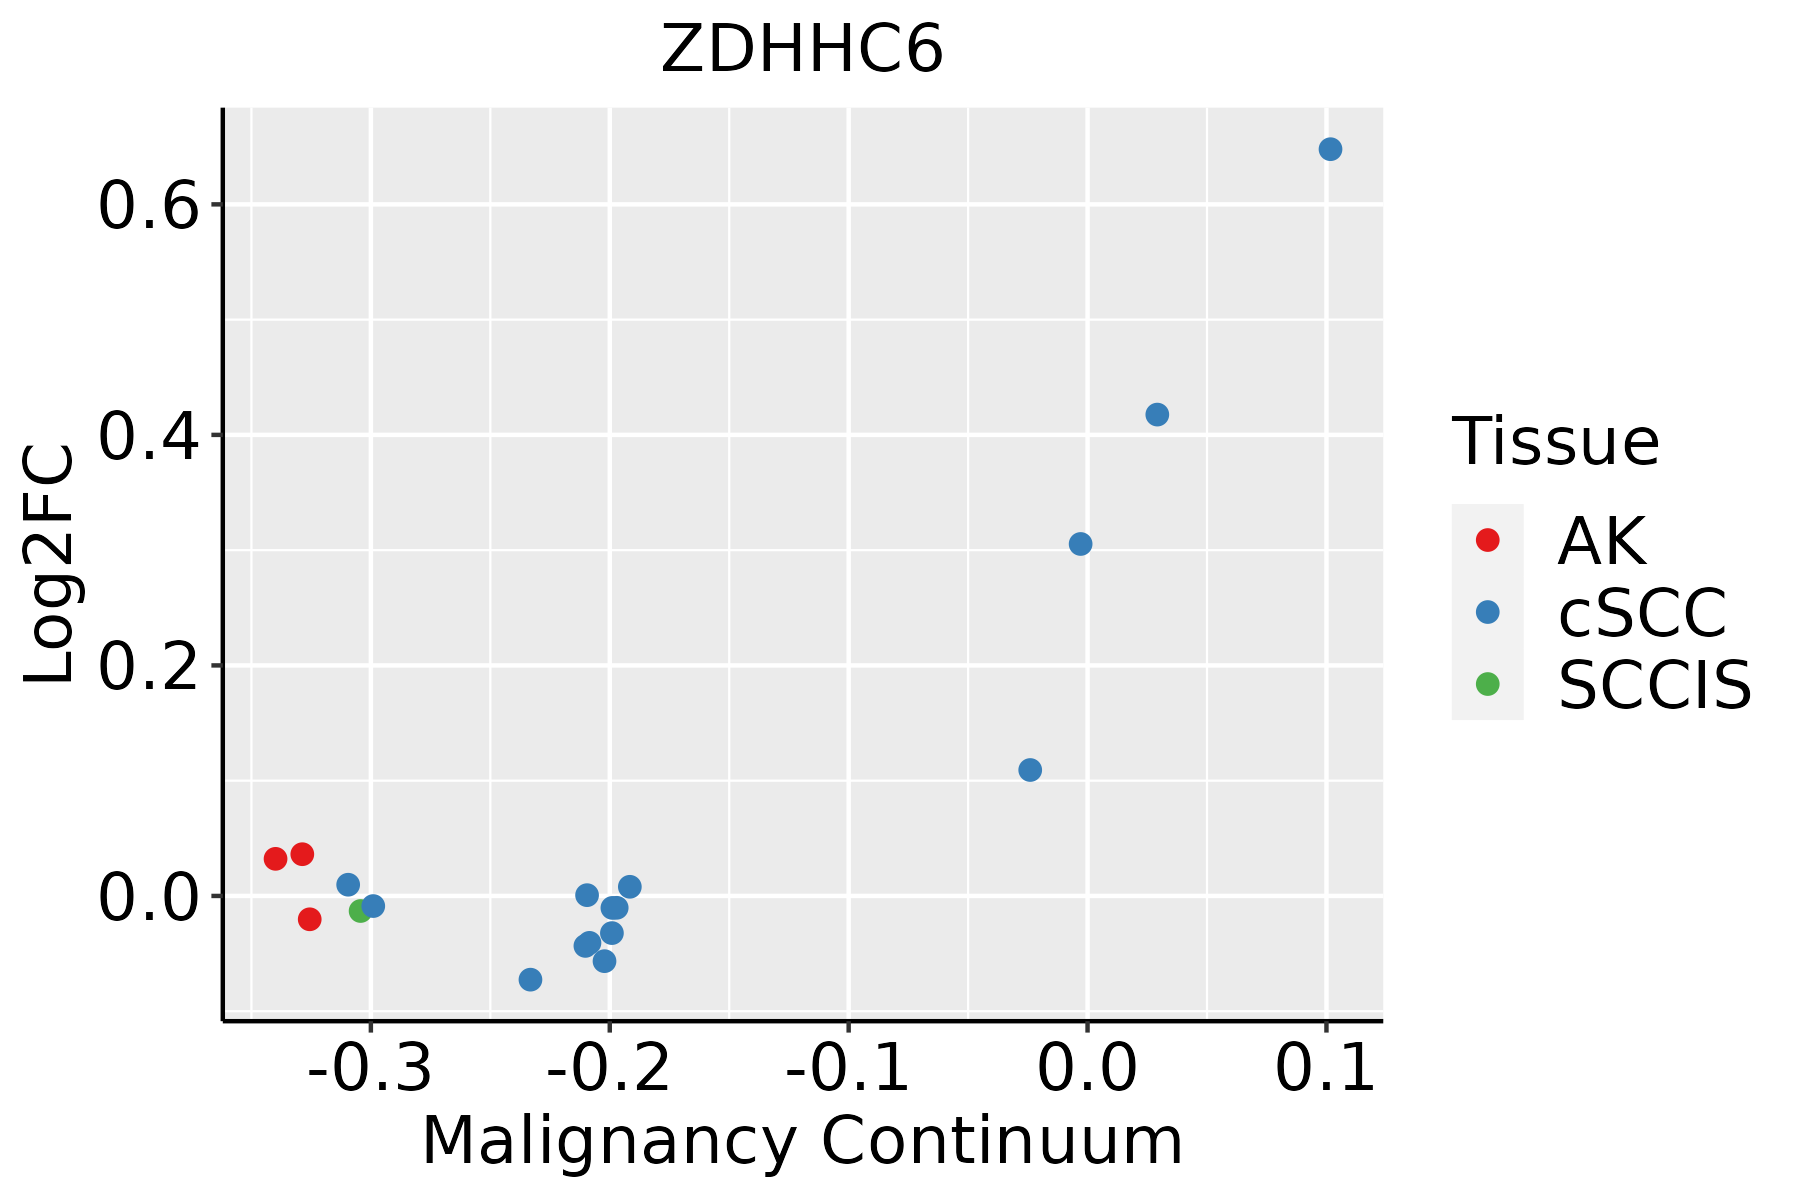 | AK: Actinic keratosis |
| cSCC: Cutaneous squamous cell carcinoma | ||
| SCCIS:squamous cell carcinoma in situ |
| ∗log2FC in expression of this searched gene in stem-like cells from each diseased tissue sample relative to stem-like cells in normal samples in each tissue plotted against the malignancy continuum. Samples are colored based on if they are from different disease stage. |
Top |
Malignant transformation related pathway analysis |
| Find out the enriched GO biological processes and KEGG pathways involved in transition from healthy to precancer to cancer |
| Tissue | Disease Stage | Enriched GO biological Processes |
| Colorectum | AD |  |
| Colorectum | SER |  |
| Colorectum | MSS |  |
| Colorectum | MSI-H |  |
| Colorectum | FAP |  |
| ∗Top 15 enriched GO BP terms are showed in the bar plot of each disease state in each tissue. Each row represents a significant GO biological process which is colored according to the -log10(p.adjust). |
| Page: 1 2 3 4 5 6 7 8 9 |
| GO ID | Tissue | Disease Stage | Description | Gene Ratio | Bg Ratio | pvalue | p.adjust | Count |
| GO:0006605111 | Esophagus | ESCC | protein targeting | 229/8552 | 314/18723 | 4.93e-23 | 1.01e-20 | 229 |
| GO:0090150110 | Esophagus | ESCC | establishment of protein localization to membrane | 182/8552 | 260/18723 | 1.27e-15 | 8.19e-14 | 182 |
| GO:004354313 | Esophagus | ESCC | protein acylation | 165/8552 | 243/18723 | 1.69e-12 | 7.14e-11 | 165 |
| GO:0010821110 | Esophagus | ESCC | regulation of mitochondrion organization | 107/8552 | 144/18723 | 2.31e-12 | 9.41e-11 | 107 |
| GO:001082215 | Esophagus | ESCC | positive regulation of mitochondrion organization | 58/8552 | 74/18723 | 8.55e-09 | 1.73e-07 | 58 |
| GO:00482844 | Esophagus | ESCC | organelle fusion | 94/8552 | 141/18723 | 3.72e-07 | 5.16e-06 | 94 |
| GO:00421573 | Esophagus | ESCC | lipoprotein metabolic process | 86/8552 | 135/18723 | 1.78e-05 | 1.57e-04 | 86 |
| GO:00064973 | Esophagus | ESCC | protein lipidation | 62/8552 | 92/18723 | 2.08e-05 | 1.80e-04 | 62 |
| GO:00421583 | Esophagus | ESCC | lipoprotein biosynthetic process | 64/8552 | 96/18723 | 2.61e-05 | 2.20e-04 | 64 |
| GO:00066124 | Esophagus | ESCC | protein targeting to membrane | 83/8552 | 131/18723 | 3.31e-05 | 2.73e-04 | 83 |
| GO:00080532 | Esophagus | ESCC | mitochondrial fusion | 20/8552 | 27/18723 | 2.61e-03 | 1.11e-02 | 20 |
| GO:00066057 | Liver | Cirrhotic | protein targeting | 148/4634 | 314/18723 | 3.86e-18 | 6.20e-16 | 148 |
| GO:00901507 | Liver | Cirrhotic | establishment of protein localization to membrane | 123/4634 | 260/18723 | 1.85e-15 | 2.15e-13 | 123 |
| GO:00435431 | Liver | Cirrhotic | protein acylation | 95/4634 | 243/18723 | 4.73e-07 | 1.07e-05 | 95 |
| GO:00108216 | Liver | Cirrhotic | regulation of mitochondrion organization | 62/4634 | 144/18723 | 1.09e-06 | 2.22e-05 | 62 |
| GO:00066122 | Liver | Cirrhotic | protein targeting to membrane | 53/4634 | 131/18723 | 5.17e-05 | 5.95e-04 | 53 |
| GO:0042157 | Liver | Cirrhotic | lipoprotein metabolic process | 53/4634 | 135/18723 | 1.32e-04 | 1.29e-03 | 53 |
| GO:00482842 | Liver | Cirrhotic | organelle fusion | 52/4634 | 141/18723 | 8.77e-04 | 6.31e-03 | 52 |
| GO:00108223 | Liver | Cirrhotic | positive regulation of mitochondrion organization | 30/4634 | 74/18723 | 1.97e-03 | 1.23e-02 | 30 |
| GO:0042158 | Liver | Cirrhotic | lipoprotein biosynthetic process | 36/4634 | 96/18723 | 3.69e-03 | 2.03e-02 | 36 |
| Page: 1 2 3 |
| Pathway ID | Tissue | Disease Stage | Description | Gene Ratio | Bg Ratio | pvalue | p.adjust | qvalue | Count |
| Page: 1 |
Top |
Cell-cell communication analysis |
| Identification of potential cell-cell interactions between two cell types and their ligand-receptor pairs for different disease states |
| Ligand | Receptor | LRpair | Pathway | Tissue | Disease Stage |
| Page: 1 |
Top |
Single-cell gene regulatory network inference analysis |
| Find out the significant the regulons (TFs) and the target genes of each regulon across cell types for different disease states |
| TF | Cell Type | Tissue | Disease Stage | Target Gene | RSS | Regulon Activity |
| ∗The dot plots of a searched regulon are shown for all cell subpopulations in each disease state of each tissue based on the regulon specific score inferred using pySCENIC and by calculating the average expression. |
| Page: 1 |
Top |
Somatic mutation of malignant transformation related genes |
| Annotation of somatic variants for genes involved in malignant transformation |
| Hugo Symbol | Variant Class | Variant Classification | dbSNP RS | HGVSc | HGVSp | HGVSp Short | SWISSPROT | BIOTYPE | SIFT | PolyPhen | Tumor Sample Barcode | Tissue | Histology | Sex | Age | Stage | Therapy Types | Drugs | Outcome |
| ZDHHC6 | SNV | Missense_Mutation | c.31G>C | p.Glu11Gln | p.E11Q | Q9H6R6 | protein_coding | deleterious_low_confidence(0.05) | benign(0.048) | TCGA-A8-A09G-01 | Breast | breast invasive carcinoma | Female | >=65 | III/IV | Unknown | Unknown | SD | |
| ZDHHC6 | SNV | Missense_Mutation | c.974N>A | p.Ser325Asn | p.S325N | Q9H6R6 | protein_coding | tolerated(0.3) | benign(0.01) | TCGA-AR-A24P-01 | Breast | breast invasive carcinoma | Female | <65 | I/II | Unknown | Unknown | SD | |
| ZDHHC6 | SNV | Missense_Mutation | rs369541274 | c.1219N>A | p.Glu407Lys | p.E407K | Q9H6R6 | protein_coding | tolerated(0.11) | benign(0.01) | TCGA-C8-A1HG-01 | Breast | breast invasive carcinoma | Female | <65 | I/II | Unknown | Unknown | SD |
| ZDHHC6 | SNV | Missense_Mutation | novel | c.347G>C | p.Arg116Thr | p.R116T | Q9H6R6 | protein_coding | deleterious(0) | probably_damaging(0.979) | TCGA-MA-AA3Y-01 | Cervix | cervical & endocervical cancer | Female | <65 | I/II | Unknown | Unknown | SD |
| ZDHHC6 | SNV | Missense_Mutation | rs748119885 | c.235N>A | p.Gly79Ser | p.G79S | Q9H6R6 | protein_coding | deleterious(0) | probably_damaging(1) | TCGA-A6-A565-01 | Colorectum | colon adenocarcinoma | Female | <65 | III/IV | Unspecific | 5FU | PD |
| ZDHHC6 | SNV | Missense_Mutation | c.275N>A | p.Ser92Tyr | p.S92Y | Q9H6R6 | protein_coding | deleterious(0) | benign(0.266) | TCGA-CA-6718-01 | Colorectum | colon adenocarcinoma | Male | <65 | I/II | Unknown | Unknown | PD | |
| ZDHHC6 | SNV | Missense_Mutation | c.1117N>A | p.Leu373Ile | p.L373I | Q9H6R6 | protein_coding | tolerated(0.29) | benign(0.109) | TCGA-AG-A002-01 | Colorectum | rectum adenocarcinoma | Male | <65 | I/II | Unknown | Unknown | SD | |
| ZDHHC6 | deletion | Frame_Shift_Del | c.1225delN | p.Glu409ArgfsTer9 | p.E409Rfs*9 | Q9H6R6 | protein_coding | TCGA-AA-3950-01 | Colorectum | colon adenocarcinoma | Female | >=65 | I/II | Unknown | Unknown | SD | |||
| ZDHHC6 | SNV | Missense_Mutation | novel | c.253N>A | p.Leu85Met | p.L85M | Q9H6R6 | protein_coding | tolerated(0.06) | possibly_damaging(0.476) | TCGA-A5-A0G2-01 | Endometrium | uterine corpus endometrioid carcinoma | Female | <65 | III/IV | Unknown | Unknown | SD |
| ZDHHC6 | SNV | Missense_Mutation | c.149N>G | p.His50Arg | p.H50R | Q9H6R6 | protein_coding | tolerated(0.58) | benign(0.216) | TCGA-AP-A05N-01 | Endometrium | uterine corpus endometrioid carcinoma | Female | <65 | I/II | Unknown | Unknown | SD |
| Page: 1 2 3 4 |
Top |
Related drugs of malignant transformation related genes |
| Identification of chemicals and drugs interact with genes involved in malignant transfromation |
| (DGIdb 4.0) |
| Entrez ID | Symbol | Category | Interaction Types | Drug Claim Name | Drug Name | PMIDs |
| Page: 1 |

Copyright 2023-Present -The University of Texas Health Science Center at Houston |