Schematic overview of the cellular and molecular mechanisms involved in the cancer progression, including the proposed cellular and molecular mechanisms in cancer cells trajectory. AT1: alveolar type 1 cells; AT2: alveolar type 2 cells; AAH: atypical adenomatous hyperplasia; AIS: adenocarcinoma in situ; MIA: minimally invasive adenocarcinoma; IA: invasive adenocarcinoma; EMT: epithelial-mesenchymal transition

Home

Download

Statistics

Help

Contact

Center for Computational Systems Medicine
leaf

Gene summary

leaf

Malignant transformation analysis

leaf

Malignant transformation related pathway analysis

leaf

Cell-cell communication analysis

leaf

Single-cell gene regulatory network inference analysis

leaf

Somatic mutation of malignant transformation related genes

leaf

Related drugs of malignant transformation related genes

Gene: ZDHHC5

Gene summary for ZDHHC5

check button Gene summary.

Gene informationSpeciesHuman
Gene symbol

ZDHHC5

Gene ID

25921

Gene namezinc finger DHHC-type palmitoyltransferase 5
Gene AliasDHHC5
Cytomap11q12.1
Gene Typeprotein-coding
GO ID

GO:0002221

UniProtAcc

A0A024R546


Top

Malignant transformation analysis

check button Identification of the aberrant gene expression in precancerous and cancerous lesions by comparing the gene expression of stem-like cells in diseased tissues with normal stem cells
check button Malignant transformation involving gene list.
Entrez IDSymbolReplicatesSpeciesOrganTissueAdj P-valueLog2FCMalignancy
25921ZDHHC5HTA11_2487_2000001011HumanColorectumSER6.54e-063.58e-01-0.1808
25921ZDHHC5HTA11_1938_2000001011HumanColorectumAD8.27e-104.71e-01-0.0811
25921ZDHHC5HTA11_347_2000001011HumanColorectumAD9.77e-154.42e-01-0.1954
25921ZDHHC5HTA11_3361_2000001011HumanColorectumAD1.39e-031.98e-01-0.1207
25921ZDHHC5HTA11_696_2000001011HumanColorectumAD1.37e-043.79e-01-0.1464
25921ZDHHC5HTA11_1391_2000001011HumanColorectumAD9.20e-094.78e-01-0.059
25921ZDHHC5HTA11_546_2000001011HumanColorectumAD5.88e-042.66e-01-0.0842
25921ZDHHC5HTA11_10711_2000001011HumanColorectumAD7.71e-031.69e-020.0338
25921ZDHHC5HTA11_99999965104_69814HumanColorectumMSS1.63e-053.30e-010.281
25921ZDHHC5A015-C-203HumanColorectumFAP1.08e-06-1.71e-01-0.1294
25921ZDHHC5A015-C-104HumanColorectumFAP2.83e-08-1.99e-01-0.1899
25921ZDHHC5A001-C-014HumanColorectumFAP1.24e-02-1.48e-010.0135
25921ZDHHC5A002-C-116HumanColorectumFAP1.43e-06-1.24e-01-0.0452
25921ZDHHC5F034HumanColorectumFAP4.42e-05-1.10e-01-0.0665
25921ZDHHC5F072BHumanColorectumFAP2.79e-04-1.73e-010.257
25921ZDHHC5LZE2THumanEsophagusESCC3.14e-044.06e-010.082
25921ZDHHC5LZE7THumanEsophagusESCC2.13e-021.04e-010.0667
25921ZDHHC5LZE22THumanEsophagusESCC4.19e-042.27e-010.068
25921ZDHHC5LZE24THumanEsophagusESCC1.29e-113.41e-010.0596
25921ZDHHC5P1T-EHumanEsophagusESCC3.83e-072.73e-010.0875
Page: 1 2 3 4 5 6 

check button Transcriptomic changes along malignancy continuum.
TissueExpression DynamicsAbbreviation
Colorectum (GSE201348)The image shows the transcriptomic changes along malignancy continuum.log2FC in expression of this searched gene in stem-like cells from each diseased tissue sample relative to stem-like cells in normal samples in each tissue plotted against the malignancy continuum. Samples are colored based on if they are from different disease stage.FAP: Familial adenomatous polyposis
CRC: Colorectal cancer
Colorectum (HTA11)The image shows the transcriptomic changes along malignancy continuum.log2FC in expression of this searched gene in stem-like cells from each diseased tissue sample relative to stem-like cells in normal samples in each tissue plotted against the malignancy continuum. Samples are colored based on if they are from different disease stage.AD: Adenomas
SER: Sessile serrated lesions
MSI-H: Microsatellite-high colorectal cancer
MSS: Microsatellite stable colorectal cancer
EsophagusThe image shows the transcriptomic changes along malignancy continuum.log2FC in expression of this searched gene in stem-like cells from each diseased tissue sample relative to stem-like cells in normal samples in each tissue plotted against the malignancy continuum. Samples are colored based on if they are from different disease stage.ESCC: Esophageal squamous cell carcinoma
HGIN: High-grade intraepithelial neoplasias
LGIN: Low-grade intraepithelial neoplasias
LiverThe image shows the transcriptomic changes along malignancy continuum.log2FC in expression of this searched gene in stem-like cells from each diseased tissue sample relative to stem-like cells in normal samples in each tissue plotted against the malignancy continuum. Samples are colored based on if they are from different disease stage.
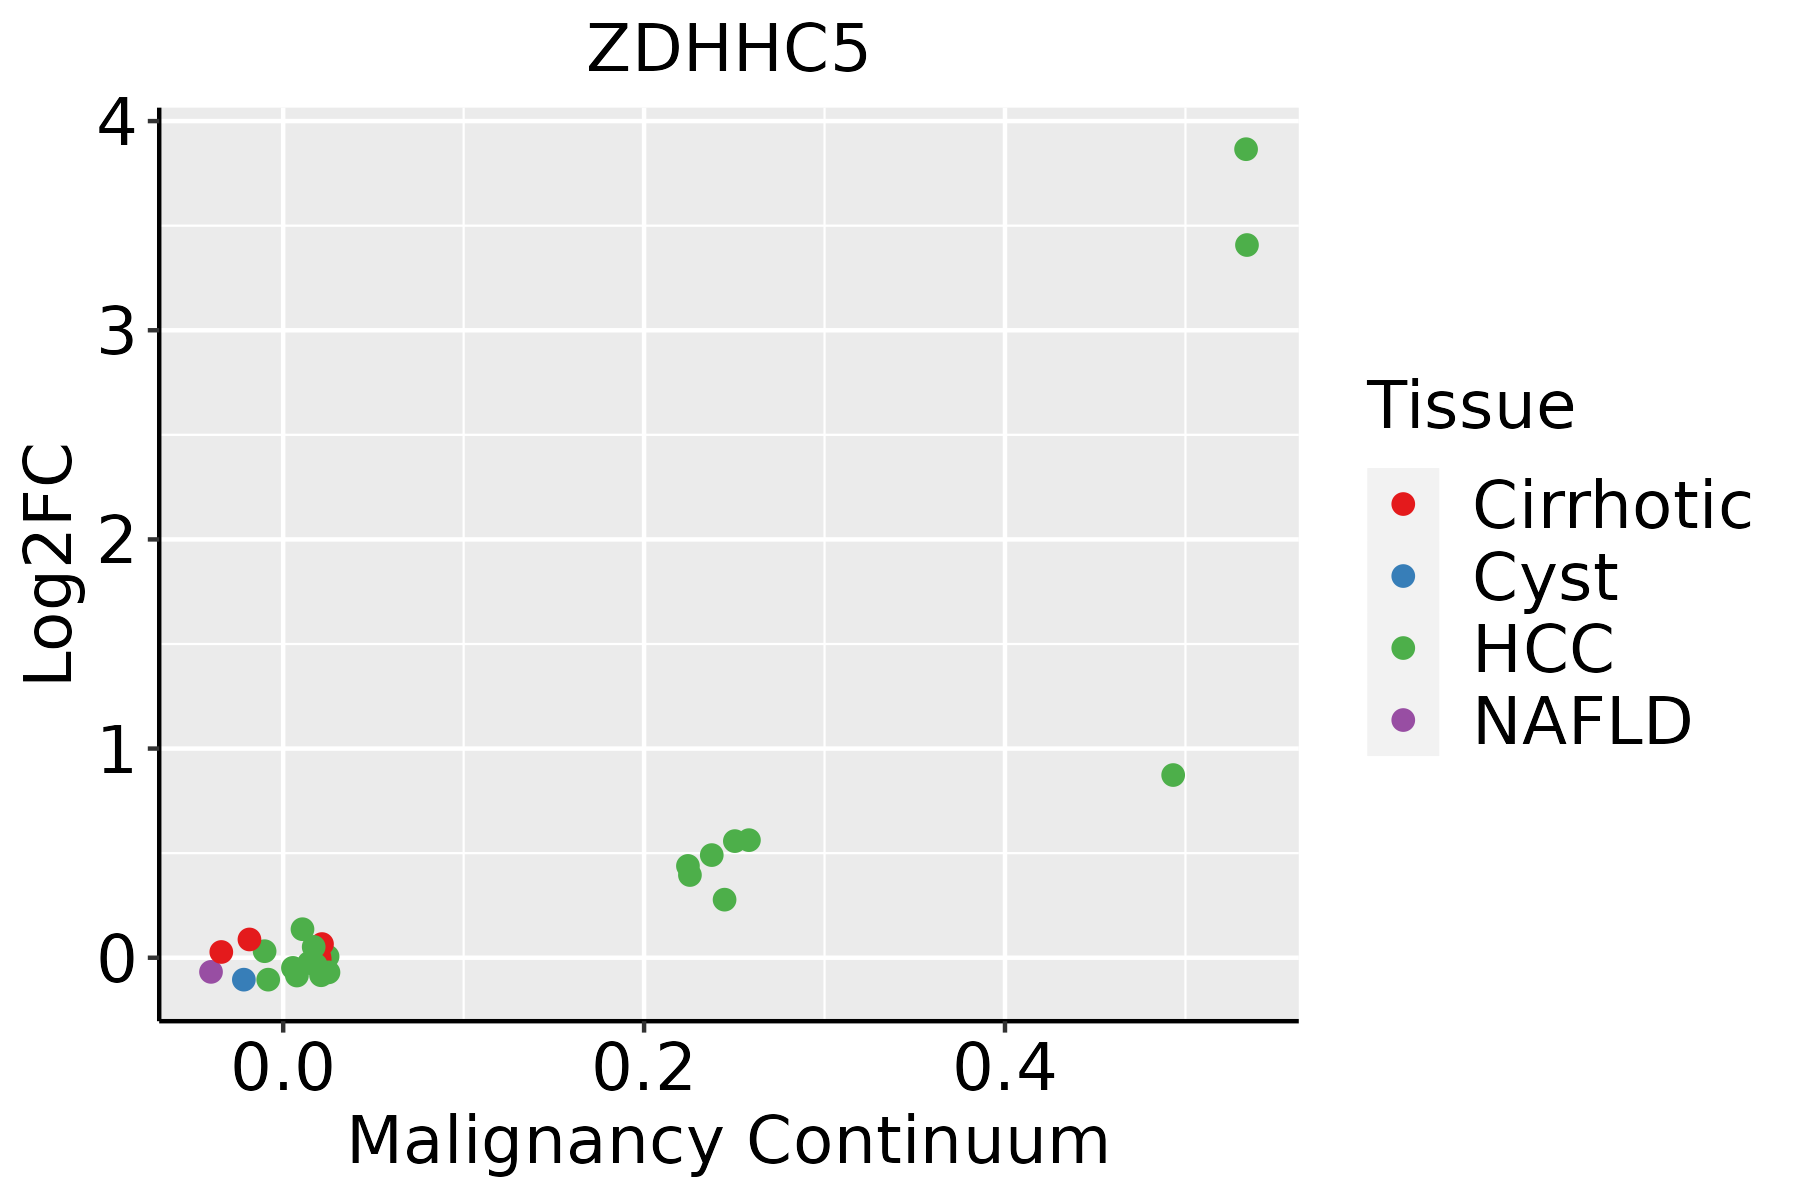
HCC: Hepatocellular carcinoma
NAFLD: Non-alcoholic fatty liver disease
Oral CavityThe image shows the transcriptomic changes along malignancy continuum.log2FC in expression of this searched gene in stem-like cells from each diseased tissue sample relative to stem-like cells in normal samples in each tissue plotted against the malignancy continuum. Samples are colored based on if they are from different disease stage.EOLP: Erosive Oral lichen planus
LP: leukoplakia
NEOLP: Non-erosive oral lichen planus
OSCC: Oral squamous cell carcinoma
SkinThe image shows the transcriptomic changes along malignancy continuum.log2FC in expression of this searched gene in stem-like cells from each diseased tissue sample relative to stem-like cells in normal samples in each tissue plotted against the malignancy continuum. Samples are colored based on if they are from different disease stage.
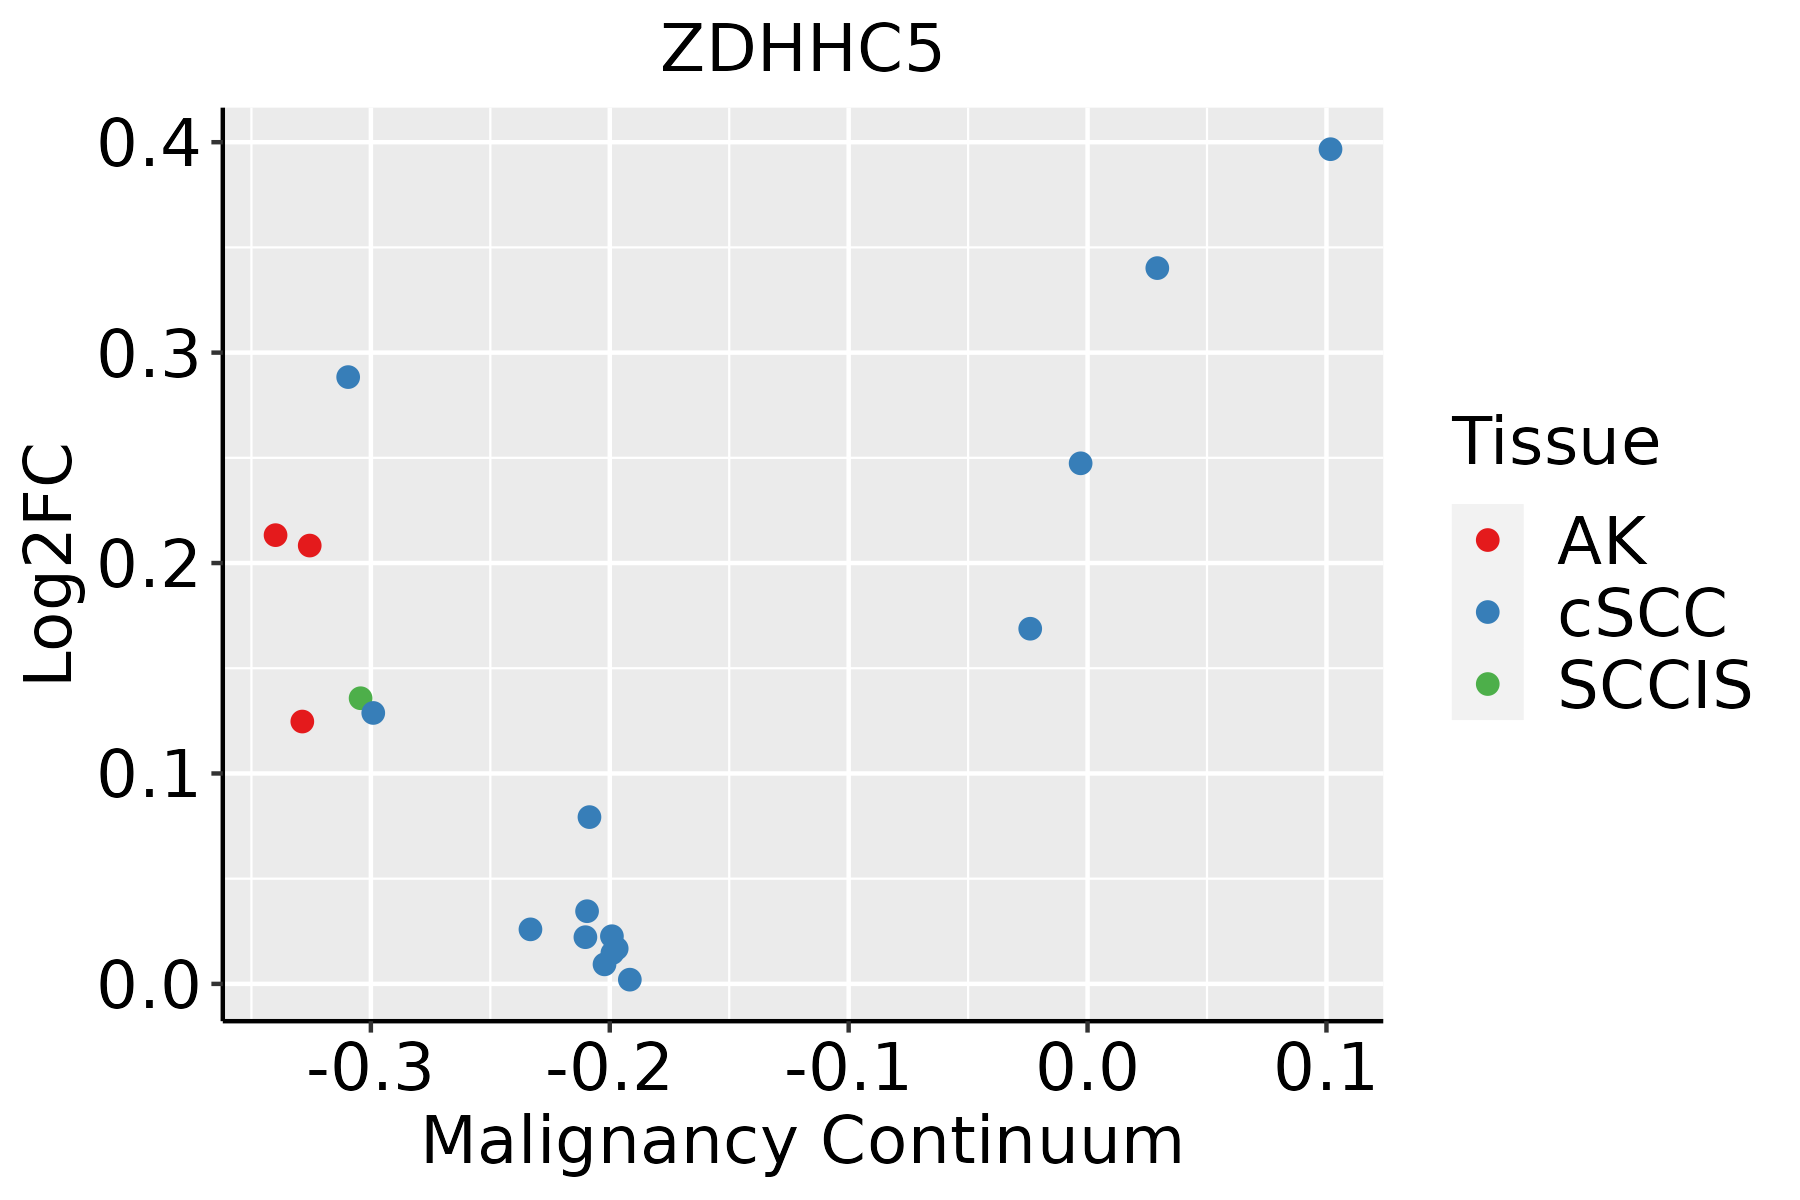
AK: Actinic keratosis
cSCC: Cutaneous squamous cell carcinoma
SCCIS:squamous cell carcinoma in situ
ThyroidThe image shows the transcriptomic changes along malignancy continuum.log2FC in expression of this searched gene in stem-like cells from each diseased tissue sample relative to stem-like cells in normal samples in each tissue plotted against the malignancy continuum. Samples are colored based on if they are from different disease stage.
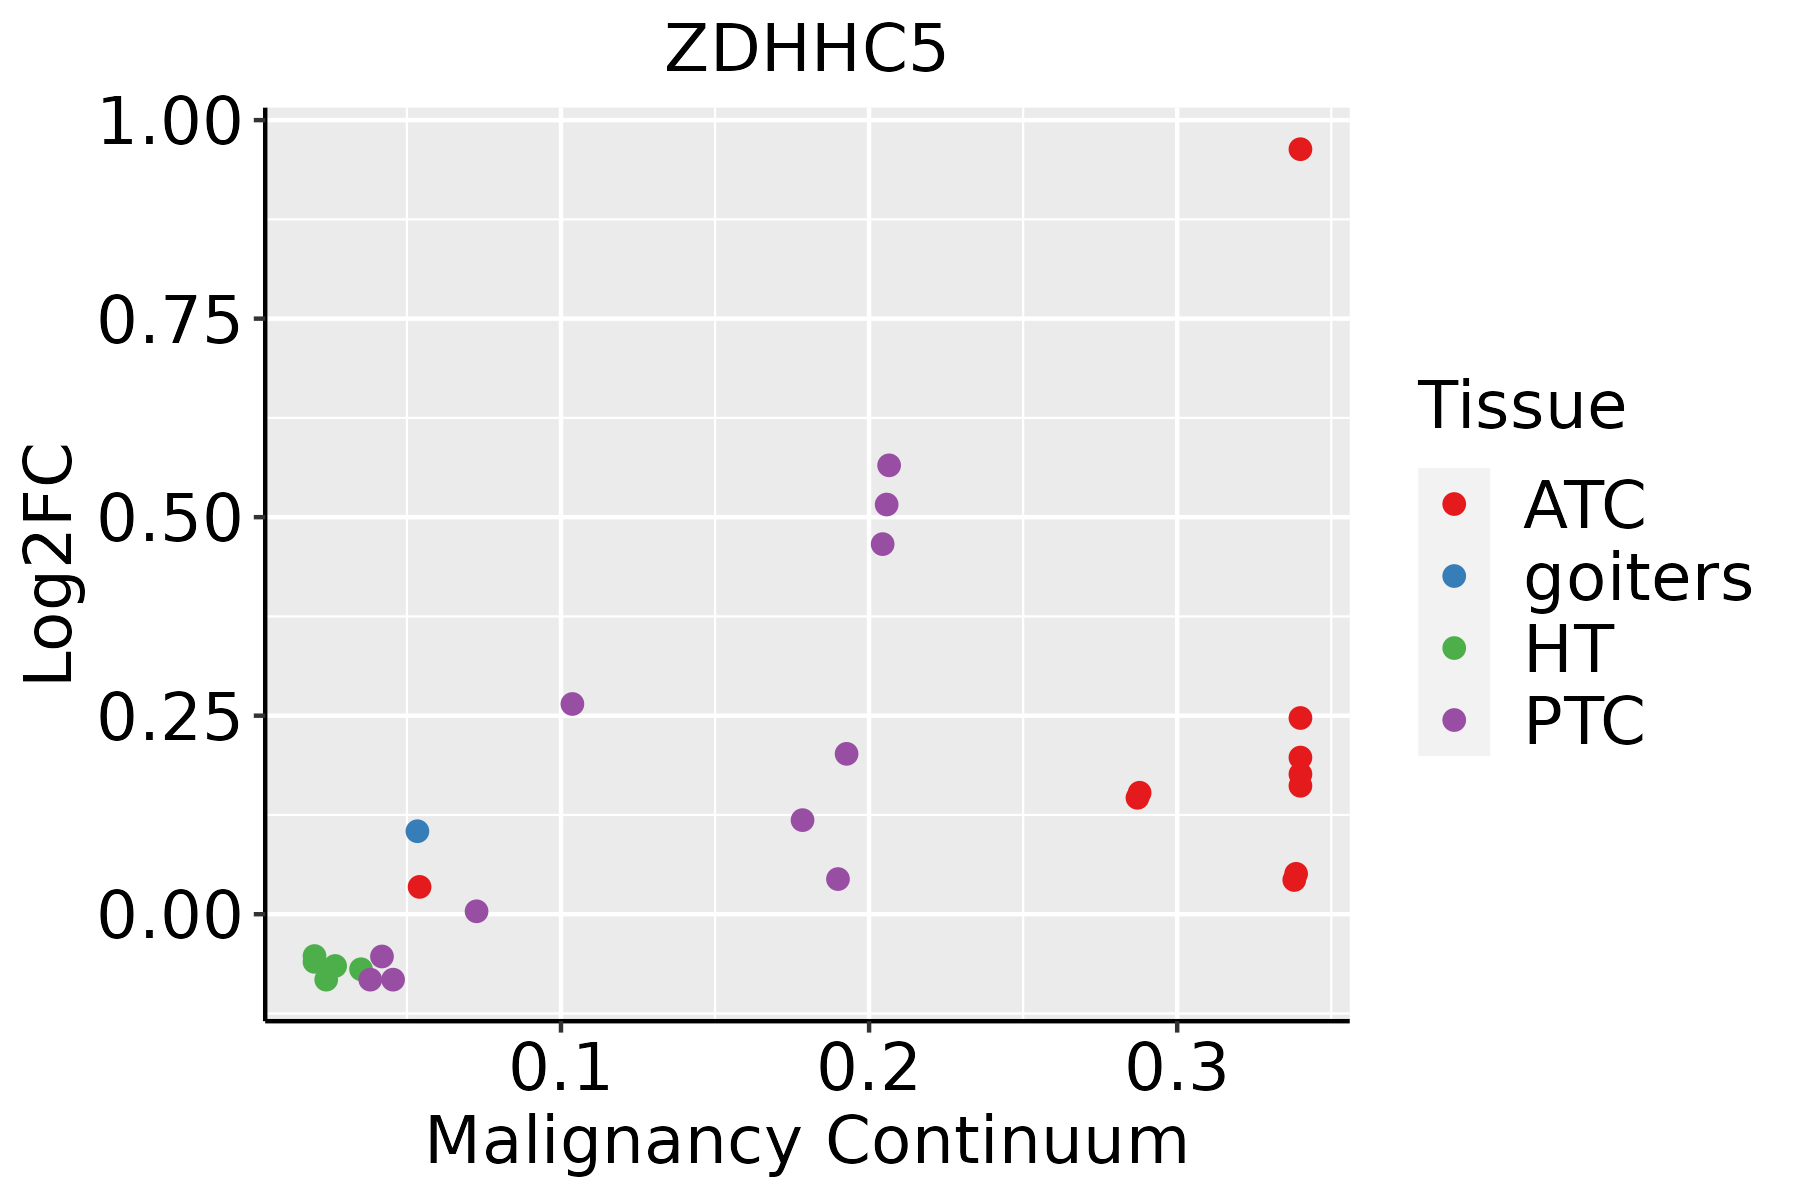
ATC: Anaplastic thyroid cancer
HT: Hashimoto's thyroiditis
PTC: Papillary thyroid cancer
∗log2FC in expression of this searched gene in stem-like cells from each diseased tissue sample relative to stem-like cells in normal samples in each tissue plotted against the malignancy continuum. Samples are colored based on if they are from different disease stage.

Top

Malignant transformation related pathway analysis

check buttonFind out the enriched GO biological processes and KEGG pathways involved in transition from healthy to precancer to cancer
check button Figure of enriched GO biological processes.
TissueDisease StageEnriched GO biological Processes
ColorectumADGO analysis - Figure of enriched GO biological processes: Top 15 enriched GO BP terms are showed in the bar plot of each disease state in each tissue. Each row represents a significant GO biological process which is colored according to the -log10(p.adjust).
ColorectumSERGO analysis - Figure of enriched GO biological processes: Top 15 enriched GO BP terms are showed in the bar plot of each disease state in each tissue. Each row represents a significant GO biological process which is colored according to the -log10(p.adjust).
ColorectumMSSGO analysis - Figure of enriched GO biological processes: Top 15 enriched GO BP terms are showed in the bar plot of each disease state in each tissue. Each row represents a significant GO biological process which is colored according to the -log10(p.adjust).
ColorectumMSI-HGO analysis - Figure of enriched GO biological processes: Top 15 enriched GO BP terms are showed in the bar plot of each disease state in each tissue. Each row represents a significant GO biological process which is colored according to the -log10(p.adjust).
ColorectumFAPGO analysis - Figure of enriched GO biological processes: Top 15 enriched GO BP terms are showed in the bar plot of each disease state in each tissue. Each row represents a significant GO biological process which is colored according to the -log10(p.adjust).
∗Top 15 enriched GO BP terms are showed in the bar plot of each disease state in each tissue. Each row represents a significant GO biological process which is colored according to the -log10(p.adjust).
Page: 1 2 3 4 5 6 7 8 9 

check button Enriched GO biological processes.
GO IDTissueDisease StageDescriptionGene RatioBg Ratiopvaluep.adjustCount
GO:0072659ColorectumADprotein localization to plasma membrane122/3918284/187232.86e-171.49e-14122
GO:1990778ColorectumADprotein localization to cell periphery129/3918333/187235.51e-141.15e-11129
GO:1903829ColorectumADpositive regulation of cellular protein localization110/3918276/187234.58e-138.44e-11110
GO:1905475ColorectumADregulation of protein localization to membrane73/3918175/187233.37e-102.93e-0873
GO:1903076ColorectumADregulation of protein localization to plasma membrane48/3918104/187237.17e-094.36e-0748
GO:1904375ColorectumADregulation of protein localization to cell periphery54/3918125/187231.52e-089.00e-0754
GO:1905477ColorectumADpositive regulation of protein localization to membrane46/3918106/187231.47e-076.64e-0646
GO:1903078ColorectumADpositive regulation of protein localization to plasma membrane28/391862/187231.57e-053.34e-0428
GO:1904377ColorectumADpositive regulation of protein localization to cell periphery30/391869/187231.98e-054.05e-0430
GO:00726591ColorectumSERprotein localization to plasma membrane92/2897284/187236.36e-131.86e-1092
GO:19038291ColorectumSERpositive regulation of cellular protein localization86/2897276/187233.61e-116.11e-0986
GO:19907781ColorectumSERprotein localization to cell periphery98/2897333/187236.09e-119.57e-0998
GO:19030761ColorectumSERregulation of protein localization to plasma membrane36/2897104/187231.12e-065.18e-0536
GO:19054751ColorectumSERregulation of protein localization to membrane52/2897175/187231.31e-066.04e-0552
GO:19043751ColorectumSERregulation of protein localization to cell periphery40/2897125/187232.85e-061.16e-0440
GO:19054771ColorectumSERpositive regulation of protein localization to membrane33/2897106/187233.83e-059.82e-0433
GO:19030781ColorectumSERpositive regulation of protein localization to plasma membrane22/289762/187238.58e-051.88e-0322
GO:19043771ColorectumSERpositive regulation of protein localization to cell periphery23/289769/187231.78e-043.30e-0323
GO:00726592ColorectumMSSprotein localization to plasma membrane113/3467284/187233.23e-171.55e-14113
GO:19907782ColorectumMSSprotein localization to cell periphery120/3467333/187232.02e-145.47e-12120
Page: 1 2 3 4 5 6 7 

check button Enriched KEGG pathways.
Pathway IDTissueDisease StageDescriptionGene RatioBg Ratiopvaluep.adjustqvalueCount
Page: 1 

Top

Cell-cell communication analysis

check buttonIdentification of potential cell-cell interactions between two cell types and their ligand-receptor pairs for different disease states
LigandReceptorLRpairPathwayTissueDisease Stage
Page: 1 

Top

Single-cell gene regulatory network inference analysis

check buttonFind out the significant the regulons (TFs) and the target genes of each regulon across cell types for different disease states
TFCell TypeTissueDisease StageTarget GeneRSSRegulon Activity
∗The dot plots of a searched regulon are shown for all cell subpopulations in each disease state of each tissue based on the regulon specific score inferred using pySCENIC and by calculating the average expression.
Page: 1 

Top

Somatic mutation of malignant transformation related genes

check buttonAnnotation of somatic variants for genes involved in malignant transformation
Hugo SymbolVariant ClassVariant ClassificationdbSNP RSHGVScHGVSpHGVSp ShortSWISSPROTBIOTYPESIFTPolyPhenTumor Sample BarcodeTissueHistologySexAgeStageTherapy TypesDrugsOutcome
ZDHHC5SNVMissense_Mutationrs766814291c.2087C>Tp.Thr696Metp.T696MQ9C0B5protein_codingdeleterious(0.03)probably_damaging(0.912)TCGA-A2-A0YH-01Breastbreast invasive carcinomaFemale<65III/IVChemotherapyadriamycinSD
ZDHHC5SNVMissense_Mutationc.1519N>Ap.Ala507Thrp.A507TQ9C0B5protein_codingtolerated(0.14)benign(0.031)TCGA-AN-A0AK-01Breastbreast invasive carcinomaFemale>=65I/IIUnknownUnknownSD
ZDHHC5SNVMissense_Mutationc.1917N>Gp.Ser639Argp.S639RQ9C0B5protein_codingtolerated(0.15)probably_damaging(0.924)TCGA-E2-A1B1-01Breastbreast invasive carcinomaFemale<65I/IIOther, specify in notesbiphosphonatezoledronicSD
ZDHHC5SNVMissense_Mutationnovelc.1226N>Gp.Ser409Cysp.S409CQ9C0B5protein_codingdeleterious(0.01)probably_damaging(0.912)TCGA-OL-A5DA-01Breastbreast invasive carcinomaFemale<65I/IIUnknownUnknownSD
ZDHHC5SNVMissense_Mutationc.2122N>Tp.Gly708Cysp.G708CQ9C0B5protein_codingdeleterious(0)probably_damaging(0.999)TCGA-OL-A5RZ-01Breastbreast invasive carcinomaFemale<65I/IIChemotherapydoxorubicinCR
ZDHHC5insertionFrame_Shift_Insnovelc.964_965insCTCCATCTCTAAAACAGACTAAAATAAAAAATAGAAAAATTTTCTGp.Arg322ProfsTer29p.R322Pfs*29Q9C0B5protein_codingTCGA-AN-A0FX-01Breastbreast invasive carcinomaFemale<65I/IIUnknownUnknownSD
ZDHHC5insertionFrame_Shift_Insnovelc.225_226insGGAAAACATGTGGCAAGATCCACAGp.Ala76GlyfsTer10p.A76Gfs*10Q9C0B5protein_codingTCGA-BH-A0HF-01Breastbreast invasive carcinomaFemale>=65I/IIHormone TherapyarimidexSD
ZDHHC5SNVMissense_Mutationnovelc.1147N>Cp.Glu383Glnp.E383QQ9C0B5protein_codingtolerated(0.33)benign(0.015)TCGA-EX-A1H6-01Cervixcervical & endocervical cancerFemale<65I/IIUnknownUnknownSD
ZDHHC5SNVMissense_Mutationc.1508C>Tp.Ser503Leup.S503LQ9C0B5protein_codingdeleterious(0.01)possibly_damaging(0.459)TCGA-IR-A3LL-01Cervixcervical & endocervical cancerFemale<65I/IIChemotherapycisplatinCR
ZDHHC5SNVMissense_Mutationc.1249N>Gp.His417Aspp.H417DQ9C0B5protein_codingtolerated(0.18)benign(0.04)TCGA-LP-A4AV-01Cervixcervical & endocervical cancerFemale<65I/IIUnknownUnknownSD
Page: 1 2 3 4 5 6 7 8 

Top

Related drugs of malignant transformation related genes

check buttonIdentification of chemicals and drugs interact with genes involved in malignant transfromation
(DGIdb 4.0)
Entrez IDSymbolCategoryInteraction TypesDrug Claim NameDrug NamePMIDs
Page: 1