
|
|||||
|
 | |
| |
| |
| |
| |
| |
|
Gene: ZDHHC3 |
Gene summary for ZDHHC3 |
| Gene information | Species | Human | Gene symbol | ZDHHC3 | Gene ID | 51304 |
| Gene name | zinc finger DHHC-type palmitoyltransferase 3 | |
| Gene Alias | DHHC-3 | |
| Cytomap | 3p21.31 | |
| Gene Type | protein-coding | GO ID | GO:0006464 | UniProtAcc | Q9NYG2 |
Top |
Malignant transformation analysis |
| Identification of the aberrant gene expression in precancerous and cancerous lesions by comparing the gene expression of stem-like cells in diseased tissues with normal stem cells |
| Entrez ID | Symbol | Replicates | Species | Organ | Tissue | Adj P-value | Log2FC | Malignancy |
| 51304 | ZDHHC3 | HTA11_2487_2000001011 | Human | Colorectum | SER | 2.24e-02 | 4.24e-01 | -0.1808 |
| 51304 | ZDHHC3 | HTA11_1938_2000001011 | Human | Colorectum | AD | 8.96e-06 | 6.13e-01 | -0.0811 |
| 51304 | ZDHHC3 | HTA11_78_2000001011 | Human | Colorectum | AD | 4.62e-05 | 4.43e-01 | -0.1088 |
| 51304 | ZDHHC3 | HTA11_347_2000001011 | Human | Colorectum | AD | 3.18e-14 | 5.83e-01 | -0.1954 |
| 51304 | ZDHHC3 | HTA11_1391_2000001011 | Human | Colorectum | AD | 2.11e-05 | 5.27e-01 | -0.059 |
| 51304 | ZDHHC3 | HTA11_99999971662_82457 | Human | Colorectum | MSS | 2.71e-03 | 4.93e-01 | 0.3859 |
| 51304 | ZDHHC3 | A015-C-203 | Human | Colorectum | FAP | 1.79e-10 | -1.66e-01 | -0.1294 |
| 51304 | ZDHHC3 | A002-C-201 | Human | Colorectum | FAP | 6.26e-06 | -1.41e-01 | 0.0324 |
| 51304 | ZDHHC3 | A001-C-119 | Human | Colorectum | FAP | 5.83e-03 | -3.10e-01 | -0.1557 |
| 51304 | ZDHHC3 | A001-C-108 | Human | Colorectum | FAP | 1.05e-05 | -9.38e-02 | -0.0272 |
| 51304 | ZDHHC3 | A002-C-205 | Human | Colorectum | FAP | 6.92e-11 | -9.64e-02 | -0.1236 |
| 51304 | ZDHHC3 | A015-C-006 | Human | Colorectum | FAP | 8.40e-08 | -2.46e-01 | -0.0994 |
| 51304 | ZDHHC3 | A015-C-106 | Human | Colorectum | FAP | 6.41e-03 | -8.23e-02 | -0.0511 |
| 51304 | ZDHHC3 | A002-C-114 | Human | Colorectum | FAP | 3.55e-08 | -9.58e-02 | -0.1561 |
| 51304 | ZDHHC3 | A015-C-104 | Human | Colorectum | FAP | 1.32e-12 | -1.37e-01 | -0.1899 |
| 51304 | ZDHHC3 | A001-C-014 | Human | Colorectum | FAP | 2.22e-04 | -4.46e-02 | 0.0135 |
| 51304 | ZDHHC3 | A002-C-016 | Human | Colorectum | FAP | 6.51e-08 | -9.67e-02 | 0.0521 |
| 51304 | ZDHHC3 | A015-C-002 | Human | Colorectum | FAP | 2.88e-05 | -3.49e-02 | -0.0763 |
| 51304 | ZDHHC3 | A001-C-203 | Human | Colorectum | FAP | 2.49e-03 | 5.54e-02 | -0.0481 |
| 51304 | ZDHHC3 | A002-C-116 | Human | Colorectum | FAP | 3.77e-13 | -7.77e-02 | -0.0452 |
| Page: 1 2 3 4 5 6 7 8 |
| Tissue | Expression Dynamics | Abbreviation |
| Colorectum (GSE201348) |  | FAP: Familial adenomatous polyposis |
| CRC: Colorectal cancer | ||
| Colorectum (HTA11) |  | AD: Adenomas |
| SER: Sessile serrated lesions | ||
| MSI-H: Microsatellite-high colorectal cancer | ||
| MSS: Microsatellite stable colorectal cancer | ||
| Esophagus | 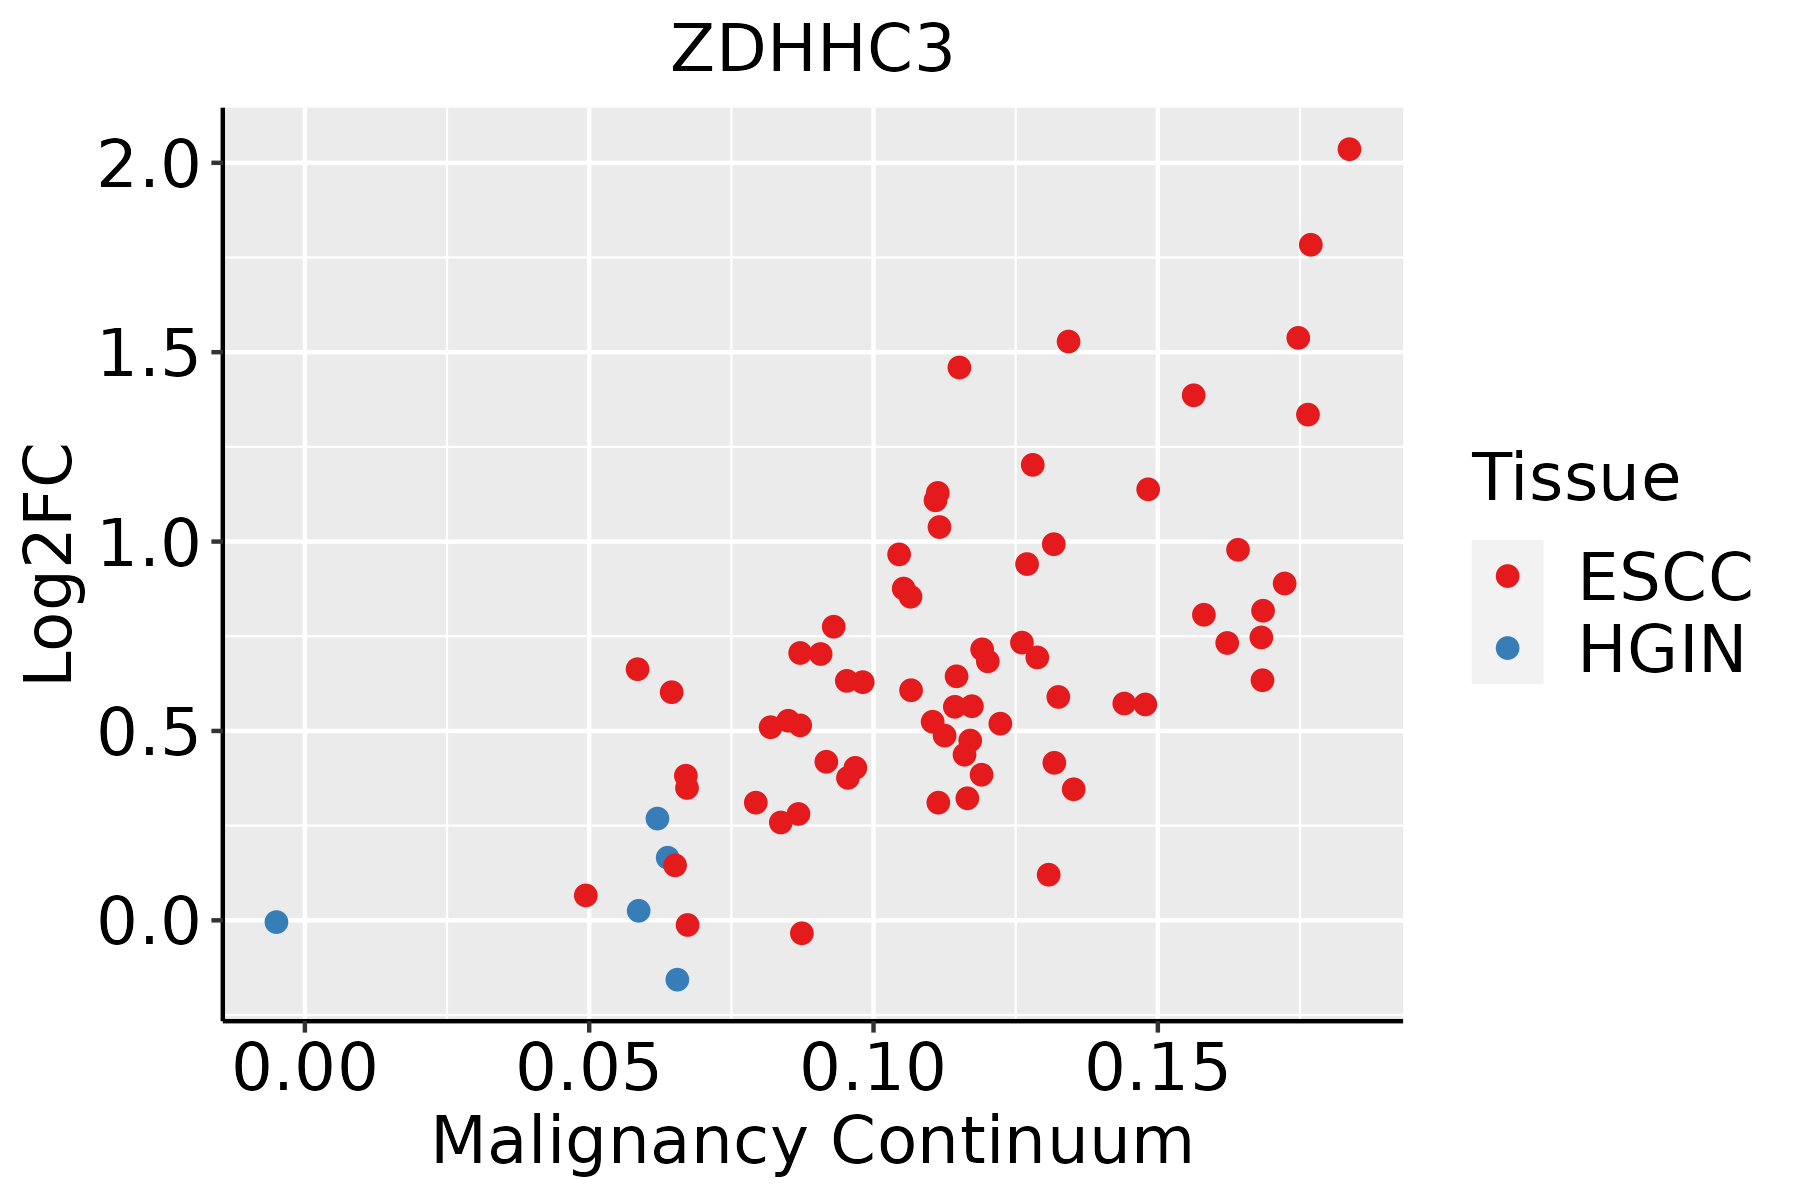 | ESCC: Esophageal squamous cell carcinoma |
| HGIN: High-grade intraepithelial neoplasias | ||
| LGIN: Low-grade intraepithelial neoplasias | ||
| Liver | 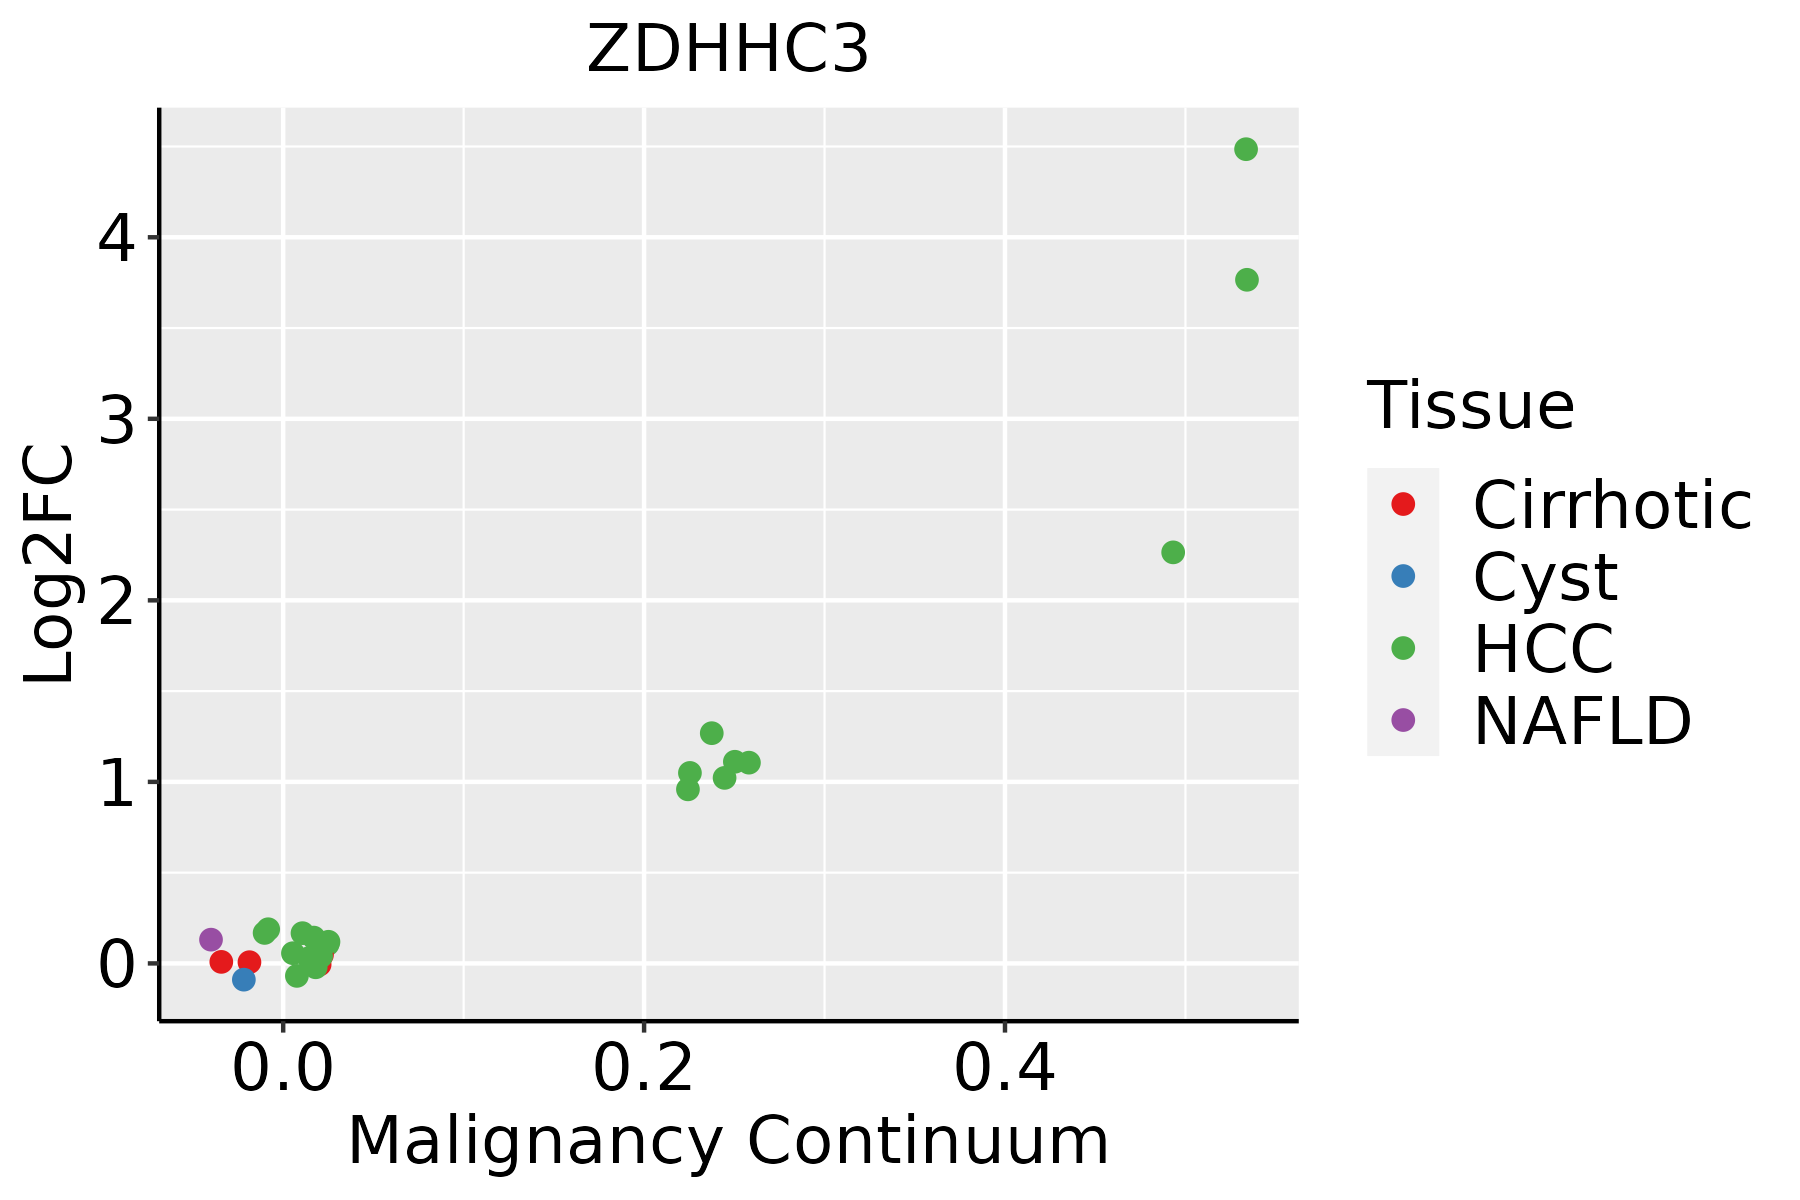 | HCC: Hepatocellular carcinoma |
| NAFLD: Non-alcoholic fatty liver disease | ||
| Lung | 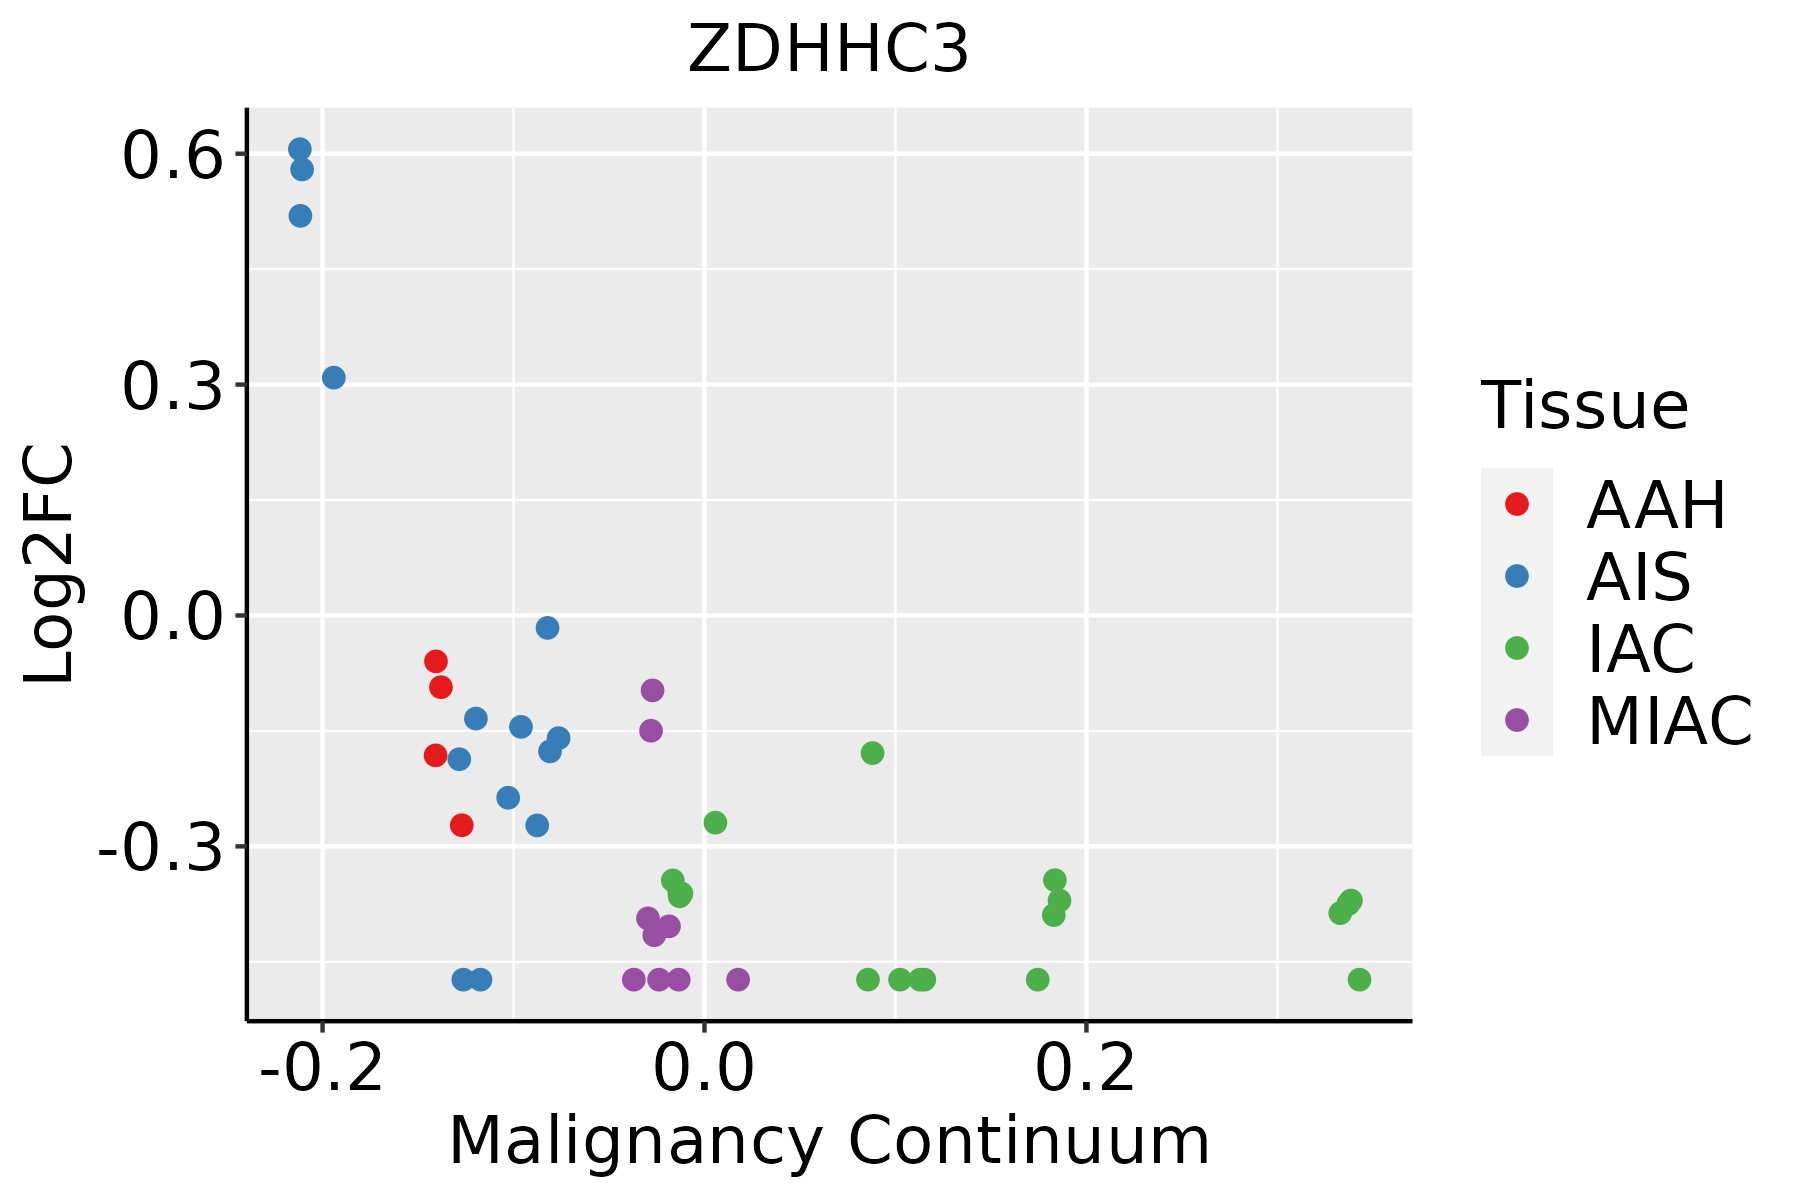 | AAH: Atypical adenomatous hyperplasia |
| AIS: Adenocarcinoma in situ | ||
| IAC: Invasive lung adenocarcinoma | ||
| MIA: Minimally invasive adenocarcinoma | ||
| Oral Cavity | 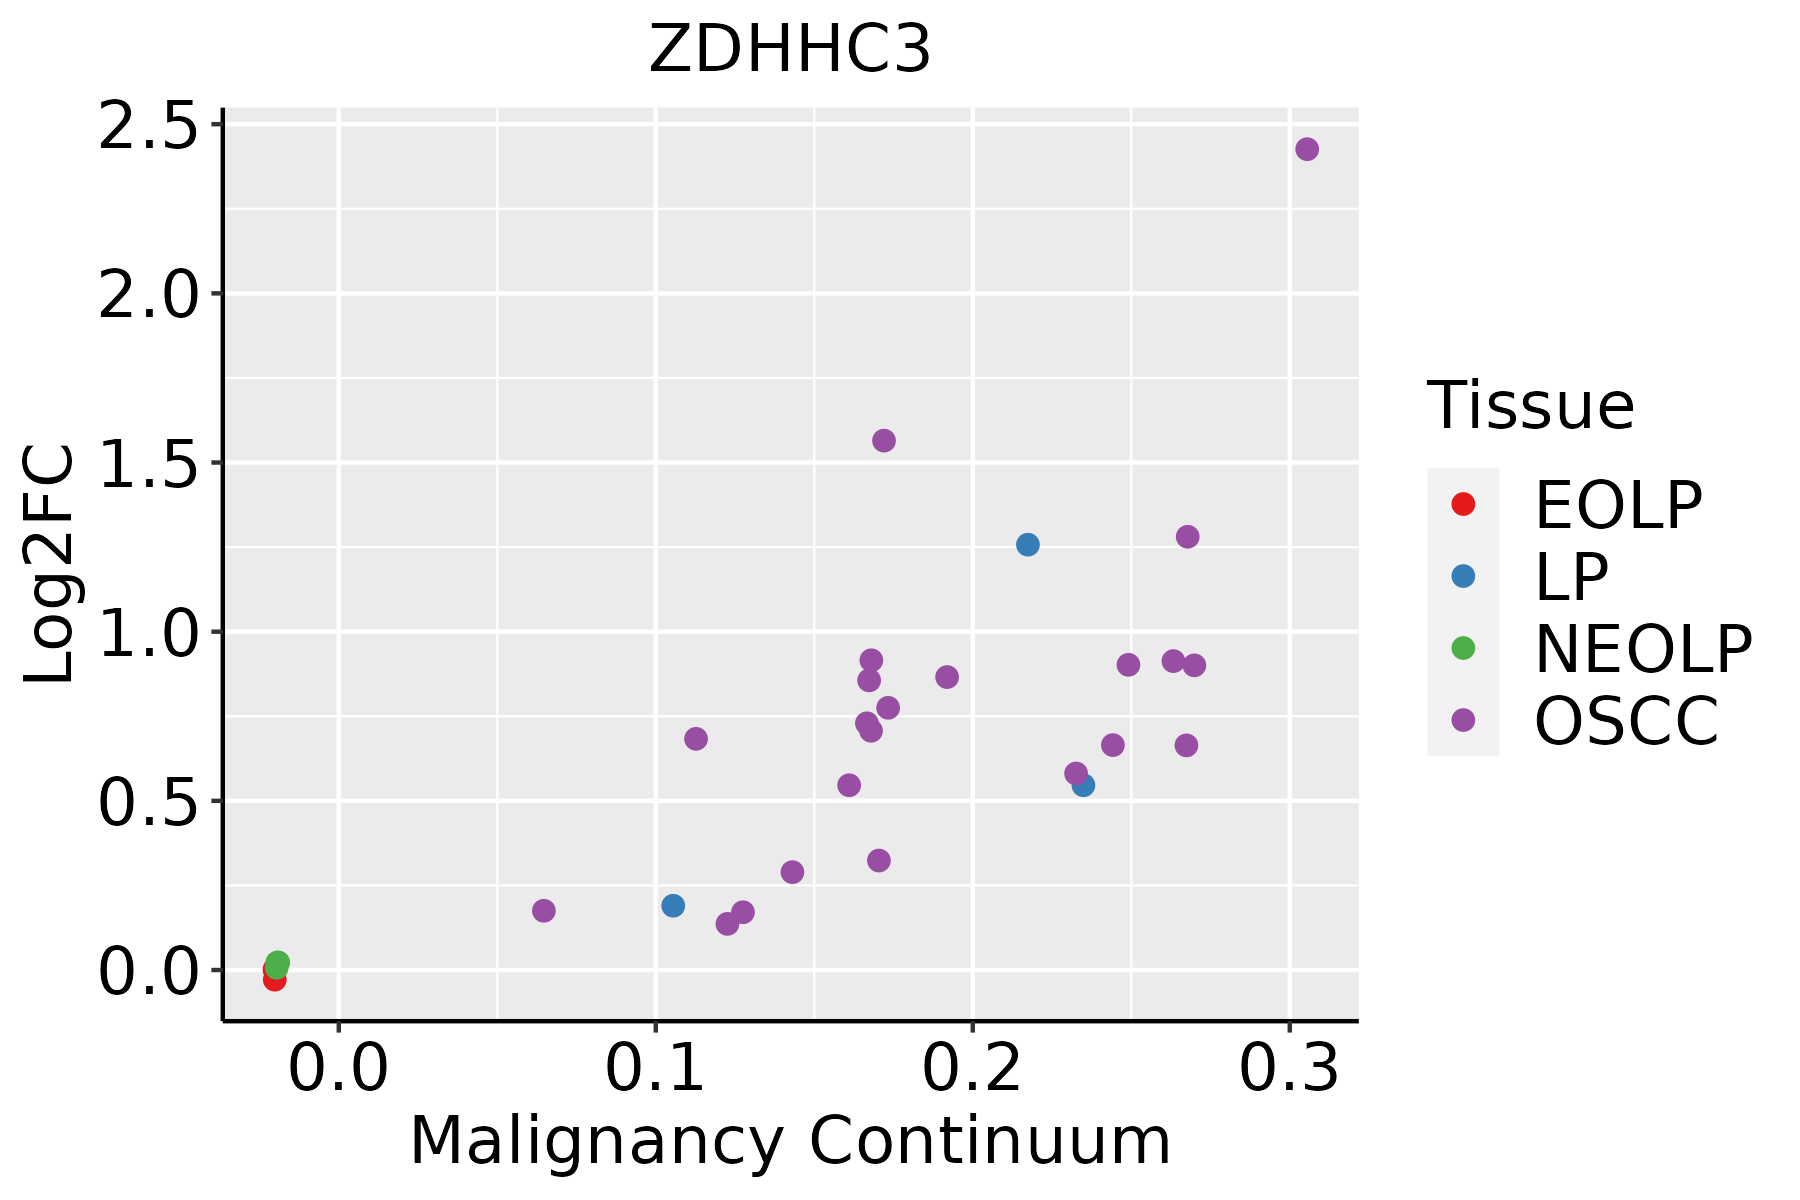 | EOLP: Erosive Oral lichen planus |
| LP: leukoplakia | ||
| NEOLP: Non-erosive oral lichen planus | ||
| OSCC: Oral squamous cell carcinoma | ||
| Skin | 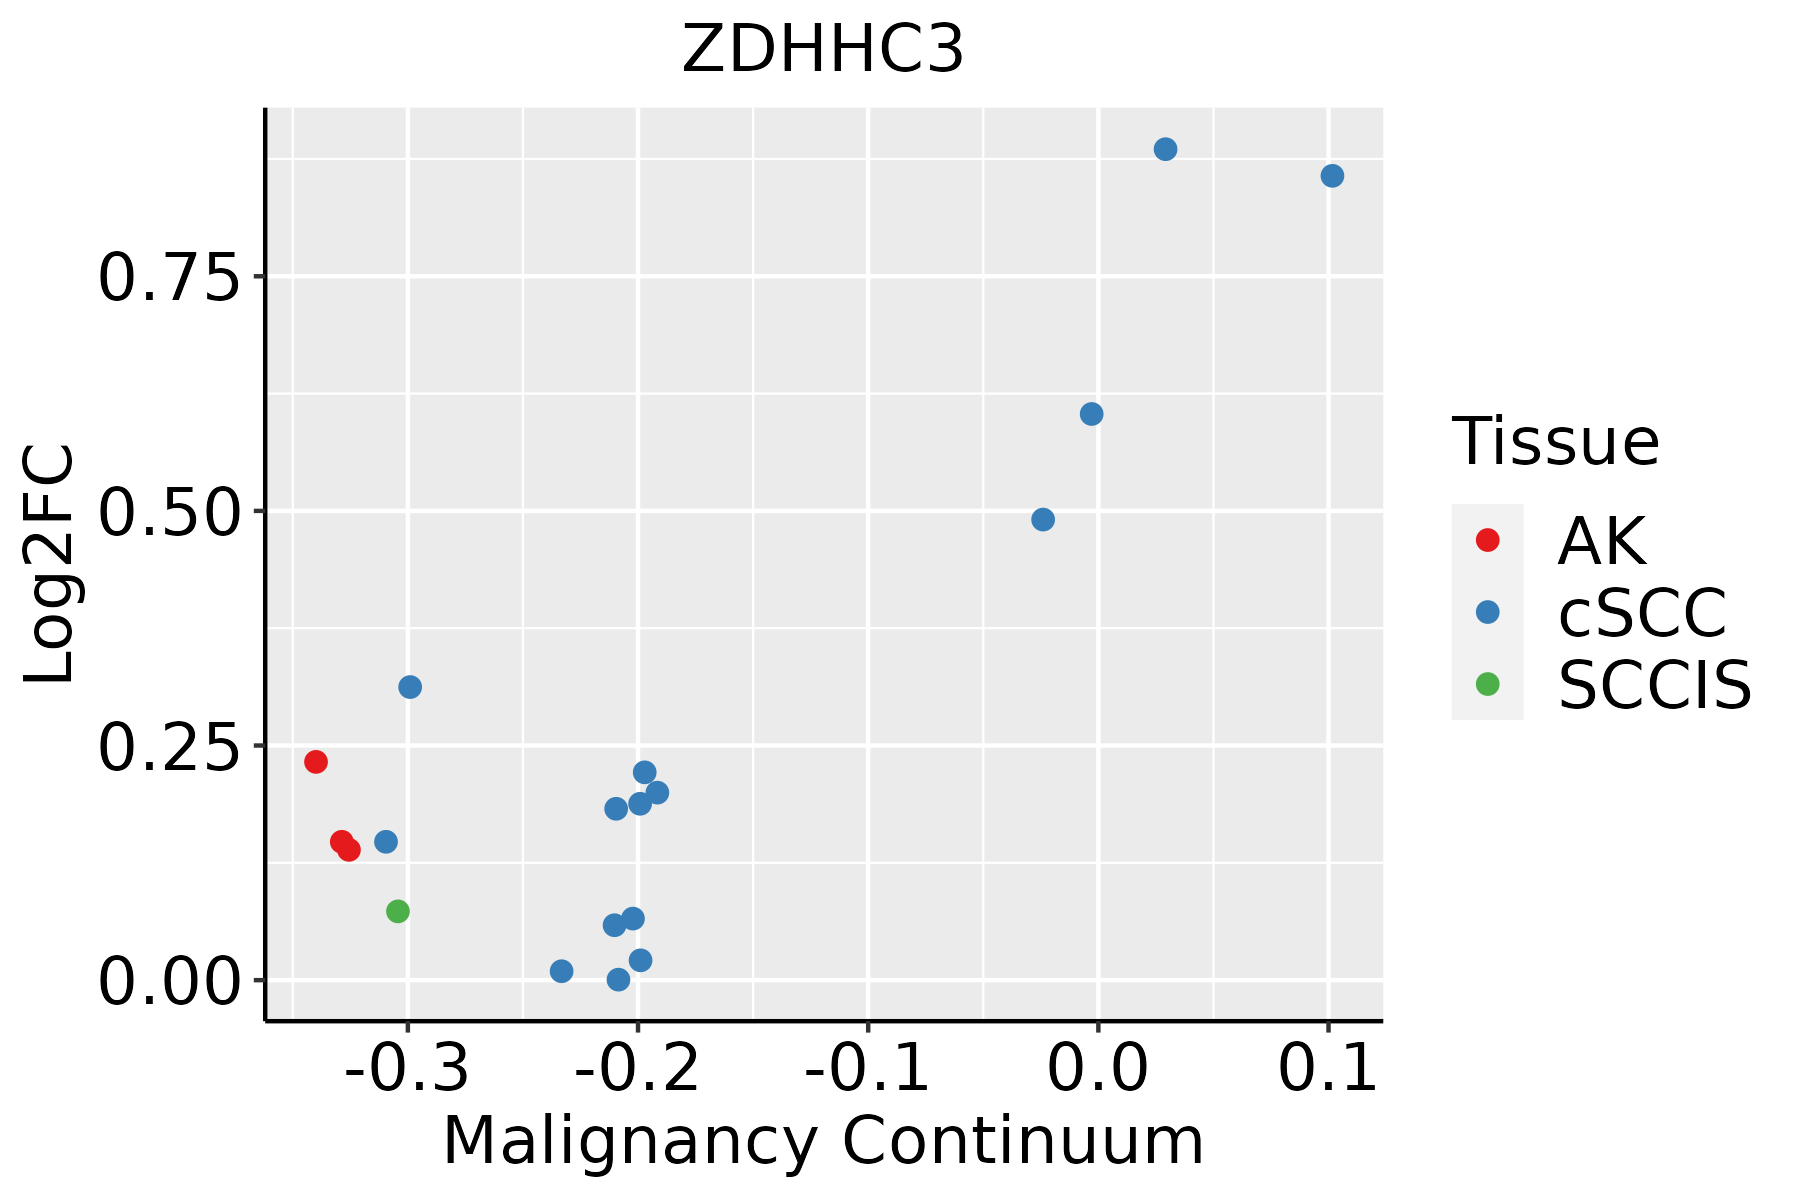 | AK: Actinic keratosis |
| cSCC: Cutaneous squamous cell carcinoma | ||
| SCCIS:squamous cell carcinoma in situ | ||
| Thyroid | 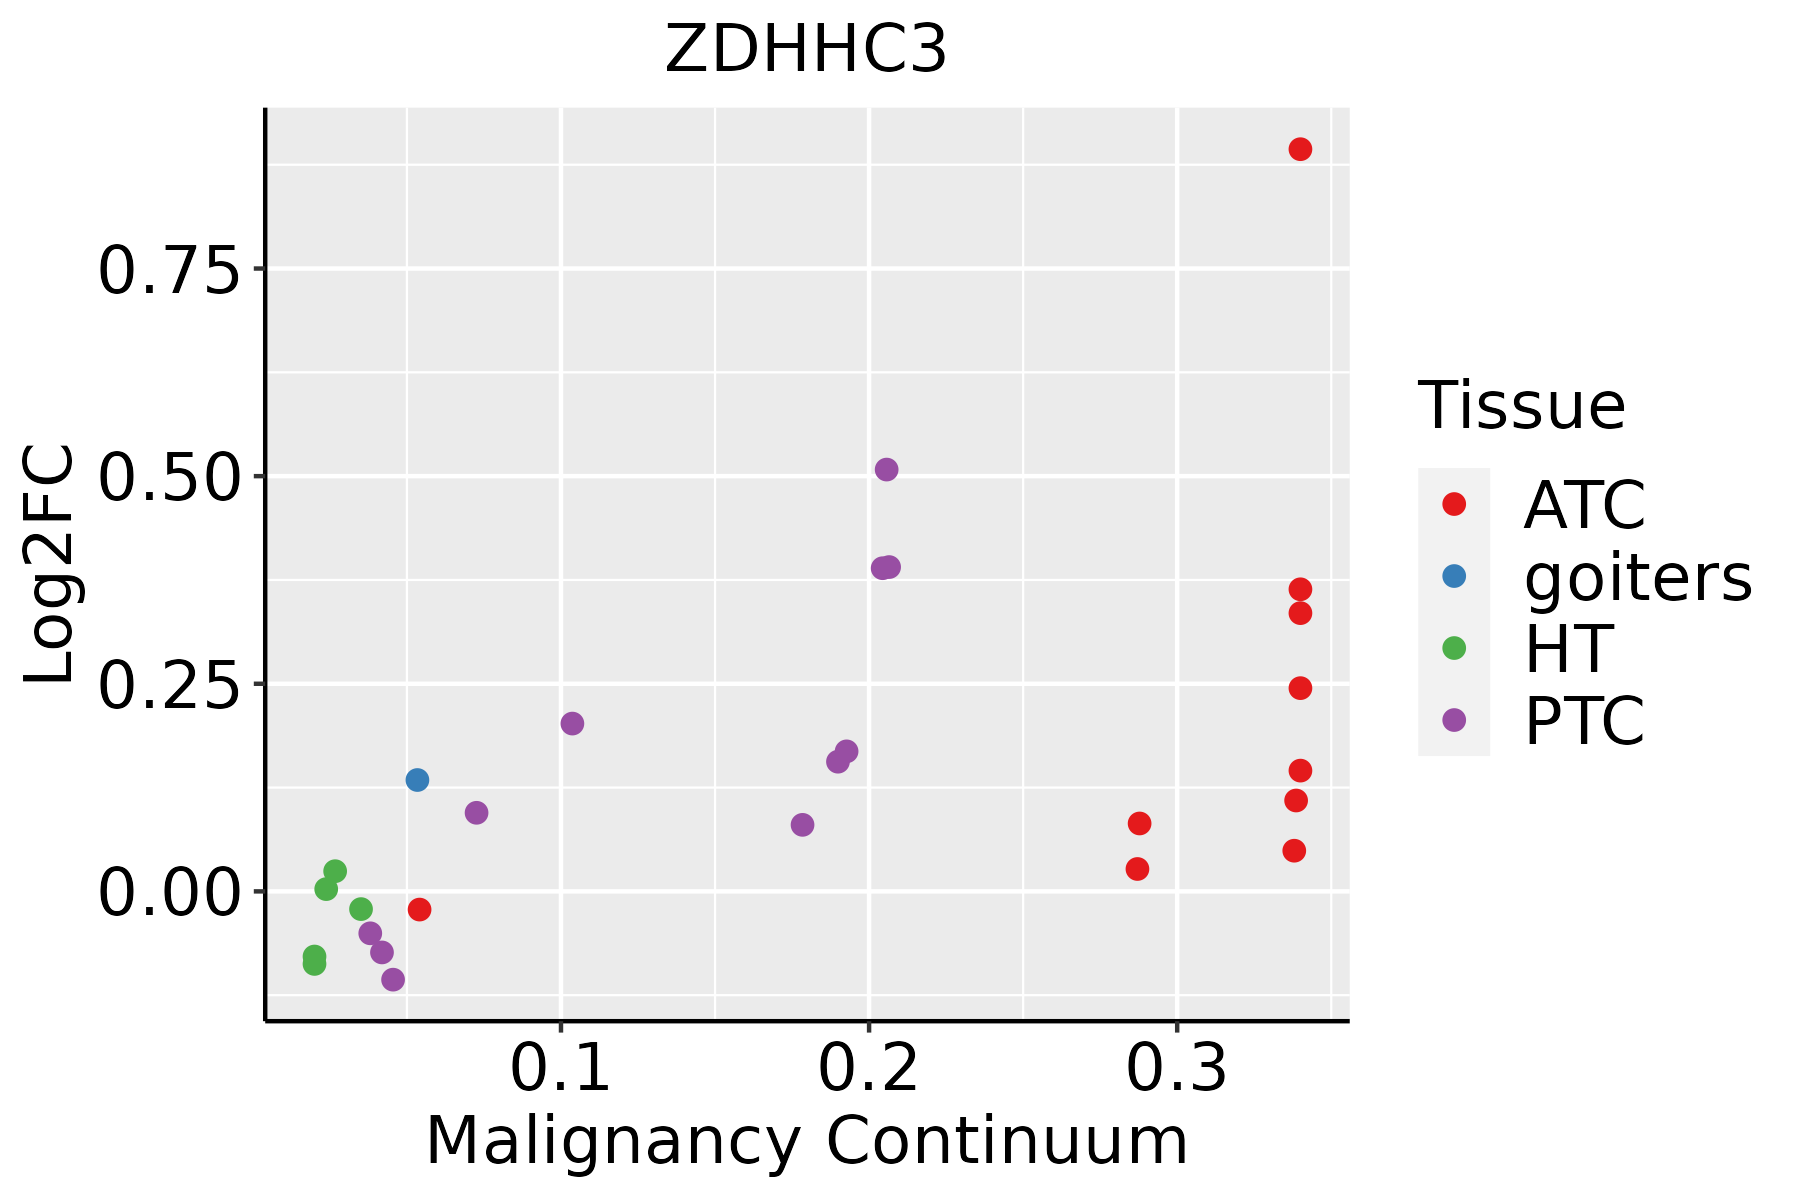 | ATC: Anaplastic thyroid cancer |
| HT: Hashimoto's thyroiditis | ||
| PTC: Papillary thyroid cancer |
| ∗log2FC in expression of this searched gene in stem-like cells from each diseased tissue sample relative to stem-like cells in normal samples in each tissue plotted against the malignancy continuum. Samples are colored based on if they are from different disease stage. |
Top |
Malignant transformation related pathway analysis |
| Find out the enriched GO biological processes and KEGG pathways involved in transition from healthy to precancer to cancer |
| Tissue | Disease Stage | Enriched GO biological Processes |
| Colorectum | AD |  |
| Colorectum | SER |  |
| Colorectum | MSS |  |
| Colorectum | MSI-H |  |
| Colorectum | FAP |  |
| ∗Top 15 enriched GO BP terms are showed in the bar plot of each disease state in each tissue. Each row represents a significant GO biological process which is colored according to the -log10(p.adjust). |
| Page: 1 2 3 4 5 6 7 8 9 |
| GO ID | Tissue | Disease Stage | Description | Gene Ratio | Bg Ratio | pvalue | p.adjust | Count |
| GO:0072659 | Colorectum | AD | protein localization to plasma membrane | 122/3918 | 284/18723 | 2.86e-17 | 1.49e-14 | 122 |
| GO:1990778 | Colorectum | AD | protein localization to cell periphery | 129/3918 | 333/18723 | 5.51e-14 | 1.15e-11 | 129 |
| GO:0090150 | Colorectum | AD | establishment of protein localization to membrane | 100/3918 | 260/18723 | 6.01e-11 | 6.33e-09 | 100 |
| GO:0006605 | Colorectum | AD | protein targeting | 105/3918 | 314/18723 | 1.39e-07 | 6.44e-06 | 105 |
| GO:0097191 | Colorectum | AD | extrinsic apoptotic signaling pathway | 68/3918 | 219/18723 | 2.64e-04 | 3.27e-03 | 68 |
| GO:00726591 | Colorectum | SER | protein localization to plasma membrane | 92/2897 | 284/18723 | 6.36e-13 | 1.86e-10 | 92 |
| GO:19907781 | Colorectum | SER | protein localization to cell periphery | 98/2897 | 333/18723 | 6.09e-11 | 9.57e-09 | 98 |
| GO:00901501 | Colorectum | SER | establishment of protein localization to membrane | 68/2897 | 260/18723 | 5.55e-06 | 2.01e-04 | 68 |
| GO:00971911 | Colorectum | SER | extrinsic apoptotic signaling pathway | 58/2897 | 219/18723 | 1.76e-05 | 5.22e-04 | 58 |
| GO:00066051 | Colorectum | SER | protein targeting | 76/2897 | 314/18723 | 3.19e-05 | 8.47e-04 | 76 |
| GO:00726592 | Colorectum | MSS | protein localization to plasma membrane | 113/3467 | 284/18723 | 3.23e-17 | 1.55e-14 | 113 |
| GO:19907782 | Colorectum | MSS | protein localization to cell periphery | 120/3467 | 333/18723 | 2.02e-14 | 5.47e-12 | 120 |
| GO:00901502 | Colorectum | MSS | establishment of protein localization to membrane | 90/3467 | 260/18723 | 4.11e-10 | 3.49e-08 | 90 |
| GO:00066052 | Colorectum | MSS | protein targeting | 97/3467 | 314/18723 | 6.76e-08 | 3.46e-06 | 97 |
| GO:00971912 | Colorectum | MSS | extrinsic apoptotic signaling pathway | 63/3467 | 219/18723 | 1.34e-04 | 2.03e-03 | 63 |
| GO:00726594 | Colorectum | FAP | protein localization to plasma membrane | 95/2622 | 284/18723 | 4.86e-17 | 9.93e-14 | 95 |
| GO:19907784 | Colorectum | FAP | protein localization to cell periphery | 100/2622 | 333/18723 | 2.19e-14 | 2.68e-11 | 100 |
| GO:00901504 | Colorectum | FAP | establishment of protein localization to membrane | 69/2622 | 260/18723 | 6.40e-08 | 4.54e-06 | 69 |
| GO:00066054 | Colorectum | FAP | protein targeting | 74/2622 | 314/18723 | 3.21e-06 | 1.17e-04 | 74 |
| GO:0006612 | Colorectum | FAP | protein targeting to membrane | 30/2622 | 131/18723 | 3.95e-03 | 2.75e-02 | 30 |
| Page: 1 2 3 4 5 6 |
| Pathway ID | Tissue | Disease Stage | Description | Gene Ratio | Bg Ratio | pvalue | p.adjust | qvalue | Count |
| Page: 1 |
Top |
Cell-cell communication analysis |
| Identification of potential cell-cell interactions between two cell types and their ligand-receptor pairs for different disease states |
| Ligand | Receptor | LRpair | Pathway | Tissue | Disease Stage |
| Page: 1 |
Top |
Single-cell gene regulatory network inference analysis |
| Find out the significant the regulons (TFs) and the target genes of each regulon across cell types for different disease states |
| TF | Cell Type | Tissue | Disease Stage | Target Gene | RSS | Regulon Activity |
| ∗The dot plots of a searched regulon are shown for all cell subpopulations in each disease state of each tissue based on the regulon specific score inferred using pySCENIC and by calculating the average expression. |
| Page: 1 |
Top |
Somatic mutation of malignant transformation related genes |
| Annotation of somatic variants for genes involved in malignant transformation |
| Hugo Symbol | Variant Class | Variant Classification | dbSNP RS | HGVSc | HGVSp | HGVSp Short | SWISSPROT | BIOTYPE | SIFT | PolyPhen | Tumor Sample Barcode | Tissue | Histology | Sex | Age | Stage | Therapy Types | Drugs | Outcome |
| ZDHHC3 | SNV | Missense_Mutation | novel | c.832G>C | p.Glu278Gln | p.E278Q | Q9NYG2 | protein_coding | deleterious(0) | probably_damaging(1) | TCGA-AR-A2LE-01 | Breast | breast invasive carcinoma | Female | >=65 | I/II | Hormone Therapy | tamoxiphen | PD |
| ZDHHC3 | SNV | Missense_Mutation | c.730C>A | p.Leu244Ile | p.L244I | Q9NYG2 | protein_coding | deleterious(0.01) | possibly_damaging(0.457) | TCGA-B6-A0WS-01 | Breast | breast invasive carcinoma | Female | <65 | I/II | Unknown | Unknown | SD | |
| ZDHHC3 | SNV | Missense_Mutation | novel | c.64G>C | p.Glu22Gln | p.E22Q | Q9NYG2 | protein_coding | deleterious_low_confidence(0.02) | possibly_damaging(0.536) | TCGA-C8-A8HQ-01 | Breast | breast invasive carcinoma | Female | <65 | I/II | Unknown | Unknown | SD |
| ZDHHC3 | SNV | Missense_Mutation | c.701G>A | p.Ser234Asn | p.S234N | Q9NYG2 | protein_coding | deleterious(0) | possibly_damaging(0.864) | TCGA-E2-A154-01 | Breast | breast invasive carcinoma | Female | >=65 | I/II | Hormone Therapy | arimidex | SD | |
| ZDHHC3 | insertion | Nonsense_Mutation | novel | c.570_571insCCAGCAGACAATAGAGATAGGAGAGGAGGGTAGGGGTGAGT | p.Gly191ProfsTer11 | p.G191Pfs*11 | Q9NYG2 | protein_coding | TCGA-B6-A0I9-01 | Breast | breast invasive carcinoma | Female | <65 | III/IV | Unknown | Unknown | PD | ||
| ZDHHC3 | SNV | Missense_Mutation | rs747614133 | c.412G>A | p.Asp138Asn | p.D138N | Q9NYG2 | protein_coding | deleterious(0) | benign(0.035) | TCGA-2W-A8YY-01 | Cervix | cervical & endocervical cancer | Female | <65 | I/II | Chemotherapy | cisplatin | CR |
| ZDHHC3 | SNV | Missense_Mutation | c.200T>C | p.Leu67Pro | p.L67P | Q9NYG2 | protein_coding | deleterious(0) | probably_damaging(0.99) | TCGA-A6-5661-01 | Colorectum | colon adenocarcinoma | Female | >=65 | I/II | Unknown | Unknown | SD | |
| ZDHHC3 | SNV | Missense_Mutation | rs368475280 | c.442N>T | p.Arg148Trp | p.R148W | Q9NYG2 | protein_coding | deleterious(0) | probably_damaging(0.999) | TCGA-AA-A01P-01 | Colorectum | colon adenocarcinoma | Female | >=65 | III/IV | Unknown | Unknown | PD |
| ZDHHC3 | deletion | Frame_Shift_Del | c.900delN | p.Phe300LeufsTer7 | p.F300Lfs*7 | Q9NYG2 | protein_coding | TCGA-AA-3811-01 | Colorectum | colon adenocarcinoma | Female | >=65 | III/IV | Unknown | Unknown | PD | |||
| ZDHHC3 | deletion | Frame_Shift_Del | c.310delG | p.Ala104GlnfsTer17 | p.A104Qfs*17 | Q9NYG2 | protein_coding | TCGA-D5-6927-01 | Colorectum | colon adenocarcinoma | Male | <65 | I/II | Unknown | Unknown | SD |
| Page: 1 2 3 4 |
Top |
Related drugs of malignant transformation related genes |
| Identification of chemicals and drugs interact with genes involved in malignant transfromation |
| (DGIdb 4.0) |
| Entrez ID | Symbol | Category | Interaction Types | Drug Claim Name | Drug Name | PMIDs |
| Page: 1 |

Copyright 2023-Present -The University of Texas Health Science Center at Houston |