
|
|||||
|
 | |
| |
| |
| |
| |
| |
|
Gene: ZDHHC24 |
Gene summary for ZDHHC24 |
| Gene information | Species | Human | Gene symbol | ZDHHC24 | Gene ID | 254359 |
| Gene name | zinc finger DHHC-type containing 24 | |
| Gene Alias | ZDHHC24 | |
| Cytomap | 11q13.2 | |
| Gene Type | protein-coding | GO ID | GO:0006464 | UniProtAcc | E9PLR9 |
Top |
Malignant transformation analysis |
| Identification of the aberrant gene expression in precancerous and cancerous lesions by comparing the gene expression of stem-like cells in diseased tissues with normal stem cells |
| Entrez ID | Symbol | Replicates | Species | Organ | Tissue | Adj P-value | Log2FC | Malignancy |
| 254359 | ZDHHC24 | LZE2T | Human | Esophagus | ESCC | 1.02e-02 | 5.07e-01 | 0.082 |
| 254359 | ZDHHC24 | LZE4T | Human | Esophagus | ESCC | 3.21e-11 | 2.63e-01 | 0.0811 |
| 254359 | ZDHHC24 | LZE20T | Human | Esophagus | ESCC | 1.84e-03 | 2.77e-01 | 0.0662 |
| 254359 | ZDHHC24 | LZE24T | Human | Esophagus | ESCC | 5.75e-22 | 6.05e-01 | 0.0596 |
| 254359 | ZDHHC24 | LZE21T | Human | Esophagus | ESCC | 6.61e-03 | 1.52e-01 | 0.0655 |
| 254359 | ZDHHC24 | P1T-E | Human | Esophagus | ESCC | 3.68e-08 | 4.09e-01 | 0.0875 |
| 254359 | ZDHHC24 | P2T-E | Human | Esophagus | ESCC | 3.14e-15 | 3.37e-01 | 0.1177 |
| 254359 | ZDHHC24 | P4T-E | Human | Esophagus | ESCC | 2.27e-21 | 5.31e-01 | 0.1323 |
| 254359 | ZDHHC24 | P5T-E | Human | Esophagus | ESCC | 4.08e-35 | 5.86e-01 | 0.1327 |
| 254359 | ZDHHC24 | P8T-E | Human | Esophagus | ESCC | 1.10e-27 | 4.93e-01 | 0.0889 |
| 254359 | ZDHHC24 | P9T-E | Human | Esophagus | ESCC | 1.20e-18 | 5.13e-01 | 0.1131 |
| 254359 | ZDHHC24 | P10T-E | Human | Esophagus | ESCC | 6.07e-16 | 3.29e-01 | 0.116 |
| 254359 | ZDHHC24 | P11T-E | Human | Esophagus | ESCC | 1.98e-19 | 7.43e-01 | 0.1426 |
| 254359 | ZDHHC24 | P12T-E | Human | Esophagus | ESCC | 8.07e-20 | 3.24e-01 | 0.1122 |
| 254359 | ZDHHC24 | P15T-E | Human | Esophagus | ESCC | 2.21e-18 | 3.94e-01 | 0.1149 |
| 254359 | ZDHHC24 | P16T-E | Human | Esophagus | ESCC | 2.54e-16 | 2.92e-01 | 0.1153 |
| 254359 | ZDHHC24 | P17T-E | Human | Esophagus | ESCC | 5.25e-15 | 5.91e-01 | 0.1278 |
| 254359 | ZDHHC24 | P19T-E | Human | Esophagus | ESCC | 6.44e-16 | 5.43e-01 | 0.1662 |
| 254359 | ZDHHC24 | P20T-E | Human | Esophagus | ESCC | 5.08e-14 | 3.62e-01 | 0.1124 |
| 254359 | ZDHHC24 | P21T-E | Human | Esophagus | ESCC | 1.34e-57 | 1.06e+00 | 0.1617 |
| Page: 1 2 3 4 5 |
| Tissue | Expression Dynamics | Abbreviation |
| Esophagus | 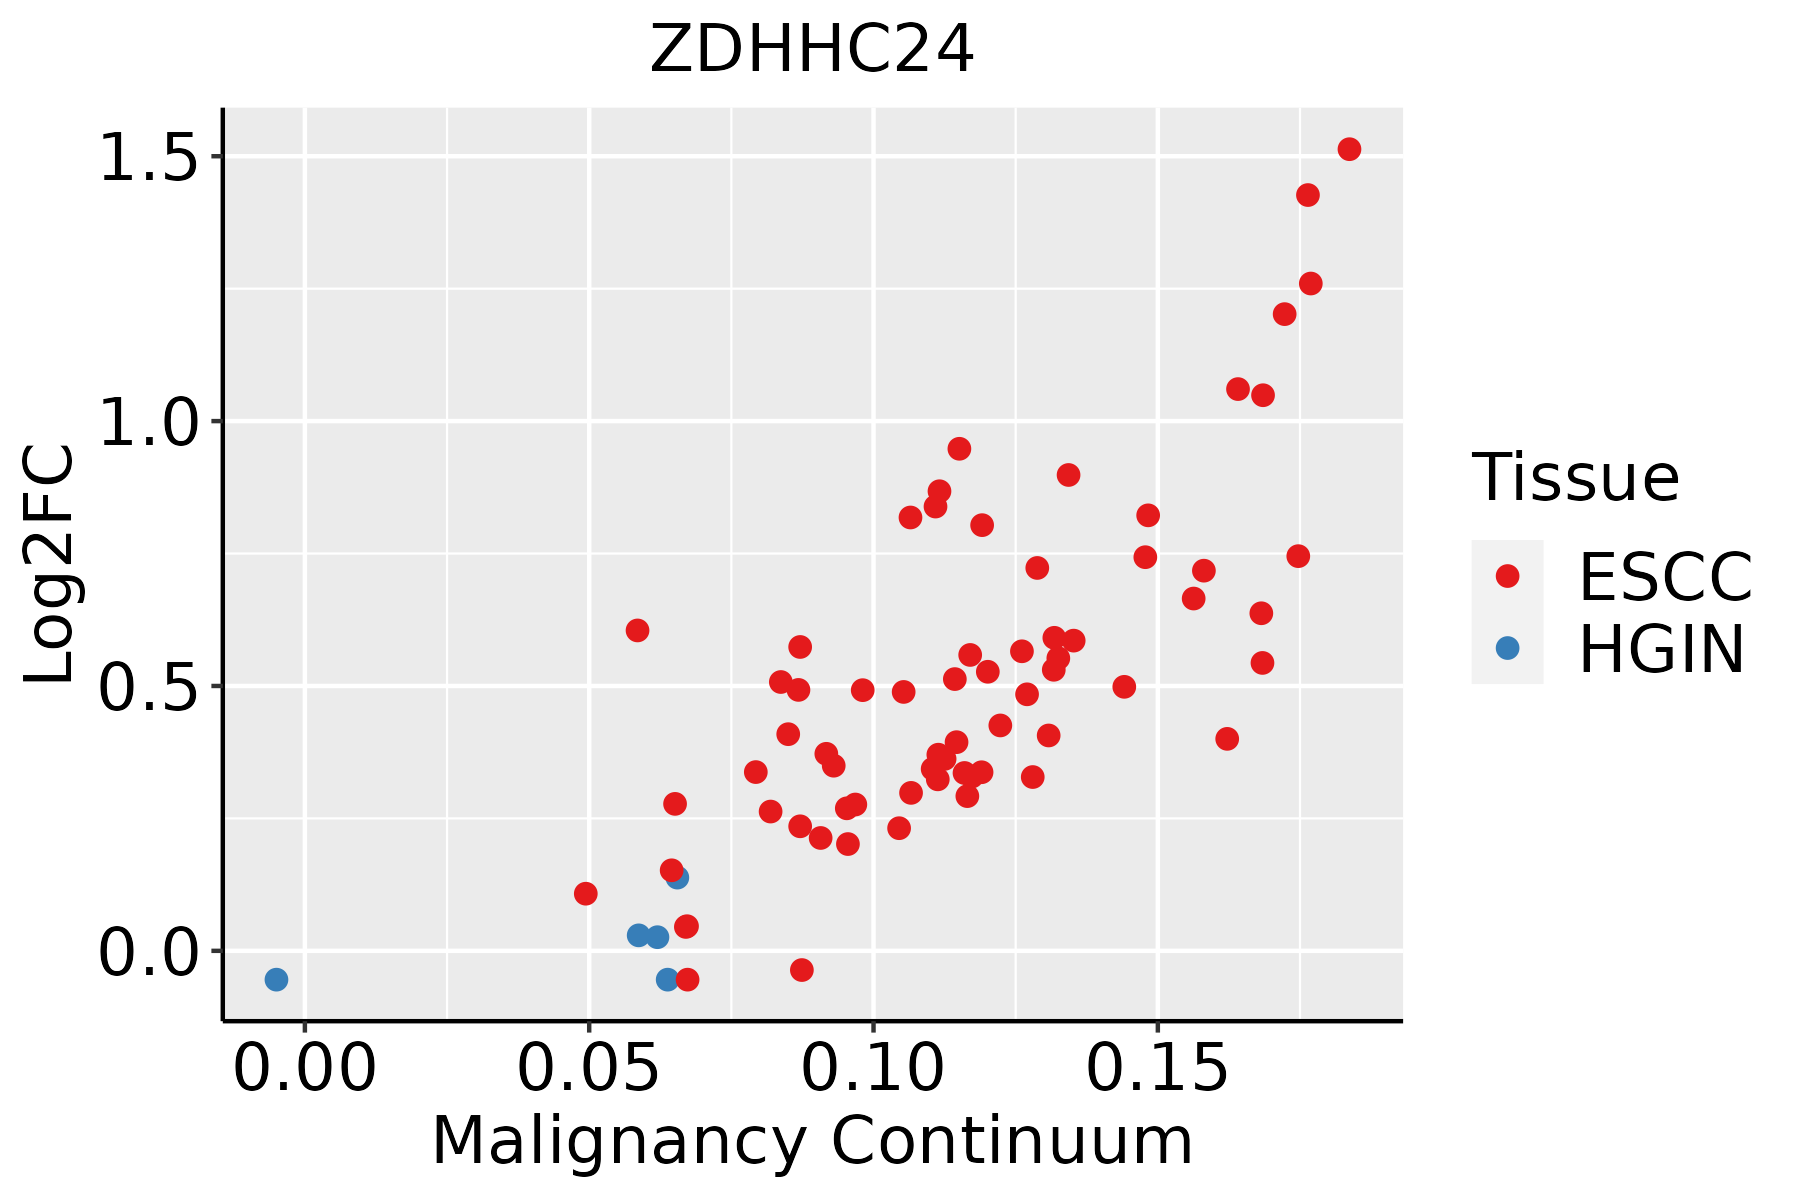 | ESCC: Esophageal squamous cell carcinoma |
| HGIN: High-grade intraepithelial neoplasias | ||
| LGIN: Low-grade intraepithelial neoplasias | ||
| Liver | 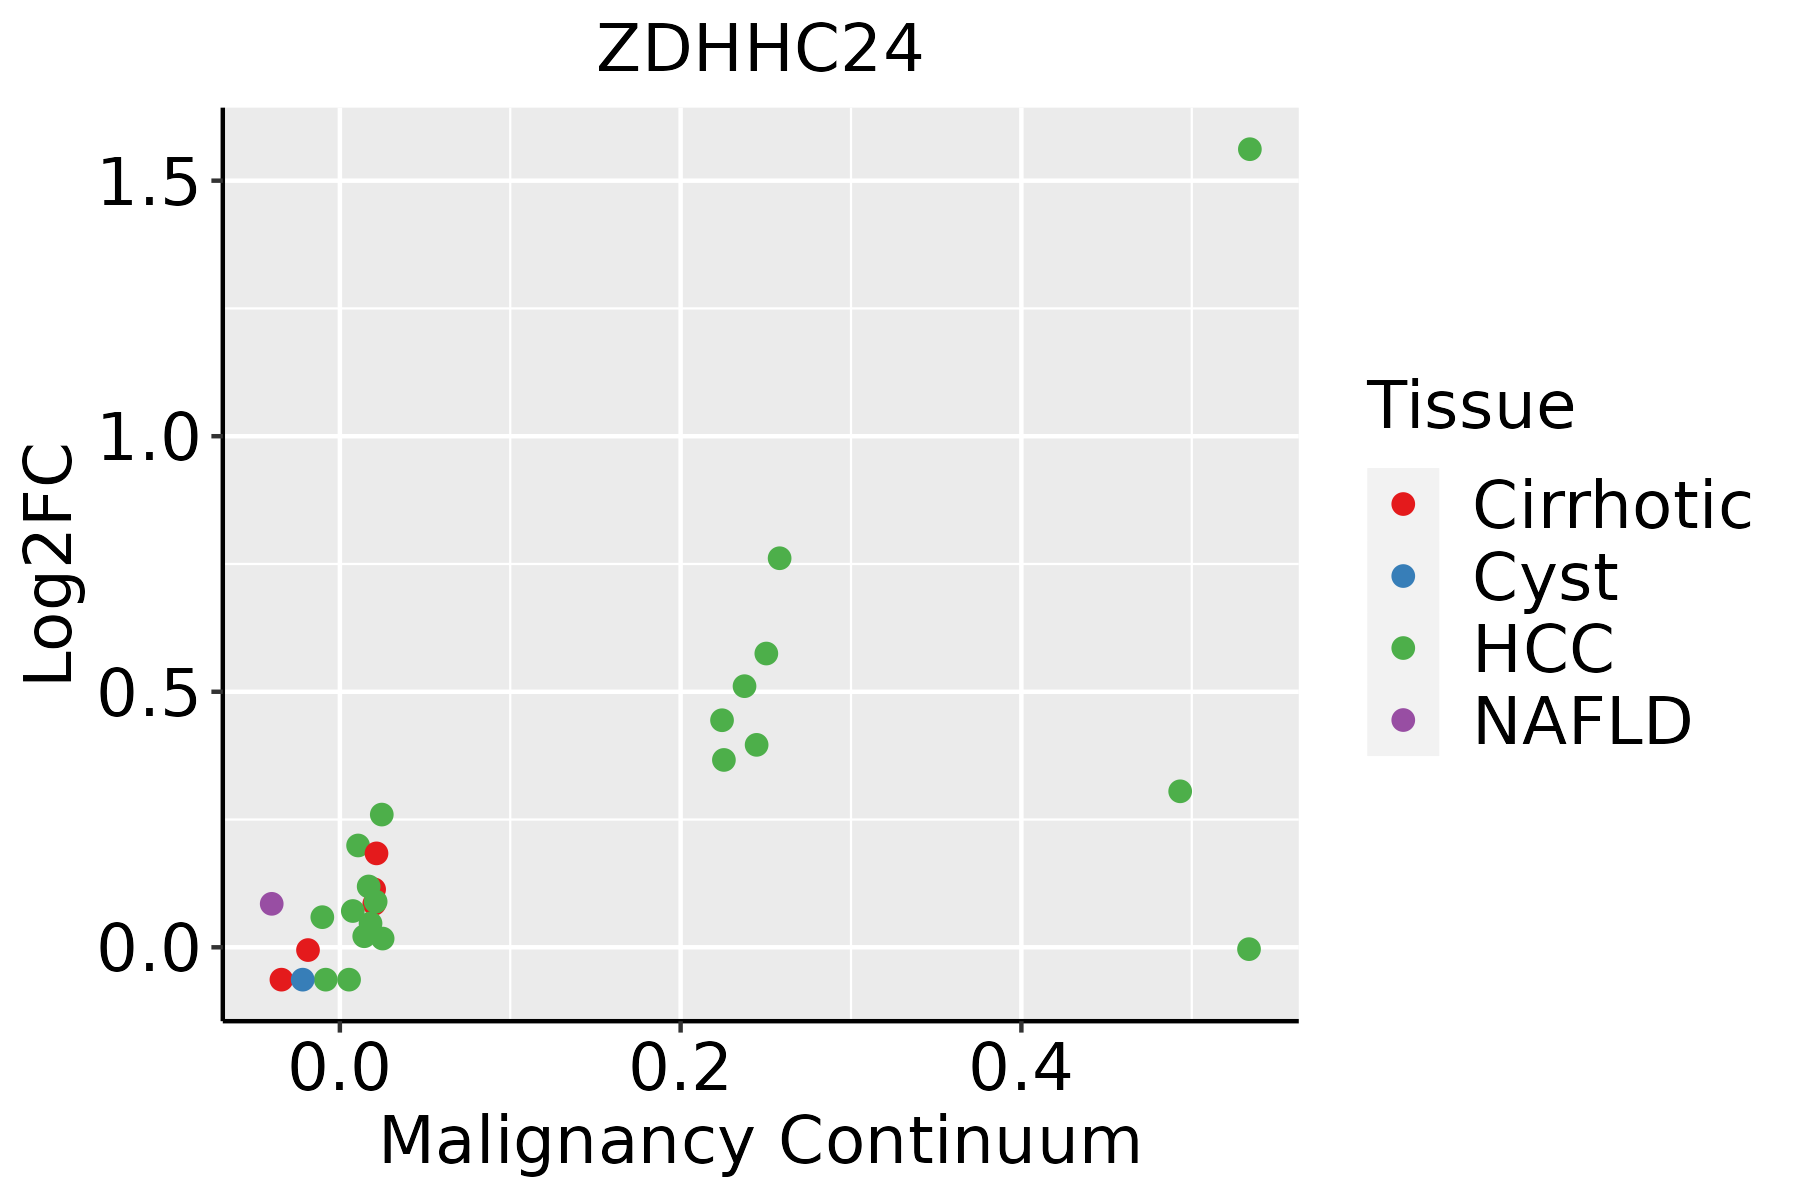 | HCC: Hepatocellular carcinoma |
| NAFLD: Non-alcoholic fatty liver disease | ||
| Oral Cavity |  | EOLP: Erosive Oral lichen planus |
| LP: leukoplakia | ||
| NEOLP: Non-erosive oral lichen planus | ||
| OSCC: Oral squamous cell carcinoma | ||
| Thyroid |  | ATC: Anaplastic thyroid cancer |
| HT: Hashimoto's thyroiditis | ||
| PTC: Papillary thyroid cancer |
| ∗log2FC in expression of this searched gene in stem-like cells from each diseased tissue sample relative to stem-like cells in normal samples in each tissue plotted against the malignancy continuum. Samples are colored based on if they are from different disease stage. |
Top |
Malignant transformation related pathway analysis |
| Find out the enriched GO biological processes and KEGG pathways involved in transition from healthy to precancer to cancer |
| Tissue | Disease Stage | Enriched GO biological Processes |
| Colorectum | AD |  |
| Colorectum | SER |  |
| Colorectum | MSS |  |
| Colorectum | MSI-H |  |
| Colorectum | FAP |  |
| ∗Top 15 enriched GO BP terms are showed in the bar plot of each disease state in each tissue. Each row represents a significant GO biological process which is colored according to the -log10(p.adjust). |
| Page: 1 2 3 4 5 6 7 8 9 |
| GO ID | Tissue | Disease Stage | Description | Gene Ratio | Bg Ratio | pvalue | p.adjust | Count |
| GO:0006605111 | Esophagus | ESCC | protein targeting | 229/8552 | 314/18723 | 4.93e-23 | 1.01e-20 | 229 |
| GO:0090150110 | Esophagus | ESCC | establishment of protein localization to membrane | 182/8552 | 260/18723 | 1.27e-15 | 8.19e-14 | 182 |
| GO:004354313 | Esophagus | ESCC | protein acylation | 165/8552 | 243/18723 | 1.69e-12 | 7.14e-11 | 165 |
| GO:00421573 | Esophagus | ESCC | lipoprotein metabolic process | 86/8552 | 135/18723 | 1.78e-05 | 1.57e-04 | 86 |
| GO:00064973 | Esophagus | ESCC | protein lipidation | 62/8552 | 92/18723 | 2.08e-05 | 1.80e-04 | 62 |
| GO:00421583 | Esophagus | ESCC | lipoprotein biosynthetic process | 64/8552 | 96/18723 | 2.61e-05 | 2.20e-04 | 64 |
| GO:00066124 | Esophagus | ESCC | protein targeting to membrane | 83/8552 | 131/18723 | 3.31e-05 | 2.73e-04 | 83 |
| GO:00066057 | Liver | Cirrhotic | protein targeting | 148/4634 | 314/18723 | 3.86e-18 | 6.20e-16 | 148 |
| GO:00901507 | Liver | Cirrhotic | establishment of protein localization to membrane | 123/4634 | 260/18723 | 1.85e-15 | 2.15e-13 | 123 |
| GO:00435431 | Liver | Cirrhotic | protein acylation | 95/4634 | 243/18723 | 4.73e-07 | 1.07e-05 | 95 |
| GO:00066122 | Liver | Cirrhotic | protein targeting to membrane | 53/4634 | 131/18723 | 5.17e-05 | 5.95e-04 | 53 |
| GO:0042157 | Liver | Cirrhotic | lipoprotein metabolic process | 53/4634 | 135/18723 | 1.32e-04 | 1.29e-03 | 53 |
| GO:0042158 | Liver | Cirrhotic | lipoprotein biosynthetic process | 36/4634 | 96/18723 | 3.69e-03 | 2.03e-02 | 36 |
| GO:0006497 | Liver | Cirrhotic | protein lipidation | 33/4634 | 92/18723 | 1.12e-02 | 4.92e-02 | 33 |
| GO:000660512 | Liver | HCC | protein targeting | 219/7958 | 314/18723 | 7.74e-23 | 1.49e-20 | 219 |
| GO:009015012 | Liver | HCC | establishment of protein localization to membrane | 168/7958 | 260/18723 | 4.07e-13 | 2.13e-11 | 168 |
| GO:00435432 | Liver | HCC | protein acylation | 157/7958 | 243/18723 | 2.40e-12 | 1.12e-10 | 157 |
| GO:00421571 | Liver | HCC | lipoprotein metabolic process | 86/7958 | 135/18723 | 5.21e-07 | 8.38e-06 | 86 |
| GO:00421581 | Liver | HCC | lipoprotein biosynthetic process | 58/7958 | 96/18723 | 2.99e-04 | 2.13e-03 | 58 |
| GO:00066121 | Liver | HCC | protein targeting to membrane | 75/7958 | 131/18723 | 4.58e-04 | 3.04e-03 | 75 |
| Page: 1 2 3 |
| Pathway ID | Tissue | Disease Stage | Description | Gene Ratio | Bg Ratio | pvalue | p.adjust | qvalue | Count |
| Page: 1 |
Top |
Cell-cell communication analysis |
| Identification of potential cell-cell interactions between two cell types and their ligand-receptor pairs for different disease states |
| Ligand | Receptor | LRpair | Pathway | Tissue | Disease Stage |
| Page: 1 |
Top |
Single-cell gene regulatory network inference analysis |
| Find out the significant the regulons (TFs) and the target genes of each regulon across cell types for different disease states |
| TF | Cell Type | Tissue | Disease Stage | Target Gene | RSS | Regulon Activity |
| ∗The dot plots of a searched regulon are shown for all cell subpopulations in each disease state of each tissue based on the regulon specific score inferred using pySCENIC and by calculating the average expression. |
| Page: 1 |
Top |
Somatic mutation of malignant transformation related genes |
| Annotation of somatic variants for genes involved in malignant transformation |
| Hugo Symbol | Variant Class | Variant Classification | dbSNP RS | HGVSc | HGVSp | HGVSp Short | SWISSPROT | BIOTYPE | SIFT | PolyPhen | Tumor Sample Barcode | Tissue | Histology | Sex | Age | Stage | Therapy Types | Drugs | Outcome |
| ZDHHC24 | SNV | Missense_Mutation | novel | c.325C>T | p.His109Tyr | p.H109Y | Q6UX98 | protein_coding | deleterious(0) | probably_damaging(0.995) | TCGA-ZJ-AB0I-01 | Cervix | cervical & endocervical cancer | Female | <65 | I/II | Unknown | Unknown | SD |
| ZDHHC24 | SNV | Missense_Mutation | novel | c.215N>C | p.Phe72Ser | p.F72S | Q6UX98 | protein_coding | tolerated(0.09) | probably_damaging(0.987) | TCGA-5M-AAT6-01 | Colorectum | colon adenocarcinoma | Female | <65 | III/IV | Unknown | Unknown | PD |
| ZDHHC24 | SNV | Missense_Mutation | rs372147730 | c.766G>A | p.Val256Ile | p.V256I | Q6UX98 | protein_coding | tolerated(0.33) | benign(0) | TCGA-AA-3710-01 | Colorectum | colon adenocarcinoma | Female | >=65 | I/II | Unknown | Unknown | SD |
| ZDHHC24 | SNV | Missense_Mutation | novel | c.316N>T | p.Arg106Cys | p.R106C | Q6UX98 | protein_coding | deleterious(0) | probably_damaging(0.998) | TCGA-AA-3984-01 | Colorectum | colon adenocarcinoma | Female | <65 | I/II | Unknown | Unknown | SD |
| ZDHHC24 | SNV | Missense_Mutation | rs752192038 | c.506C>T | p.Thr169Met | p.T169M | Q6UX98 | protein_coding | tolerated(0.24) | benign(0.139) | TCGA-F4-6461-01 | Colorectum | colon adenocarcinoma | Female | <65 | III/IV | Unknown | Unknown | PD |
| ZDHHC24 | SNV | Missense_Mutation | rs149584176 | c.355N>T | p.Arg119Cys | p.R119C | Q6UX98 | protein_coding | deleterious(0) | probably_damaging(0.998) | TCGA-AP-A1DK-01 | Endometrium | uterine corpus endometrioid carcinoma | Female | <65 | I/II | Unknown | Unknown | SD |
| ZDHHC24 | SNV | Missense_Mutation | novel | c.822N>T | p.Gln274His | p.Q274H | Q6UX98 | protein_coding | tolerated(0.08) | possibly_damaging(0.459) | TCGA-AP-A1DV-01 | Endometrium | uterine corpus endometrioid carcinoma | Female | <65 | I/II | Unknown | Unknown | SD |
| ZDHHC24 | SNV | Missense_Mutation | rs748243763 | c.356N>A | p.Arg119His | p.R119H | Q6UX98 | protein_coding | deleterious(0) | probably_damaging(0.998) | TCGA-AP-A1DV-01 | Endometrium | uterine corpus endometrioid carcinoma | Female | <65 | I/II | Unknown | Unknown | SD |
| ZDHHC24 | SNV | Missense_Mutation | novel | c.417C>A | p.Phe139Leu | p.F139L | Q6UX98 | protein_coding | deleterious(0.01) | probably_damaging(0.989) | TCGA-AX-A2H4-01 | Endometrium | uterine corpus endometrioid carcinoma | Female | >=65 | III/IV | Unknown | Unknown | PD |
| ZDHHC24 | SNV | Missense_Mutation | rs536081289 | c.410N>A | p.Arg137Gln | p.R137Q | Q6UX98 | protein_coding | deleterious(0.01) | probably_damaging(0.997) | TCGA-D1-A17A-01 | Endometrium | uterine corpus endometrioid carcinoma | Female | <65 | I/II | Unknown | Unknown | SD |
| Page: 1 2 |
Top |
Related drugs of malignant transformation related genes |
| Identification of chemicals and drugs interact with genes involved in malignant transfromation |
| (DGIdb 4.0) |
| Entrez ID | Symbol | Category | Interaction Types | Drug Claim Name | Drug Name | PMIDs |
| Page: 1 |

Copyright 2023-Present -The University of Texas Health Science Center at Houston |