
|
|||||
|
 | |
| |
| |
| |
| |
| |
|
Gene: ZDHHC21 |
Gene summary for ZDHHC21 |
| Gene information | Species | Human | Gene symbol | ZDHHC21 | Gene ID | 340481 |
| Gene name | zinc finger DHHC-type palmitoyltransferase 21 | |
| Gene Alias | DHHC-21 | |
| Cytomap | 9p22.3 | |
| Gene Type | protein-coding | GO ID | GO:0001885 | UniProtAcc | Q8IVQ6 |
Top |
Malignant transformation analysis |
| Identification of the aberrant gene expression in precancerous and cancerous lesions by comparing the gene expression of stem-like cells in diseased tissues with normal stem cells |
| Entrez ID | Symbol | Replicates | Species | Organ | Tissue | Adj P-value | Log2FC | Malignancy |
| 340481 | ZDHHC21 | HTA11_3410_2000001011 | Human | Colorectum | AD | 1.88e-14 | -5.33e-01 | 0.0155 |
| 340481 | ZDHHC21 | HTA11_347_2000001011 | Human | Colorectum | AD | 5.22e-04 | -3.09e-01 | -0.1954 |
| 340481 | ZDHHC21 | HTA11_696_2000001011 | Human | Colorectum | AD | 5.57e-13 | -4.77e-01 | -0.1464 |
| 340481 | ZDHHC21 | HTA11_866_2000001011 | Human | Colorectum | AD | 5.95e-14 | -4.69e-01 | -0.1001 |
| 340481 | ZDHHC21 | HTA11_1391_2000001011 | Human | Colorectum | AD | 8.62e-07 | -4.41e-01 | -0.059 |
| 340481 | ZDHHC21 | HTA11_866_3004761011 | Human | Colorectum | AD | 1.33e-11 | -5.16e-01 | 0.096 |
| 340481 | ZDHHC21 | HTA11_10711_2000001011 | Human | Colorectum | AD | 1.16e-05 | -4.89e-01 | 0.0338 |
| 340481 | ZDHHC21 | HTA11_7696_3000711011 | Human | Colorectum | AD | 4.21e-13 | -4.67e-01 | 0.0674 |
| 340481 | ZDHHC21 | HTA11_99999971662_82457 | Human | Colorectum | MSS | 2.16e-08 | -3.83e-01 | 0.3859 |
| 340481 | ZDHHC21 | HTA11_99999973899_84307 | Human | Colorectum | MSS | 3.55e-02 | -4.79e-01 | 0.2585 |
| 340481 | ZDHHC21 | HTA11_99999974143_84620 | Human | Colorectum | MSS | 1.24e-12 | -4.58e-01 | 0.3005 |
| 340481 | ZDHHC21 | A015-C-203 | Human | Colorectum | FAP | 2.52e-27 | -3.95e-01 | -0.1294 |
| 340481 | ZDHHC21 | A015-C-204 | Human | Colorectum | FAP | 1.26e-04 | -2.87e-01 | -0.0228 |
| 340481 | ZDHHC21 | A002-C-201 | Human | Colorectum | FAP | 1.14e-08 | -2.53e-01 | 0.0324 |
| 340481 | ZDHHC21 | A002-C-203 | Human | Colorectum | FAP | 1.00e-03 | -9.95e-02 | 0.2786 |
| 340481 | ZDHHC21 | A001-C-119 | Human | Colorectum | FAP | 3.17e-06 | -4.40e-01 | -0.1557 |
| 340481 | ZDHHC21 | A001-C-108 | Human | Colorectum | FAP | 7.95e-13 | -2.32e-01 | -0.0272 |
| 340481 | ZDHHC21 | A002-C-205 | Human | Colorectum | FAP | 2.76e-20 | -4.91e-01 | -0.1236 |
| 340481 | ZDHHC21 | A001-C-104 | Human | Colorectum | FAP | 3.43e-02 | -2.63e-02 | 0.0184 |
| 340481 | ZDHHC21 | A015-C-006 | Human | Colorectum | FAP | 2.01e-09 | -3.15e-01 | -0.0994 |
| Page: 1 2 3 4 5 6 |
| Tissue | Expression Dynamics | Abbreviation |
| Colorectum (GSE201348) |  | FAP: Familial adenomatous polyposis |
| CRC: Colorectal cancer | ||
| Colorectum (HTA11) |  | AD: Adenomas |
| SER: Sessile serrated lesions | ||
| MSI-H: Microsatellite-high colorectal cancer | ||
| MSS: Microsatellite stable colorectal cancer | ||
| Lung | 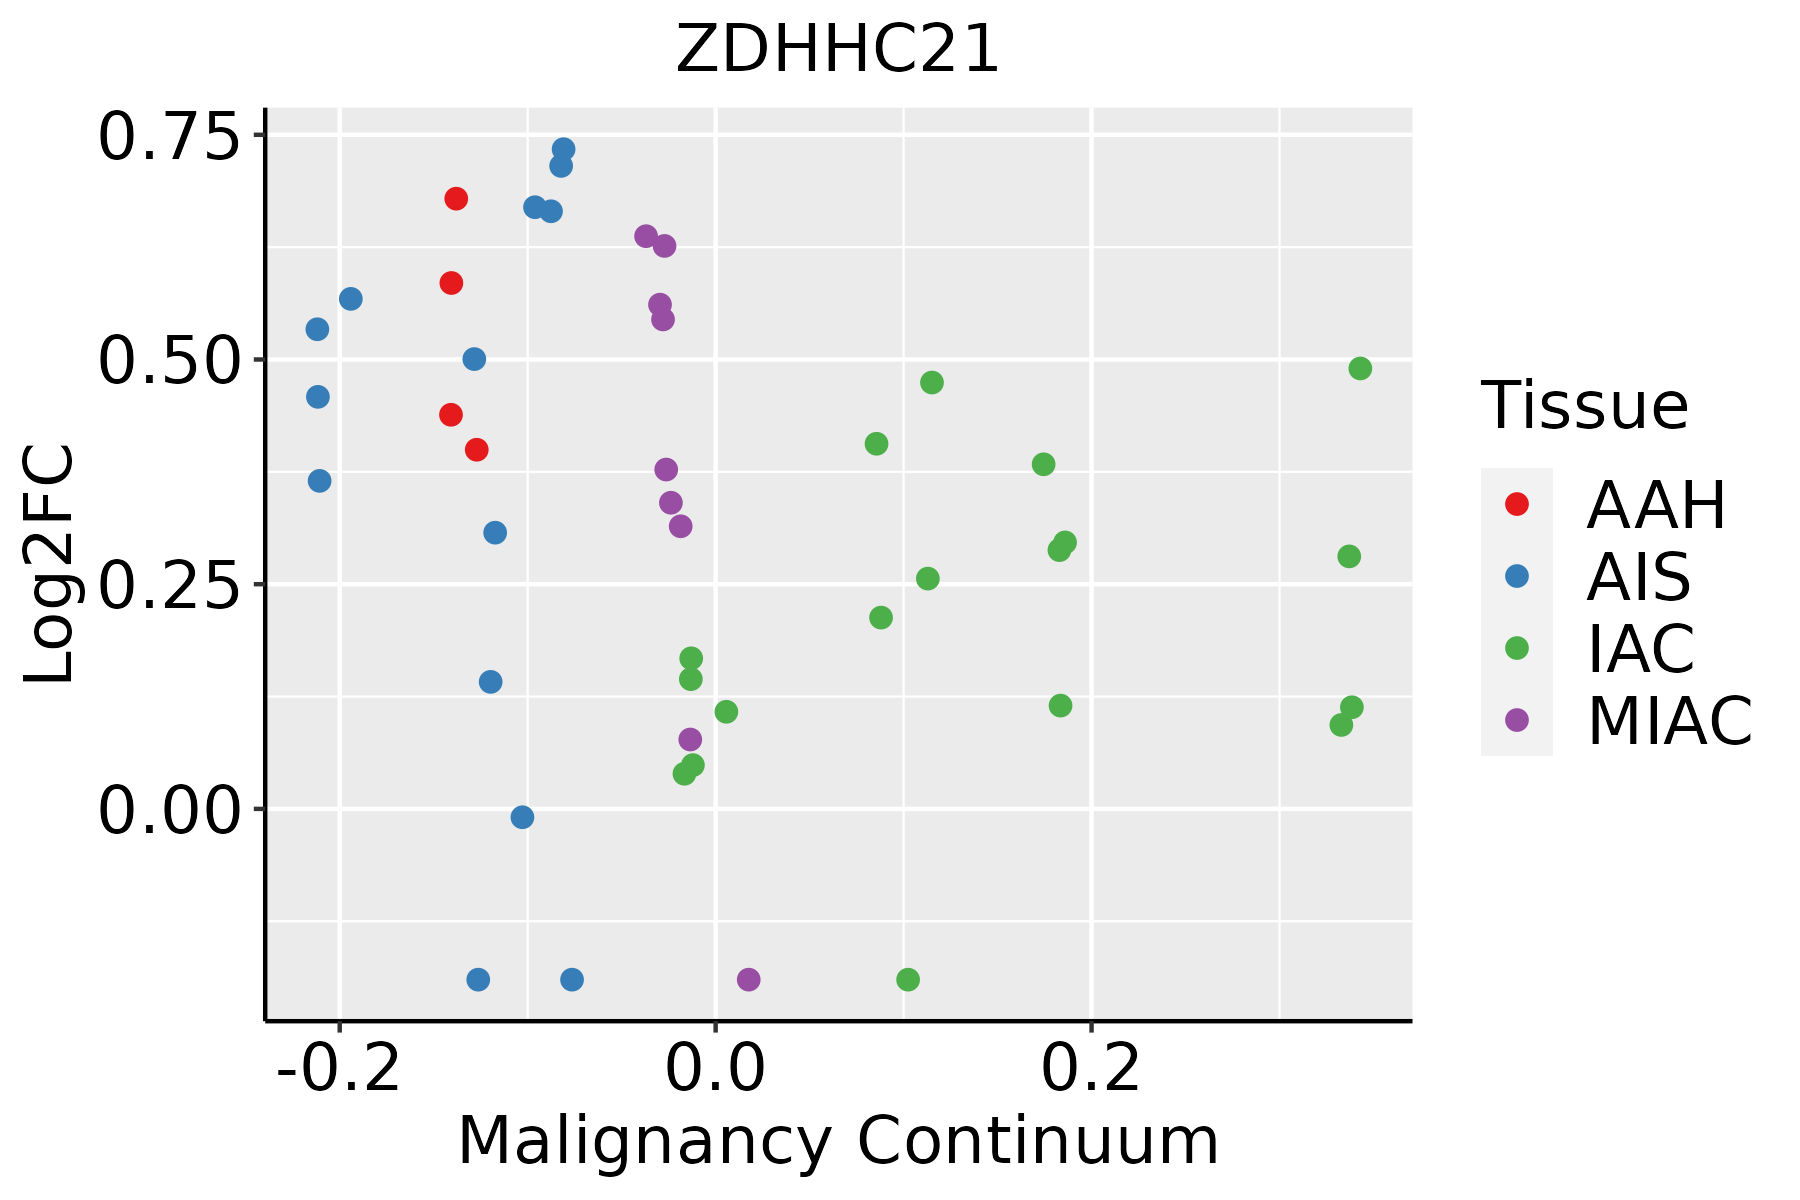 | AAH: Atypical adenomatous hyperplasia |
| AIS: Adenocarcinoma in situ | ||
| IAC: Invasive lung adenocarcinoma | ||
| MIA: Minimally invasive adenocarcinoma | ||
| Thyroid | 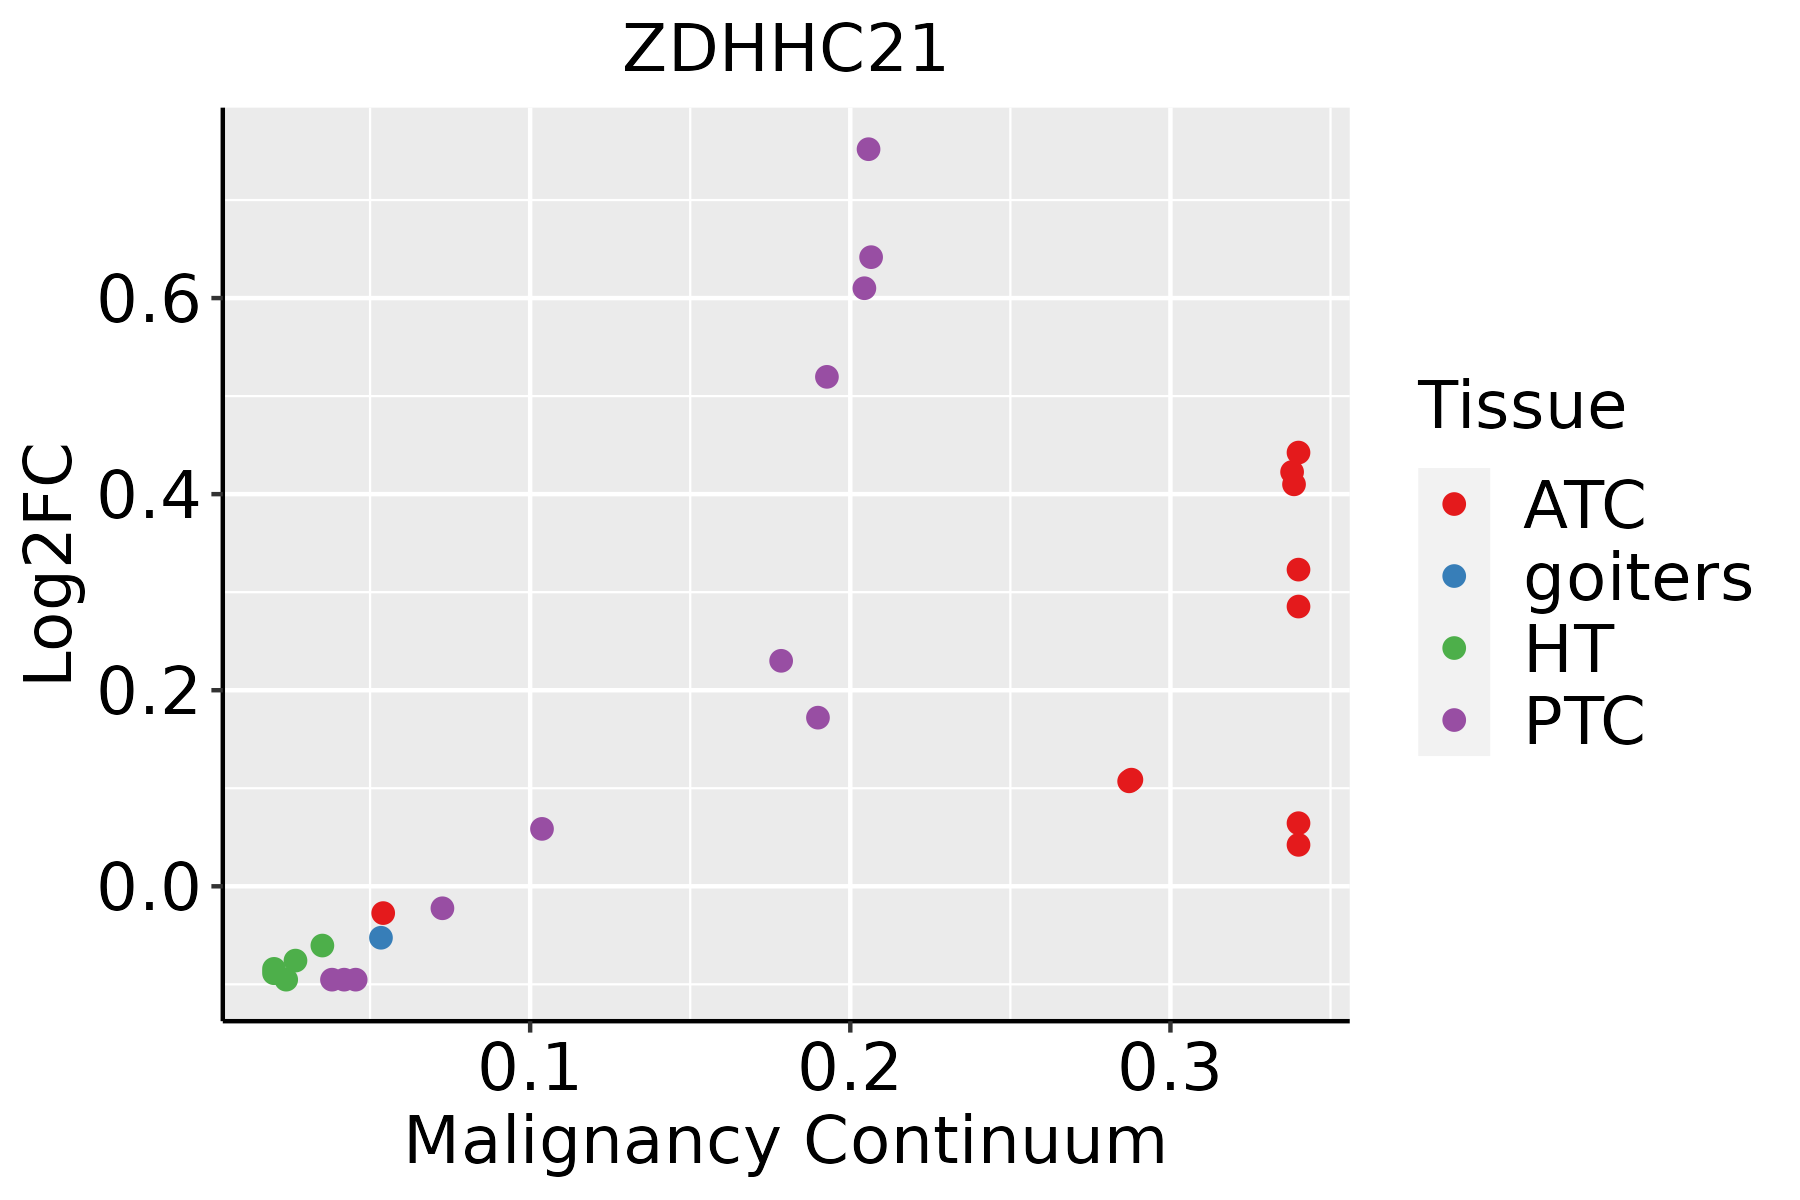 | ATC: Anaplastic thyroid cancer |
| HT: Hashimoto's thyroiditis | ||
| PTC: Papillary thyroid cancer |
| ∗log2FC in expression of this searched gene in stem-like cells from each diseased tissue sample relative to stem-like cells in normal samples in each tissue plotted against the malignancy continuum. Samples are colored based on if they are from different disease stage. |
Top |
Malignant transformation related pathway analysis |
| Find out the enriched GO biological processes and KEGG pathways involved in transition from healthy to precancer to cancer |
| Tissue | Disease Stage | Enriched GO biological Processes |
| Colorectum | AD |  |
| Colorectum | SER |  |
| Colorectum | MSS |  |
| Colorectum | MSI-H |  |
| Colorectum | FAP |  |
| ∗Top 15 enriched GO BP terms are showed in the bar plot of each disease state in each tissue. Each row represents a significant GO biological process which is colored according to the -log10(p.adjust). |
| Page: 1 2 3 4 5 6 7 8 9 |
| GO ID | Tissue | Disease Stage | Description | Gene Ratio | Bg Ratio | pvalue | p.adjust | Count |
| GO:0002064 | Colorectum | AD | epithelial cell development | 89/3918 | 220/18723 | 2.98e-11 | 3.52e-09 | 89 |
| GO:0090150 | Colorectum | AD | establishment of protein localization to membrane | 100/3918 | 260/18723 | 6.01e-11 | 6.33e-09 | 100 |
| GO:0048732 | Colorectum | AD | gland development | 149/3918 | 436/18723 | 6.07e-11 | 6.33e-09 | 149 |
| GO:0006605 | Colorectum | AD | protein targeting | 105/3918 | 314/18723 | 1.39e-07 | 6.44e-06 | 105 |
| GO:0061028 | Colorectum | AD | establishment of endothelial barrier | 23/3918 | 46/18723 | 1.14e-05 | 2.57e-04 | 23 |
| GO:0001885 | Colorectum | AD | endothelial cell development | 26/3918 | 64/18723 | 2.67e-04 | 3.29e-03 | 26 |
| GO:0003158 | Colorectum | AD | endothelium development | 44/3918 | 136/18723 | 1.20e-03 | 1.07e-02 | 44 |
| GO:0045446 | Colorectum | AD | endothelial cell differentiation | 39/3918 | 118/18723 | 1.42e-03 | 1.22e-02 | 39 |
| GO:0090257 | Colorectum | AD | regulation of muscle system process | 73/3918 | 252/18723 | 1.46e-03 | 1.24e-02 | 73 |
| GO:0008544 | Colorectum | AD | epidermis development | 87/3918 | 324/18723 | 5.99e-03 | 3.76e-02 | 87 |
| GO:00487322 | Colorectum | MSS | gland development | 143/3467 | 436/18723 | 3.85e-13 | 8.01e-11 | 143 |
| GO:00020642 | Colorectum | MSS | epithelial cell development | 81/3467 | 220/18723 | 1.02e-10 | 1.06e-08 | 81 |
| GO:00901502 | Colorectum | MSS | establishment of protein localization to membrane | 90/3467 | 260/18723 | 4.11e-10 | 3.49e-08 | 90 |
| GO:00066052 | Colorectum | MSS | protein targeting | 97/3467 | 314/18723 | 6.76e-08 | 3.46e-06 | 97 |
| GO:00610282 | Colorectum | MSS | establishment of endothelial barrier | 20/3467 | 46/18723 | 8.26e-05 | 1.35e-03 | 20 |
| GO:00902572 | Colorectum | MSS | regulation of muscle system process | 66/3467 | 252/18723 | 1.55e-03 | 1.41e-02 | 66 |
| GO:00018851 | Colorectum | MSS | endothelial cell development | 22/3467 | 64/18723 | 1.86e-03 | 1.64e-02 | 22 |
| GO:00031581 | Colorectum | MSS | endothelium development | 38/3467 | 136/18723 | 4.53e-03 | 3.19e-02 | 38 |
| GO:00030121 | Colorectum | MSS | muscle system process | 105/3467 | 452/18723 | 6.39e-03 | 4.26e-02 | 105 |
| GO:00454461 | Colorectum | MSS | endothelial cell differentiation | 33/3467 | 118/18723 | 7.66e-03 | 4.81e-02 | 33 |
| Page: 1 2 3 4 5 6 7 |
| Pathway ID | Tissue | Disease Stage | Description | Gene Ratio | Bg Ratio | pvalue | p.adjust | qvalue | Count |
| Page: 1 |
Top |
Cell-cell communication analysis |
| Identification of potential cell-cell interactions between two cell types and their ligand-receptor pairs for different disease states |
| Ligand | Receptor | LRpair | Pathway | Tissue | Disease Stage |
| Page: 1 |
Top |
Single-cell gene regulatory network inference analysis |
| Find out the significant the regulons (TFs) and the target genes of each regulon across cell types for different disease states |
| TF | Cell Type | Tissue | Disease Stage | Target Gene | RSS | Regulon Activity |
| ∗The dot plots of a searched regulon are shown for all cell subpopulations in each disease state of each tissue based on the regulon specific score inferred using pySCENIC and by calculating the average expression. |
| Page: 1 |
Top |
Somatic mutation of malignant transformation related genes |
| Annotation of somatic variants for genes involved in malignant transformation |
| Hugo Symbol | Variant Class | Variant Classification | dbSNP RS | HGVSc | HGVSp | HGVSp Short | SWISSPROT | BIOTYPE | SIFT | PolyPhen | Tumor Sample Barcode | Tissue | Histology | Sex | Age | Stage | Therapy Types | Drugs | Outcome |
| ZDHHC21 | SNV | Missense_Mutation | rs756767150 | c.445G>A | p.Ala149Thr | p.A149T | Q8IVQ6 | protein_coding | tolerated(1) | benign(0) | TCGA-B6-A0IH-01 | Breast | breast invasive carcinoma | Female | >=65 | III/IV | Unknown | Unknown | SD |
| ZDHHC21 | SNV | Missense_Mutation | novel | c.637N>A | p.Glu213Lys | p.E213K | Q8IVQ6 | protein_coding | deleterious(0.01) | probably_damaging(0.973) | TCGA-BH-A2L8-01 | Breast | breast invasive carcinoma | Female | <65 | I/II | Chemotherapy | cytoxan | CR |
| ZDHHC21 | SNV | Missense_Mutation | rs775081820 | c.374A>G | p.Asn125Ser | p.N125S | Q8IVQ6 | protein_coding | deleterious(0.04) | benign(0.001) | TCGA-AA-3848-01 | Colorectum | colon adenocarcinoma | Female | >=65 | III/IV | Unknown | Unknown | PD |
| ZDHHC21 | SNV | Missense_Mutation | c.663N>G | p.Asp221Glu | p.D221E | Q8IVQ6 | protein_coding | tolerated(1) | benign(0) | TCGA-AA-A02F-01 | Colorectum | colon adenocarcinoma | Female | >=65 | III/IV | Chemotherapy | folinic | PR | |
| ZDHHC21 | SNV | Missense_Mutation | c.70N>A | p.Trp24Arg | p.W24R | Q8IVQ6 | protein_coding | deleterious(0.01) | benign(0.282) | TCGA-DM-A28A-01 | Colorectum | colon adenocarcinoma | Male | >=65 | III/IV | Unknown | Unknown | SD | |
| ZDHHC21 | SNV | Missense_Mutation | c.28N>T | p.Asp10Tyr | p.D10Y | Q8IVQ6 | protein_coding | deleterious(0) | probably_damaging(0.99) | TCGA-AG-3893-01 | Colorectum | rectum adenocarcinoma | Male | >=65 | III/IV | Chemotherapy | folinic | CR | |
| ZDHHC21 | SNV | Missense_Mutation | novel | c.281N>C | p.Lys94Thr | p.K94T | Q8IVQ6 | protein_coding | deleterious(0.02) | probably_damaging(0.982) | TCGA-AG-A002-01 | Colorectum | rectum adenocarcinoma | Male | <65 | I/II | Unknown | Unknown | SD |
| ZDHHC21 | SNV | Missense_Mutation | rs749477638 | c.299N>T | p.Pro100Leu | p.P100L | Q8IVQ6 | protein_coding | deleterious(0) | probably_damaging(0.995) | TCGA-A5-A0G1-01 | Endometrium | uterine corpus endometrioid carcinoma | Female | >=65 | I/II | Unknown | Unknown | SD |
| ZDHHC21 | SNV | Missense_Mutation | novel | c.42N>T | p.Trp14Cys | p.W14C | Q8IVQ6 | protein_coding | deleterious(0.01) | benign(0.439) | TCGA-A5-A0G1-01 | Endometrium | uterine corpus endometrioid carcinoma | Female | >=65 | I/II | Unknown | Unknown | SD |
| ZDHHC21 | SNV | Missense_Mutation | novel | c.203N>T | p.Ser68Phe | p.S68F | Q8IVQ6 | protein_coding | deleterious(0.02) | probably_damaging(0.998) | TCGA-A5-A0G2-01 | Endometrium | uterine corpus endometrioid carcinoma | Female | <65 | III/IV | Unknown | Unknown | SD |
| Page: 1 2 3 |
Top |
Related drugs of malignant transformation related genes |
| Identification of chemicals and drugs interact with genes involved in malignant transfromation |
| (DGIdb 4.0) |
| Entrez ID | Symbol | Category | Interaction Types | Drug Claim Name | Drug Name | PMIDs |
| Page: 1 |

Copyright 2023-Present -The University of Texas Health Science Center at Houston |